
Labour Statistics: Research Papers
Maximum insights on minimum wage workers: 20 years of data

Archived Content
Information identified as archived is provided for reference, research or recordkeeping purposes. It is not subject to the Government of Canada Web Standards and has not been altered or updated since it was archived. Please "contact us" to request a format other than those available.
Skip to text
Text begins
Highlights
- Between 1998 and 2018, the proportion of employees earning minimum wageNote grew from 5.2% to 10.4%, with most of that growth occurring between 2017 and 2018. This coincided with notable minimum wage increases in Ontario, Alberta and British Columbia.
- In 1998, the percentage of minimum wage workers among employees living in urban areas was lower than that of employees living in rural areas. By 2018, the proportion of urban employees earning minimum wage had surpassed that of rural employees.
- A little less than one in four minimum wage employees had a postsecondary diploma or above in 1998 and that proportion grew to a little more than one in three minimum wage workers by 2018.
- In the early 2000s, retail trade surpassed accommodation and food services as the largest employment sector for minimum wage workers and has remained the largest since.
- The proportion of employees earning minimum wage increased at a faster pace among large firms compared with medium and small firms between 1998 and 2018.
- Over the last 20 years, the average nominal minimum wage grew by 3.5% annually while the average nominal hourly wage for all employees increased by 2.7% annually.
Introduction
In recent years, discussions surrounding the minimum wage, and its increase, have been at the centre of Canadian current affairs. The renewed interest in this topic stems mainly from high-profile campaignsNote advocating for a federal minimum wage increase to $15 per hour,Note as well as recent notable minimum wage increases in Ontario, Alberta and British Columbia. A recent report from the House of Commons identifies low-wage work as one of the key elements associated with precarious work in Canada.Note In addition to lower wages, minimum wage workers are also less likely to receive non-wage benefits such as a pension plan, supplementary health benefits or paid sick leave.
There is no consensus as to the immediate, mid-term and long-term impact of minimum wage increases. Some academics argue that increasing the minimum wage can reduce income inequalities and combat poverty.Note Others have argued that these increases might reduce employment and work hours for low-skilled workers,Note as well as employment in automatable jobs.Note Despite this lack of consensus, changes in the composition of minimum wage workers over time and their implications can be analyzed.
A Statistics Canada study found that recent minimum wage increases in Ontario and Alberta contributed to shifting the composition of minimum wage employees from individuals under 25 years of age towards older workers.Note Those types of changes have potential equity and social welfare implications. For example, following a minimum wage increase, employees with years of experience who were making above the minimum wage can find themselves joining the ranks of minimum wage workers, which can mean earning as much as an employee with no experience.
This report looks at the evolution of minimum wage prevalence over the last 20 years, using annual estimates from the Labour Force Survey (LFS). It examines changes in the profile of minimum wage employees, first through a series of gradual minimum wage increases observed from 1998 to 2017, followed by notable increases in 2018. It then looks at changes in the average minimum wage in Canada compared with the average hourly wages for all employees.
Ontario contributed the most to increases in the number of minimum wage workers in 2018
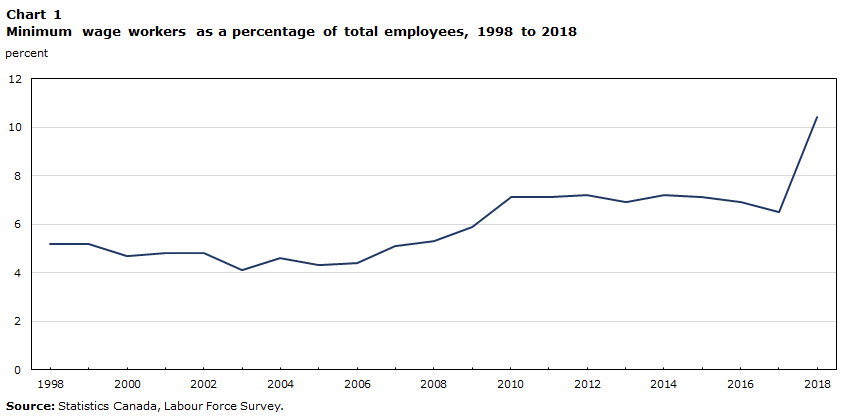
The proportion of employees who earned minimum wage in Canada hovered between 4.1% and 5.2% between 1998 and 2007 (Chart 1). It then rose just prior to, and throughout, the 2008-2009 recession as changes in economic conditions led to an increasing number of new and existing employees accepting jobs paying minimum wage. By 2010, the proportion of employees earning minimum wage was 7.1% and stabilized around that level until 2017.
From 2017 to 2018, the number of minimum wage workers increased by 617,500 (+60.7%), boosting their proportion to 10.4% of all employees. This growth coincided with significant increases to the minimum wage in several provinces across Canada.Note
The notable growth in the prevalence of minimum wage workers between 2017 and 2018 was mostly the result of increases in Ontario. Of the 617,500 more employees earning minimum wage, 77.8% were in Ontario, 10.1% were in Quebec, 7.0% were in Alberta and 5.6% were in British Columbia.
Data table for Chart 1
| Years | Percent |
|---|---|
| 1998 | 5.2 |
| 1999 | 5.2 |
| 2000 | 4.7 |
| 2001 | 4.8 |
| 2002 | 4.8 |
| 2003 | 4.1 |
| 2004 | 4.6 |
| 2005 | 4.3 |
| 2006 | 4.4 |
| 2007 | 5.1 |
| 2008 | 5.3 |
| 2009 | 5.9 |
| 2010 | 7.1 |
| 2011 | 7.1 |
| 2012 | 7.2 |
| 2013 | 6.9 |
| 2014 | 7.2 |
| 2015 | 7.1 |
| 2016 | 6.9 |
| 2017 | 6.5 |
| 2018 | 10.4 |
| Source: Statistics Canada, Labour Force Survey. | |
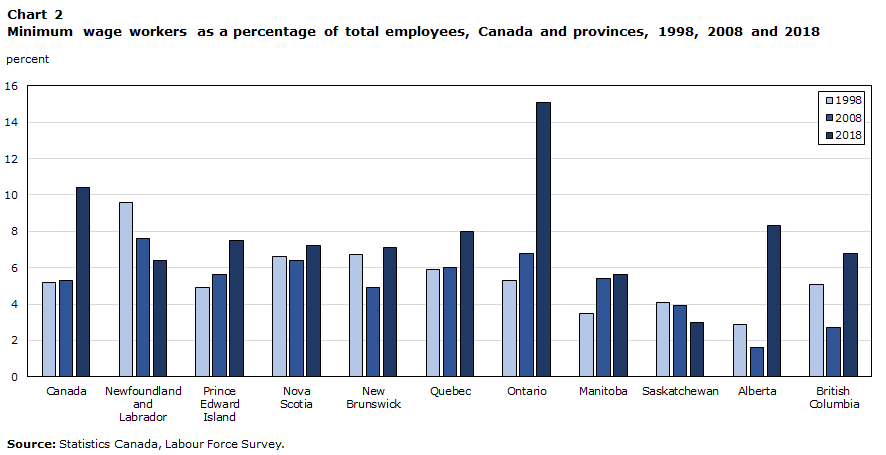
Throughout the period 1998 to 2018, the prevalence of minimum wage employees rose notably in Ontario, Alberta, British Columbia, Quebec and Prince Edward Island, mainly the result of increases between 2008 and 2018 (Chart 2). Over the same period, the percentage of employees earning minimum wage declined in Newfoundland and Labrador, and Saskatchewan.
Data table for Chart 2
| 1998 | 2008 | 2018 | |
|---|---|---|---|
| percent | |||
| Canada | 5.2 | 5.3 | 10.4 |
| Newfoundland and Labrador | 9.6 | 7.6 | 6.4 |
| Prince Edward Island | 4.9 | 5.6 | 7.5 |
| Nova Scotia | 6.6 | 6.4 | 7.2 |
| New Brunswick | 6.7 | 4.9 | 7.1 |
| Quebec | 5.9 | 6.0 | 8.0 |
| Ontario | 5.3 | 6.8 | 15.1 |
| Manitoba | 3.5 | 5.4 | 5.6 |
| Saskatchewan | 4.1 | 3.9 | 3.0 |
| Alberta | 2.9 | 1.6 | 8.3 |
| British Columbia | 5.1 | 2.7 | 6.8 |
| Source: Statistics Canada, Labour Force Survey. | |||
Employees living in urban areas more likely to earn minimum wage in recent years
On average, the cost of living is higher in urban areasNote than it is in rural areas.Note Minimum wage workers in urban areas are therefore faced with tighter budget constraints, which means that for the same wage, urban minimum wage workers may be financially worse off than their rural counterparts.
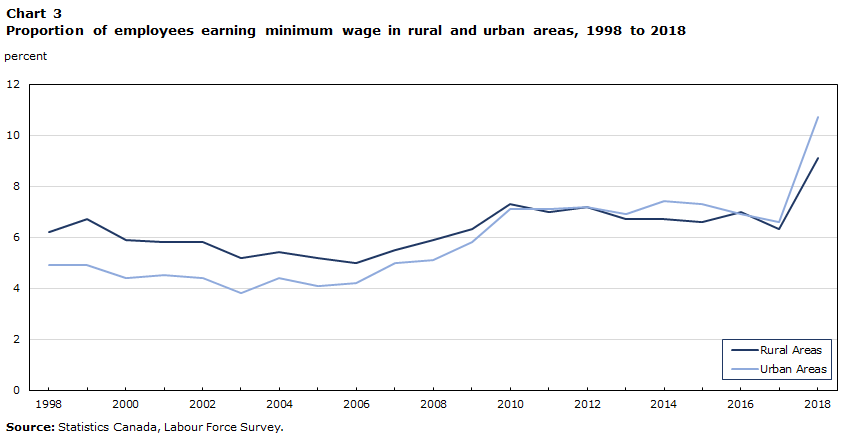
For more than 10 years, employees living in rural areas had a higher proportion of minimum wage workers compared with urban areas (Chart 3). Between 1998 and 2006, the percentage of employees earning minimum wage in rural areas varied between 5.0% and 6.7%, while it hovered around 4.5% in urban areas.
From 2007 to 2010, the proportion of employees earning minimum wage in urban areas grew at a faster rate than it did in rural areas. In 2013, the proportion of employees earning minimum wage in urban areas (6.9%) surpassed that in rural areas (6.7%) and remained higher until 2016.
Between 2017 and 2018, the proportion of employees earning minimum wage in urban areas grew significantly more than it did in rural areas. Contrary to 1998, proportionately more employees in urban areas earned minimum wage in 2018 (10.7%) compared with employees in rural areas (9.1%).
Data table for Chart 3
| Years | Rural Areas | Urban Areas |
|---|---|---|
| percent | ||
| 1998 | 6.2 | 4.9 |
| 1999 | 6.7 | 4.9 |
| 2000 | 5.9 | 4.4 |
| 2001 | 5.8 | 4.5 |
| 2002 | 5.8 | 4.4 |
| 2003 | 5.2 | 3.8 |
| 2004 | 5.4 | 4.4 |
| 2005 | 5.2 | 4.1 |
| 2006 | 5.0 | 4.2 |
| 2007 | 5.5 | 5.0 |
| 2008 | 5.9 | 5.1 |
| 2009 | 6.3 | 5.8 |
| 2010 | 7.3 | 7.1 |
| 2011 | 7.0 | 7.1 |
| 2012 | 7.2 | 7.2 |
| 2013 | 6.7 | 6.9 |
| 2014 | 6.7 | 7.4 |
| 2015 | 6.6 | 7.3 |
| 2016 | 7.0 | 6.9 |
| 2017 | 6.3 | 6.6 |
| 2018 | 9.1 | 10.7 |
| Source: Statistics Canada, Labour Force Survey. | ||
Characteristics of minimum wage workers
The profile of minimum wage workers evolved between 1998 and 2018 following increases in minimum wage and concurrent changes in economic conditions. Table 1 illustrates the evolution of the characteristics of minimum wage workers over this period.
| Characteristics | Percentage of total minimum wage workers | Minimum wage workers as a percentage of total employees | ||||
|---|---|---|---|---|---|---|
| 1998 | 2008 | 2018 | 1998 | 2008 | 2018 | |
| percent | ||||||
| Sex | ||||||
| Male | 41.2 | 39.6 | 41.2 | 4.1 | 4.2 | 8.5 |
| Female | 58.8 | 60.4 | 58.8 | 6.4 | 6.4 | 12.3 |
| Age | ||||||
| 15 to 24 | 60.7 | 63.6 | 52.3 | 18.9 | 19.0 | 35.9 |
| 25 to 54 | 34.2 | 28.7 | 34.3 | 2.4 | 2.2 | 5.4 |
| 55 and over | 5.1 | 7.7 | 13.4 | 3.3 | 3.0 | 7.4 |
| Immigrant statusTable 1 Note 1 | ||||||
| Landed immigrant | Note ..: not available for a specific reference period | 21.1 | 30.7 | Note ..: not available for a specific reference period | 5.3 | 12.0 |
| Canadian-born | Note ..: not available for a specific reference period | 78.9 | 69.3 | Note ..: not available for a specific reference period | 5.3 | 9.8 |
| Economic family status | ||||||
| Unattached individuals and lone-parent employees | 22.7 | 24.7 | 25.7 | 5.5 | 5.6 | 11.3 |
| Employees in other economic family types | 77.3 | 75.3 | 74.3 | 5.1 | 5.2 | 10.1 |
| Educational attainment | ||||||
| High school or less | 76.8 | 75.7 | 65.1 | 8.3 | 9.6 | 20.0 |
| Postsecondary diploma and above | 23.2 | 24.3 | 34.9 | 2.3 | 2.2 | 5.5 |
| Job status | ||||||
| Full-time | 43.5 | 40.6 | 45.8 | 2.8 | 2.6 | 5.8 |
| Part-time | 56.5 | 59.4 | 54.2 | 16.2 | 17.4 | 31.9 |
.. not available for a specific reference period
|
||||||
Sex
Throughout the 1998-2018 period, approximately 6 out of 10 minimum wage workers were women. Among women, the proportion of workers who were minimum wage workers was also higher than men’s over the 20-year period, however it increased at a slightly faster pace among men between 2008 and 2018.
Age
In 1998, approximately 6 out of 10 minimum wage workers (60.7%) were youth aged 15 to 24. By 2018, relatively more minimum wage workers were core-aged (aged 25 to 54) or older workers (aged 55 and over), while youth minimum-wage workers now accounted for closer to 5 out of 10 minimum wage workers (52.3%).
Over the last 20 years, the prevalence of employees earning minimum wage remained higher among youth workers. However, it grew at a faster pace among both core-aged and older workers between 2008 and 2018.
Immigrant status
In 2008, the proportion of immigrant employees who earned minimum wage (5.3%) was the same as that of Canadian-born workers (5.1%). Between 2008 and 2018, however, the percentage of immigrant employees earning minimum wage increased at a faster pace than it did for Canadian-born, resulting in a gap emerging between their respective proportions. In 2018, 12.0% of immigrant employees earned minimum wage compared with 9.8% of Canadian-born employees.
Economic family status
The proportion of unattached individuals and lone-parent employees earning minimum wage was similar to that of workers in other economic family typesNote in 1998 and 2008. In 2018, 11.3% of unattached individuals and lone-parent employees earned minimum wage compared with 10.1% for employees in other economic family types.
Educational attainment
Between 1998 and 2018, the composition of minimum wage workers shifted from workers with lower educational attainment to workers with higher educational attainment, partly reflecting the increasing educational attainment in the overall workforce over the period.Note In 1998, a little less than one in four minimum wage employees (23.2%) had a postsecondary diploma or above and that proportion grew to a little more than one in three (34.9%) minimum wage workers by 2018.
Over this 20-year period, the percentage of employees with a postsecondary diploma who earned minimum wage remained lower than that of employees with no postsecondary diploma. The two proportions also grew at similar paces. From 1998 to 2018, among all employees with a postsecondary diploma, the proportion who earned minimum wage rose from 2.3% to 5.5% while the proportion among those with a high school diploma or less increased from 8.3% to 20.0%.
Job status
The percentage of minimum wage workers among full-time employees has remained significantly lower than that of part-time employees over the last 20 years. However, between 2008 and 2018, the proportion of full-time employees earning minimum wage increased at a faster rate than that of part-time employees. In 2008, 2.6% of all full-time employees earned minimum wage compared with 17.4% of part-time employees. Between 2008 and 2018, that proportion more than doubled for full-time employees (to 5.8%) and went up to 31.9% for part-time employees.
Retail trade surpassed accommodation and food services as the largest employment sector for minimum wage workers
In 1998, the majority of minimum wage employees worked in either accommodation and food services (28.2%) or retail trade (26.8%). In the early 2000s, retail trade surpassed accommodation and food services as the largest employment sector for minimum wage workers and has remained the largest since. In 2018, 32.7% of all minimum wage workers were employed in retail trade while 26.0% worked in accommodation and food services.
Between 1998 and 2006, among all employees in the industry, the proportion of employees earning minimum wage in accommodation and food services decreased slightly, while it remained relatively steady in retail trade. From 2006 to 2018, the percentage of employees earning minimum wage grew in every industry group and substantially faster in retail trade (from 11.0% in 2006 to 27.4% in 2018). By 2018, the proportion of employees earning minimum wage in retail trade was close to 2.5 times what it was in 2006 (Chart 4).

Data table for Chart 4
| Years | Retail trade | Accommodation and food services | Other industries combined |
|---|---|---|---|
| 1998=100 | |||
| 1998 | 100 | 100 | 100 |
| 1999 | 106 | 107 | 96 |
| 2000 | 96 | 94 | 84 |
| 2001 | 103 | 96 | 84 |
| 2002 | 106 | 94 | 81 |
| 2003 | 87 | 83 | 72 |
| 2004 | 102 | 93 | 78 |
| 2005 | 94 | 87 | 73 |
| 2006 | 97 | 86 | 75 |
| 2007 | 118 | 95 | 85 |
| 2008 | 119 | 103 | 88 |
| 2009 | 138 | 107 | 99 |
| 2010 | 160 | 121 | 127 |
| 2011 | 159 | 122 | 125 |
| 2012 | 162 | 130 | 124 |
| 2013 | 158 | 129 | 114 |
| 2014 | 163 | 127 | 126 |
| 2015 | 166 | 127 | 121 |
| 2016 | 169 | 128 | 110 |
| 2017 | 159 | 119 | 106 |
| 2018 | 242 | 178 | 184 |
| Source: Statistics Canada, Labour Force Survey. | |||
The proportion of employees earning minimum wage in large firms was 2.8 times higher in 2018 than it was in 1998
From 1998 to 2018, minimum wage employees became increasingly concentrated in large firms,Note partly reflecting the changing composition in overall employment towards larger firms over the period.Note In 1998, 29.6% of all minimum wage workers were employed in large firms. By 2018, that percentage had increased to 45.5%. Over the same period, the percentage of all minimum wage workers employed in small firmsNote decreased while it was steady in medium firms.Note
The prevalence of employees earning minimum wage among both medium and large firms also grew at a faster pace than that among small firms over the last 20 years (Chart 5). Between 1998 and 2018, the proportion of employees earning minimum wage rose from 3.4% to 9.4% among large firms, from 4.8% to 9.7% among medium firms and from 9.7% to 14.2% among small firms. Over the same period, although the median wage in large firms remained higher than that in small and medium firms, it increased at a slower pace. These observations point to a potential erosion of the large-firm wage premium over time.Note

Data table for Chart 5
| Years | Small firms | Medium firms | Large firms |
|---|---|---|---|
| 1998=100 | |||
| 1998 | 100 | 100 | 100 |
| 1999 | 102 | 100 | 103 |
| 2000 | 91 | 84 | 99 |
| 2001 | 93 | 83 | 108 |
| 2002 | 89 | 82 | 110 |
| 2003 | 78 | 71 | 95 |
| 2004 | 82 | 81 | 114 |
| 2005 | 80 | 72 | 104 |
| 2006 | 74 | 76 | 112 |
| 2007 | 91 | 89 | 124 |
| 2008 | 91 | 93 | 132 |
| 2009 | 95 | 105 | 153 |
| 2010 | 112 | 134 | 180 |
| 2011 | 109 | 127 | 188 |
| 2012 | 111 | 127 | 193 |
| 2013 | 111 | 123 | 180 |
| 2014 | 110 | 134 | 192 |
| 2015 | 108 | 135 | 188 |
| 2016 | 98 | 129 | 189 |
| 2017 | 93 | 125 | 177 |
| 2018 | 147 | 202 | 280 |
| Source: Statistics Canada, Labour Force Survey. | |||
The average minimum wage in Canada increased at a faster pace than the average wage for all employees
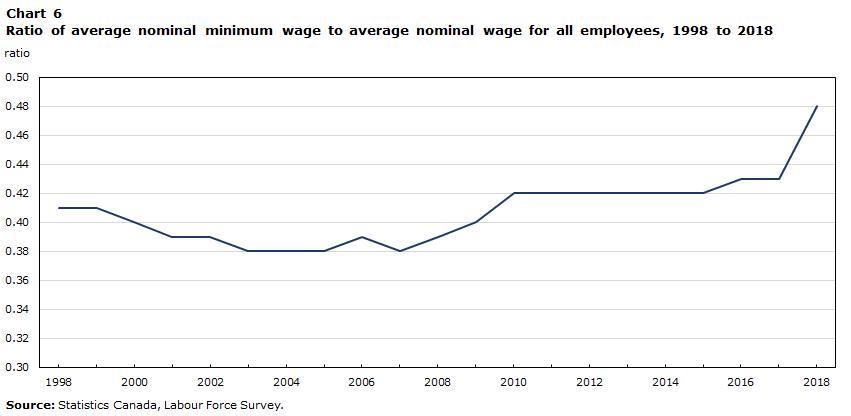
Compared with 1998, minimum wage employees fared relatively better in 2018 when comparing the average nominal minimum wage with the average nominal wage.Note Over this 20-year period, the average wage grew by 2.7% annually while the average minimum wageNote increased by 3.5% annually.
The ratio of average minimum wage to average wage for all employees expresses the minimum wage in terms of percentage of the average wage for all employees. From 1998 to 2007, the ratio decreased from 0.41 to 0.38 (Chart 6), meaning that the average minimum wage in Canada increased at slower pace compared with the average wage for all employees. The ratio then grew steadily after 2007, to 0.43 in 2017, meaning that the average minimum wage rose faster than the average wage. Between 2017 and 2018, following notable minimum wage increases in Ontario, Alberta and British Columbia, the ratio grew to 0.48, the highest in the last 20 years.
Quebec, Ontario and British Columbia all experienced declines in their ratio of average minimum wage to average hourly wage between 1998 and 2008 while the ratio among the seven remaining provinces either grew or remained relatively stable (Chart 7). After 2008, and leading up to 2018, every province, with the exception of Saskatchewan, experienced growth in their ratio, meaning that the minimum wage increased at a faster pace than the average wage in those provinces. The most notable ratio increases were in Ontario, Alberta and British Columbia.
Data table for Chart 6
| Years | Ratio |
|---|---|
| 1998 | 0.41 |
| 1999 | 0.41 |
| 2000 | 0.40 |
| 2001 | 0.39 |
| 2002 | 0.39 |
| 2003 | 0.38 |
| 2004 | 0.38 |
| 2005 | 0.38 |
| 2006 | 0.39 |
| 2007 | 0.38 |
| 2008 | 0.39 |
| 2009 | 0.40 |
| 2010 | 0.42 |
| 2011 | 0.42 |
| 2012 | 0.42 |
| 2013 | 0.42 |
| 2014 | 0.42 |
| 2015 | 0.42 |
| 2016 | 0.43 |
| 2017 | 0.43 |
| 2018 | 0.48 |
| Source: Statistics Canada, Labour Force Survey. | |

Data table for Chart 7
| 1998 | 2008 | 2018 | |
|---|---|---|---|
| ratio | |||
| Canada | 0.41 | 0.39 | 0.48 |
| Newfoundland and Labrador | 0.40 | 0.42 | 0.43 |
| Prince Edward Island | 0.45 | 0.46 | 0.52 |
| Nova Scotia | 0.42 | 0.44 | 0.46 |
| New Brunswick | 0.42 | 0.43 | 0.49 |
| Quebec | 0.44 | 0.42 | 0.46 |
| Ontario | 0.42 | 0.39 | 0.51 |
| Manitoba | 0.38 | 0.44 | 0.46 |
| Saskatchewan | 0.41 | 0.42 | 0.40 |
| Alberta | 0.34 | 0.35 | 0.45 |
| British Columbia | 0.41 | 0.37 | 0.45 |
| Source: Statistics Canada, Labour Force Survey. | |||
Conclusion
In recent years, minimum wage increases and their potential impact on the labour market have been at the forefront of Canadian current affairs. Despite a lack of consensus as to the impact of changes in minimum wage, the long-term trends discussed in this report aim to better inform on the implications of changing economic conditions and minimum wage increases on the profile of minimum wage workers in Canada.
The proportion of employees earning minimum wage rose just prior to, and throughout, the 2008-2009 recession as changes in economic conditions forced an increasing number of new and existing workers to accept jobs paying minimum wage. Then Alberta, Ontario and British Columbia increased their minimum wage significantly in 2018, bringing the proportion of employees earning minimum wage to unprecedented levels. All these changes also had implications on the composition of minimum wage employees. Compared with 1998, minimum wage employees in 2018 were relatively more likely to live in urban areas, work in retail trade, be employed in a large firm, work full-time and be older than 24.
The report also explored changes in the relative wage of minimum wage workers over the last 20 years. While the average nominal wage of all employees grew by 2.7% annually, the average nominal minimum wage in Canada grew by 3.5%. Therefore, even though there were relatively more minimum wage workers in 2018 than there were in 1998, they fared relatively better in 2018 when comparing only the average nominal minimum wage to the average nominal wage for all employees.
Start of text box
Minimum wage workers in the first half of 2019
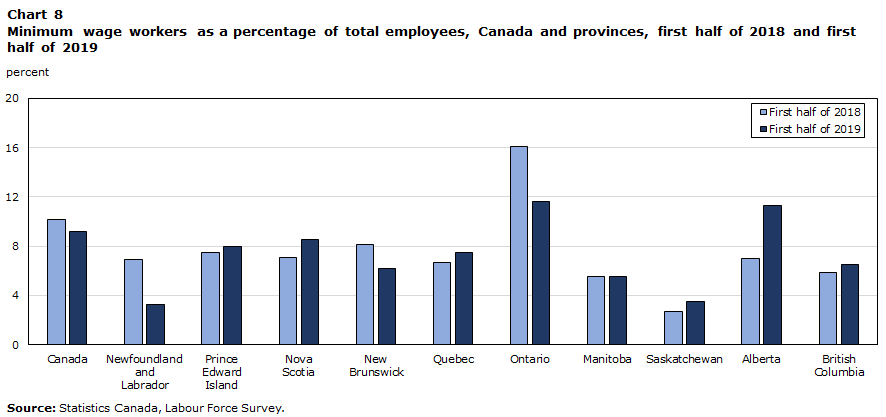
The Labour Force Survey results from the first half of 2019 show that, between the first half of 2018 and the first half of 2019, the number of minimum wage employees in Canada decreased by 116,600. Concurrently, the percentage of employees earning minimum wage declined from 10.2% to 9.2%.
This decline was almost entirely the result of fewer minimum wage workers in Ontario, where the proportion of employees earning minimum wage decreased from 16.1% to 11.6% (Chart 8). The percentage of employees earning minimum wage also declined in Newfoundland and Labrador, and New Brunswick.
Data table for Chart 8
| First half of 2018 | First half of 2019 | |
|---|---|---|
| percent | ||
| Canada | 10.2 | 9.2 |
| Newfoundland and Labrador | 6.9 | 3.3 |
| Prince Edward Island | 7.5 | 8.0 |
| Nova Scotia | 7.1 | 8.5 |
| New Brunswick | 8.1 | 6.2 |
| Quebec | 6.7 | 7.5 |
| Ontario | 16.1 | 11.6 |
| Manitoba | 5.5 | 5.5 |
| Saskatchewan | 2.7 | 3.5 |
| Alberta | 7.0 | 11.3 |
| British Columbia | 5.9 | 6.5 |
| Source: Statistics Canada, Labour Force Survey. | ||
End of text box
Appendix 1 – Data source, methods and definitions
Data sources
This study uses data from the Labour Force Survey (LFS), a monthly sample survey that collects labour-market information as well as demographic and family-relationship information for all household members aged 15 and over. Excluded from the survey's coverage are persons living on reserves and other Aboriginal settlements, full-time members of the Canadian Armed Forces, and people living in institutions such as penal institutions and nursing homes. These groups together represent less than 2% of the Canadian population aged 15 and over.
The LFS began collecting earnings information from all employees for their main job in 1997. Respondents are asked to report their hourly rate of pay or their regular salary (weekly, bi-weekly, etc.) before taxes and other deductions, including tips, commissions and bonuses. Hourly and weekly earnings are calculated in conjunction with usual paid work hours per week.
Definitions
Minimum hourly wage rates are obtained from Employment and Social Development Canada (ESDC) and can be viewed at Minimum hourly wages for Canadian Adult Workers since 1965. In this report, minimum wage workers include employees who earn the minimum wage for experienced adult workers set by their province as well as employees who earn less than this threshold. People who are employed in two or more jobs simultaneously (multiple jobholders) are considered minimum wage employees only if they earn minimum wage or less at their main job.
References
Bloom, Nicholas, Fatih Guvenen, Benjamin S. Smith, Jae Song, and Till von Wachter. 2018. The Disappearing Large-Firm Wage Premium. AEA Papers and Proceedings, 108: 317 to 22.
Canada, Parliament, House of Commons, Standing Committee on Human Resources and Social Development and the Status of Persons with Disabilities. June 2019. Precarious Work: Understanding the Changing Nature of Work in Canada. 42nd Parliament, 1st Session (Chair: Bryan May).
Green, David. 2015. “The case for increasing the minimum wage: What does the academic literature tell us?” Behind the Numbers. April. Canadian Centre for Policy Alternatives. p. 1 to 10.
Gunderson, Morley. 2007. Minimum Wages: Issues and Options for Ontario. Paper prepared for the Ontario Ministry of Finance.
Lordan, G. and D. Neumark. 2018. People Versus Machines: The Impact of Minimum Wages on Automatable Jobs. NBER Working Paper No. 23667. Cambridge, MA: The National Bureau of Economic Research.
Morissette, René and Dominique Dionne-Simard. 2018. “Recent changes in the composition of minimum wage workers.” Insights on Canadian Society. June. Statistics Canada Catalogue no. 75-006-X.
- Date modified: