
Labour Statistics: Research Papers
Students in the labour market: After the recession

Archived Content
Information identified as archived is provided for reference, research or recordkeeping purposes. It is not subject to the Government of Canada Web Standards and has not been altered or updated since it was archived. Please "contact us" to request a format other than those available.
by Dylan Saunders and Myriam Hazel
Skip to text
Text begins
Start of text box
Overview of the study
The participation and employment rates of full-time students aged 15 to 24 were more negatively affected by the 2008/2009 recession than those of non-students.
- Between the 2007/2008 and 2016/2017 school years, the student participation rate declined 3.9 percentage points to 42.9%, compared with virtually no change in the rate for non-students, at 87.4%. Trends in the student and non-student employment rates were also similar.
- Over the same period, younger students (i.e., aged 15 to 17) and male students experienced relatively larger declines in their participation and employment rates compared with older students (i.e., aged 18 to 24) and female students. Possible non-cyclical factors may have exacerbated this trend, including the increased labour force participation of workers aged 55 and over.
- Declines in the participation and employment rates of students were registered in about half of the provinces, with Newfoundland and Labrador being the sole province reporting an increase in these rates.
End of text box
Introduction
The labour market situation of Canadian youth has been a source of preoccupation of late, with key labour market indicators related to this group not having fully recovered from their pre-recession levels nearly 10 years after the economic downturn in 2008/2009. As in earlier recessions, previous research noted that following the start of the economic downturn in October 2008, youth bore a disproportionate share of job losses.Note 1 While only contributing to roughly 15% of all employed persons at the time, youth contributed to more than half of the decrease in employment by October 2009.Note 1 Among youth, students were the most negatively affected by the downturn.
In many aspects, working is an essential responsibility for students. Some students, for example, need to work to pay for the cost of attending college and university or to help with family finances. Early work experience, particularly in high school, is also believed to be important for later economic success by facilitating the transition from school to the labour force. Students who work can enhance their future employment prospects and earnings potential by learning work-related skills, forging contacts with employers, and honing their preferences.Note 2 A recent Canadian study found that individuals in their twenties who had worked as teenagers during the school year made more money, were more likely to find jobs that suited them, and developed better networks.Note 3 Hence, reduced work experience among high school and college students may signal both short-term economic hardship and long-term negative effects on their employment and earnings.
With population aging and the associated shrinking labour force, lower student labour force participation may also represent a key underutilized source of labour supply to be tapped into, thereby helping stimulate potential economic growth.Note 4
Arguably, the post-recession decline in the participation and employment rates of students may reflect cyclical fluctuations, implying that these rates may increase if labour market conditions remain strong.Note 5 Nonetheless, this analysis looks at whether other factors may have also played a role in these rate decreases.
More specifically, using the Labour Force Survey, this analysis first provides details on how full-time students have fared in the nine years following the 2008/2009 recession by comparing their participation and employment rates to those of the non-student population in the same age group. It then looks at these trends by age group and gender, and highlights several non-cyclical factors that may have contributed to these developments. The analysis is centered on full-time students, as they represent nearly 60% of the 15- to 24-year-old population, while part-time students account for approximately 4%. The focus of the analysis is on the period following the 2008/2009 recession up to the 2016/2017 school year. No comparison will be made with other recessionary periods.
Both the participation and the employment rate are analyzed as they capture slightly different aspects of the labour market. While the employment rate is an indicator of the proportion of youth who hold a job, the participation rate gives an additional layer of information by providing the number of young people that either have a job or are looking for one (as a share of their population).
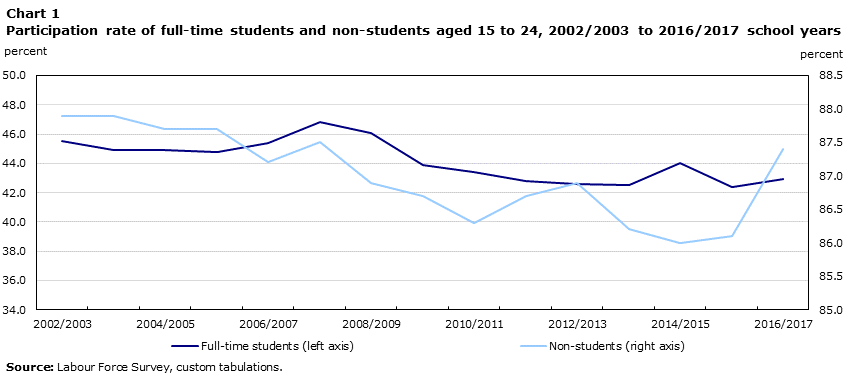
The participation rate of students decreased following the 2008/2009 downturn, while the rate of non-students was little changed
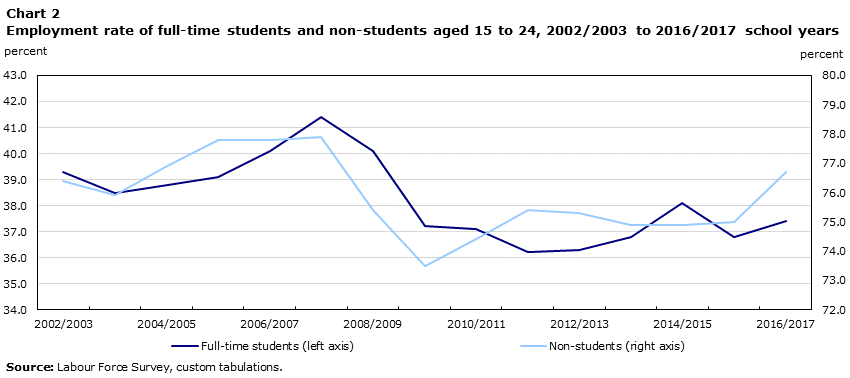
The participation and employment rates of full-time students aged 15 to 24 registered notable declines following the 2008/2009 recession. In fact, this group experienced the largest decrease in the participation and employment rates among youth, which wasn't completely offset some nine years later.
In the 2007/2008 academic year, the school year preceding the recession, the participation rate for students reached 46.8%, its highest level since the start of the series in 1976. This high rate was partly driven by older students (i.e., those aged 18 to 24) whose participation rate also rose to its highest rate on record, at 51.1% that year. By 2016/2017, however, the rate for students decreased to 42.9%, or 3.9 percentage points below the 2007/2008 level. Similarly, the employment rate for this group declined from 41.4% to 37.4% over the same period.
In contrast, the participation rate for non-students was little changed at 87.4% in 2016/2017, while the employment rate for this group edged down 1.2 percentage points, reaching 76.7% in 2016/2017.
Data table for Chart 1
| School year | Full-time students (left axis) | Non-students (right axis) |
|---|---|---|
| percent | ||
| 2002/2003 | 45.5 | 87.9 |
| 2003/2004 | 44.9 | 87.9 |
| 2004/2005 | 44.9 | 87.7 |
| 2005/2006 | 44.8 | 87.7 |
| 2006/2007 | 45.4 | 87.2 |
| 2007/2008 | 46.8 | 87.5 |
| 2008/2009 | 46.1 | 86.9 |
| 2009/2010 | 43.9 | 86.7 |
| 2010/2011 | 43.4 | 86.3 |
| 2011/2012 | 42.8 | 86.7 |
| 2012/2013 | 42.6 | 86.9 |
| 2013/2014 | 42.5 | 86.2 |
| 2014/2015 | 44.0 | 86.0 |
| 2015/2016 | 42.4 | 86.1 |
| 2016/2017 | 42.9 | 87.4 |
| Source: Labour Force Survey, custom tabulations. | ||
Data table for Chart 2
| School year | Full-time students (left axis) | Non-students (right axis) |
|---|---|---|
| percent | ||
| 2002/2003 | 39.3 | 76.4 |
| 2003/2004 | 38.5 | 75.9 |
| 2004/2005 | 38.8 | 76.9 |
| 2005/2006 | 39.1 | 77.8 |
| 2006/2007 | 40.1 | 77.8 |
| 2007/2008 | 41.4 | 77.9 |
| 2008/2009 | 40.1 | 75.4 |
| 2009/2010 | 37.2 | 73.5 |
| 2010/2011 | 37.1 | 74.4 |
| 2011/2012 | 36.2 | 75.4 |
| 2012/2013 | 36.3 | 75.3 |
| 2013/2014 | 36.8 | 74.9 |
| 2014/2015 | 38.1 | 74.9 |
| 2015/2016 | 36.8 | 75.0 |
| 2016/2017 | 37.4 | 76.7 |
| Source: Labour Force Survey, custom tabulations. | ||
These labour market conditions for full-time students occurred at a time when their population rose slightly both in absolute terms and as a share of the youth population. In 2016/2017, the share of full-time students within the youth population rose to 58.7% from 57.0% in 2007/2008, with most of the rise occurring in the aftermath of the last recession (i.e., in the 2009/2010 school year).Note 6 Such increase is consistent with studies that suggest the share of youth who attend school is moderately correlated with labour market conditions.Note 7

Data table for Chart 3
| School year | Full-time students (left axis) | Non-students (right axis) |
|---|---|---|
| percent | ||
| 1996/1997 | 57.4 | 39.1 |
| 1997/1998 | 58.0 | 38.5 |
| 1998/1999 | 57.3 | 39.2 |
| 1999/2000 | 56.8 | 39.6 |
| 2000/2001 | 55.9 | 39.8 |
| 2001/2002 | 56.4 | 39.3 |
| 2002/2003 | 56.0 | 39.5 |
| 2003/2004 | 55.7 | 39.7 |
| 2004/2005 | 56.9 | 38.8 |
| 2005/2006 | 57.2 | 38.5 |
| 2006/2007 | 56.7 | 39.1 |
| 2007/2008 | 57.0 | 38.8 |
| 2008/2009 | 56.4 | 39.5 |
| 2009/2010 | 57.9 | 38.2 |
| 2010/2011 | 58.3 | 37.6 |
| 2011/2012 | 58.5 | 37.3 |
| 2012/2013 | 58.5 | 37.3 |
| 2013/2014 | 58.0 | 38.0 |
| 2014/2015 | 57.8 | 38.4 |
| 2015/2016 | 57.7 | 38.3 |
| 2016/2017 | 58.7 | 37.2 |
| Source: Labour Force Survey, custom tabulations. | ||
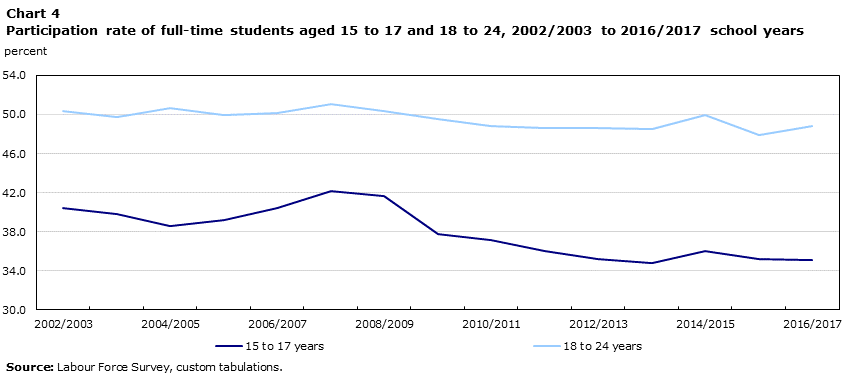
Notable declines in the labour force participation of younger students and male students
Within the population of full-time students, the decrease in the labour force participation of younger students was larger than for older students. More specifically, the participation rate of younger students (i.e., those aged 15 to 17) fell 7.1 percentage points to 35.1% between 2007/2008 and 2016/2017, compared with a decline of 2.3 percentage points to 48.8% for older students. These changes further contributed to the widening of the gap between the participation rates of these two groups over the period.
Data table for Chart 4
| School year | 15 to 17 years | 18 to 24 years |
|---|---|---|
| percent | ||
| 2002/2003 | 40.4 | 50.4 |
| 2003/2004 | 39.8 | 49.7 |
| 2004/2005 | 38.6 | 50.7 |
| 2005/2006 | 39.2 | 50.0 |
| 2006/2007 | 40.4 | 50.2 |
| 2007/2008 | 42.2 | 51.1 |
| 2008/2009 | 41.6 | 50.4 |
| 2009/2010 | 37.7 | 49.5 |
| 2010/2011 | 37.1 | 48.8 |
| 2011/2012 | 36.0 | 48.6 |
| 2012/2013 | 35.2 | 48.6 |
| 2013/2014 | 34.8 | 48.5 |
| 2014/2015 | 36.0 | 50.0 |
| 2015/2016 | 35.2 | 47.9 |
| 2016/2017 | 35.1 | 48.8 |
| Source: Labour Force Survey, custom tabulations. | ||
The factors behind the greater rate declines among younger students are not clear. In the United States, studies have pointed to increased parental emphasis on education and extracurricular activities to help explain the decline in the participation rate among youth, as time spent on school-related activities or volunteering can take away from the hours left in the day for a job.Note 8 At the same time, volunteering may be considered a close substitute to paid employment by providing opportunities for students to gain valuable work experience. However, volunteer rates among youth have remained fairly stable since 2007, providing little evidence that Canadian students have traded off paid work with unpaid work.Note 9
Another possible factor behind the declining labour force participation of younger students is the increased competition from other age groups, notably older students and workers aged 55 and over. Contrasting with the declining labour force participation observed among younger students, the labour force participation of those aged 55 and over grew rapidly between 2007/2008 and 2016/2017, from 34.0% to 37.8%. In 2007/2008, there were about six employed people aged 55 and over for every 15- to 17-year-old student with a job. By 2016/2017, this ratio climbed to about 12 to 1, with the increase partly intensified by a decrease in the population of younger students over this period.
Older people are hence staying in the labour force longer than before the last recession; and a number of them have taken on 'bridge' jobs, which are typically part-time or part-year and lower-wage jobs. These types of jobs are common in retail trade and accommodation and food services, two industries in which younger students are concentrated. In 2007/2008, the number of older workers employed in these industries was similar to the number of younger students. By 2016/2017, their number was more than double the number of younger students.Note 10 At the same time, the ratio of older students relative to younger students employed in retail trade and accommodation and food services also increased, from 1.1 to 1.8.
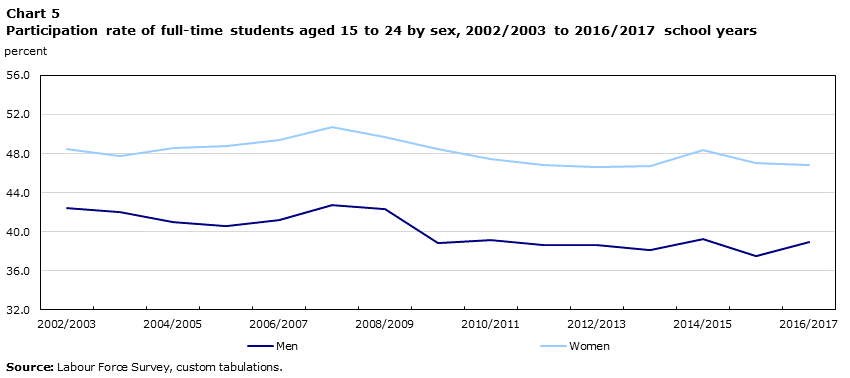
To some extent, male students have also fared worse than their female counterparts since the last recession. Since 2007/2008, the participation rate of male students fell by 3.8 percentage points to 38.9%, compared with a decline of 3.9 percentage points to 46.8% for female students. Given that in 2007/2008, male students had a lower rate compared with female students, a decline of a similar magnitude in the participation rate among the two sexes implied that, in relative terms, male students experienced a sharper decline in their participation rate than female students.
Similar to what happened with the participation and employment rates of younger and older students over time, a gender gap in favour of female students emerged following the economic downturn of the early 1990s. In contrast, within the core age population (25- to 54-year-olds), men have historically had higher participation and employment rates than women, although this gap has shrunk over time.
Data table for Chart 5
| School year | Men | Women |
|---|---|---|
| percent | ||
| 2002/2003 | 42.4 | 48.5 |
| 2003/2004 | 42.0 | 47.7 |
| 2004/2005 | 41.0 | 48.6 |
| 2005/2006 | 40.6 | 48.8 |
| 2006/2007 | 41.2 | 49.4 |
| 2007/2008 | 42.7 | 50.7 |
| 2008/2009 | 42.3 | 49.7 |
| 2009/2010 | 38.8 | 48.5 |
| 2010/2011 | 39.1 | 47.4 |
| 2011/2012 | 38.6 | 46.8 |
| 2012/2013 | 38.6 | 46.6 |
| 2013/2014 | 38.1 | 46.7 |
| 2014/2015 | 39.2 | 48.4 |
| 2015/2016 | 37.5 | 47.0 |
| 2016/2017 | 38.9 | 46.8 |
| Source: Labour Force Survey, custom tabulations. | ||
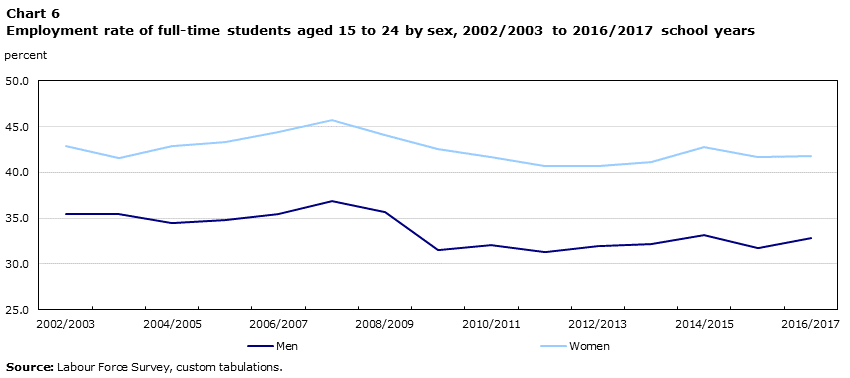
Data table for Chart 6
| School year | Men | Women |
|---|---|---|
| percent | ||
| 2002/2003 | 35.5 | 42.9 |
| 2003/2004 | 35.4 | 41.6 |
| 2004/2005 | 34.5 | 42.9 |
| 2005/2006 | 34.8 | 43.3 |
| 2006/2007 | 35.5 | 44.4 |
| 2007/2008 | 36.9 | 45.7 |
| 2008/2009 | 35.7 | 44.1 |
| 2009/2010 | 31.5 | 42.6 |
| 2010/2011 | 32.1 | 41.7 |
| 2011/2012 | 31.3 | 40.7 |
| 2012/2013 | 31.9 | 40.7 |
| 2013/2014 | 32.2 | 41.1 |
| 2014/2015 | 33.1 | 42.8 |
| 2015/2016 | 31.7 | 41.7 |
| 2016/2017 | 32.8 | 41.8 |
| Source: Labour Force Survey, custom tabulations. | ||
The gap of the participation and employment rates between the female and male students can be due to a number of factors. For example, women are over-represented in the jobs that are often held by youth.Note 11 The largest occupations in terms of student employment in 2016/2017 were cashiers; retail salespersons; food counter attendants, kitchen helpers and related support occupations; store shelf stockers, clerks and order fillers; program leaders and instructors in recreation, sport and fitness; and food and beverage servers. These occupations employed over half of all students in 2016/2017, and were positions that were more likely to be taken on by women (with the exception of store shelf stockers, clerks and order fillers).Note 12
The participation and employment rates of students declined in about half of the provinces
Since the 2008/2009 recession, student participation and employment rates were down in about half of the provinces, with Manitoba and Ontario reporting the largest declines. Newfoundland and Labrador, which had the lowest provincial rates in 2008/2009, was the sole province to report an increase in the participation (+11.2 percentage points) and employment (+9.7 percentage points) rates. The rise in labour force participation in this province was observed among both sexes and older students. The increase was also spread across several sectors, including the accommodation and food services as well as the trade sectors. These increases, combined with decreases in other provinces, such as Manitoba, contributed to the reduced dispersion of provincial employment and participation rates over the last 10 years. This convergence of provincial rates for students has also been observed among other age groups, particularly those aged 25 to 44.Note 13
Over the same period, changes in the participation and employment rates of non-students were generally more muted across provinces. The participation rate of non-students in Newfoundland and Labrador rose 5.7 percentage points.
Conclusion
When observing the impact of the 2008/2009 economic downturn on the participation and employment rates of youth, full-time students, who make up the majority of the 15- to 24-year-old age group, appear to have been more negatively affected than non-students.
Between the academic years of 2007/2008 and 2016/2017 among full-time students, the participation and employment rates decreased more for younger students and male students compared with their older and female student counterparts. The decline in the rates for younger students happened as the share of people aged 55 years and over grew notably in the labour force over the period. For male students, the decline may be related to their under-representation in the type of jobs that are often held by youth. The participation and employment rates of students decreased in about half of the provinces, with Newfoundland and Labrador being the sole province to register an increase.
A recent study comparing the labour market situation of students in Canada and the United States suggests that cyclical factors may have played a larger role in the post-recession downward trend in the labour force participation of full-time students in Canada compared to the U.S.Note 5 This suggests that an increase in the participation rate of full-time students in Canada may still occur should labour market conditions continue to remain strong.
Start of text box
Data sources, concepts, definitions and methods
- This article uses data from the Labour Force Survey (LFS). The LFS is a monthly survey that collects demographic and labour market information for household members aged 15 and over.
- Youth: All individuals aged 15 to 24.
- Full-time students: Those aged 15 to 24 enrolled full-time at an educational institution between September and April. The student population in this article refers to full-time students.
- Younger students: Full-time students aged 15 to 17 (typical high school ages).
- Older students: Full-time students aged 18 to 24 (typical post-secondary student ages).
- Non-students: Individuals aged 15 to 24 not enrolled in educational institutions.
- School year estimates are eight-month moving averages (September to April).
- 2007/2008 school year: The school year before the economic downturn of 2008/2009.
- 2016/2017 school year: The most recent school year for which data were available at the time of writing this analysis.
- Participation rate: The number of employed and unemployed as a percentage of the population.
- Employment rate: The number of employed as a percentage of the population.
- Changes in estimates were conducted using 95% confidence intervals.
Note: While this article was in production, the 2017/2018 data for student employment during the school year were released. Key findings show the participation rate and employment rate for full-time students age 15 to 24 that year to be 42.9% and 38.1%, respectively; little changed from the 2016/2017 rates.
End of text box
Data tables
| 2007/2008 | 2016/2017 | 2007/2008 to 2016/2017 | |
|---|---|---|---|
| % | percentage point change | ||
| Both sexes | |||
| 15 to 24 years | 46.8 | 42.9 | -3.9Table 1 Note 1 |
| 15 to 17 years | 42.2 | 35.1 | -7.1Table 1 Note 1 |
| 18 to 24 years | 51.1 | 48.8 | -2.3Table 1 Note 1 |
| Men | |||
| 15 to 24 years | 42.7 | 38.9 | -3.8Table 1 Note 1 |
| Women | |||
| 15 to 24 years | 50.7 | 46.8 | -3.9Table 1 Note 1 |
|
|||
| 2007/2008 | 2016/2017 | 2007/2008 to 2016/2017 | |
|---|---|---|---|
| % | percentage point change | ||
| Both sexes | |||
| 15 to 24 years | 87.5 | 87.4 | -0.1 |
| 15 to 17 years | 65.8 | 60.6 | -5.2 |
| 18 to 24 years | 88.6 | 88.3 | -0.3 |
| Men | |||
| 15 to 24 years | 90.9 | 89.4 | -1.5Table 2 Note 1 |
| Women | |||
| 15 to 24 years | 83.5 | 84.8 | 1.3 |
|
|||
| 2007/2008 | 2016/2017 | 2007/2008 to 2016/2017 | |
|---|---|---|---|
| % | percentage point change | ||
| Both sexes | |||
| 15 to 24 years | 41.4 | 37.4 | -4.0Table 3 Note 1 |
| 15 to 17 years | 35.1 | 28.3 | -6.8Table 3 Note 1 |
| 18 to 24 years | 47.3 | 44.3 | -3.0Table 3 Note 1 |
| Men | |||
| 15 to 24 years | 36.9 | 32.8 | -4.1Table 3 Note 1 |
| Women | |||
| 15 to 24 years | 45.7 | 41.8 | -3.9Table 3 Note 1 |
|
|||
| 2007/2008 | 2016/2017 | 2007/2008 to 2016/2017 | |
|---|---|---|---|
| % | percentage point change | ||
| Both sexes | |||
| 15 to 24 years | 77.9 | 76.7 | -1.2 |
| 15 to 17 years | 51.0 | 47.6 | -3.4 |
| 18 to 24 years | 79.3 | 77.7 | -1.6Table 4 Note 1 |
| Men | |||
| 15 to 24 years | 79.8 | 77.4 | -2.4Table 4 Note 1 |
| Women | |||
| 15 to 24 years | 75.7 | 75.7 | 0.0 |
|
|||
| 2007/2008 | 2016/2017 | |||
|---|---|---|---|---|
| number | proportion | number | proportion | |
| thousands | % | thousands | % | |
| Cashiers | 140.4 | 100.0 | 132.9 | 100.0 |
| Men | 24.8 | 17.7 | 30.9 | 23.3 |
| Women | 115.6 | 82.3 | 102.0 | 76.7 |
| Retail salespersons | 143.2 | 100.0 | 131.8 | 100.0 |
| Men | 51.1 | 35.7 | 45.6 | 34.6 |
| Women | 92.1 | 64.3 | 86.2 | 65.4 |
| Food counter attendants, kitchen helpers and related support occupations | 126.4 | 100.0 | 131.4 | 100.0 |
| Men | 55.0 | 43.5 | 63.3 | 48.2 |
| Women | 71.4 | 56.5 | 68.1 | 51.8 |
| Store shelf stockers, clerks and order fillers | 60.9 | 100.0 | 50.2 | 100.0 |
| Men | 49.3 | 81.0 | 42.6 | 84.9 |
| Women | 11.6 | 19.0 | 7.6 | 15.1 |
| Program leaders and instructors in recreation, sport and fitness | 33.4 | 100.0 | 49.0 | 100.0 |
| Men | 13.2 | 39.5 | 19.9 | 40.6 |
| Women | 20.2 | 60.5 | 29.2 | 59.6 |
| Food and beverage servers | 55.1 | 100.0 | 49.0 | 100.0 |
| Men | 11.3 | 20.5 | 8.9 | 18.2 |
| Women | 43.7 | 79.3 | 40.0 | 81.6 |
Source: Labour Force Survey, custom tabulations. |
||||
References
Amirault, D. and N. Rai. 2016. "Canadian Labour Market Dispersion: Mind the (Shrinking) Gap." Bank of Canada Staff Analytical Note. No. 2016-3.
Bailey, T. R. 1995. Learning to Work: Employer Involvement in School-to-Work Transition Programs. Washington D.C.: The Brookings Institute.
Bishop, J. H. 1996. "Signaling the Competencies of High School Students to Employers." Linking School and Work: Roles for Standards and Assessment. Published under the direction of L. B. Resnick and J. G. Wirt. San Francisco: Jossey-Bass Publishers.
Cheung, C., D. Granovsky and G. Velasco. 2015. "Changing Labour Market Participation Since the Great Recession: A Regional Perspective." Bank of Canada Staff Discussion Papers. No. 2015-2.
Houshmand, M., M.-D. Seidel and D. G. Ma. 2014. "Beneficial 'Child Labor': The Impact of Adolescent Work on Future Professional Outcomes." Research in the Sociology of Work. Vol. 25 (191-220).
Ketcheson, J., N. Kyui and B. Vincent. 2017. "Labour Force Participation: A Comparison of the United States and Canada." Bank of Canada Staff Analytical Notes. No. 2017-9.
LaRochelle-Côté, S., and J. Gilmore. 2009, December. "Canada's Employment Downturn." Perspectives on Labour and Income. 10(12), 5-12.
Morisi, T. L. 2017. "Teen Labor Force Participation Before and After the Great Recession and Beyond." Monthly Labor Review. February 2017.
Moyser, M. 2017. "Women and Paid Work." Women in Canada: A Gender-based Statistical Report (89-503-X).
Poloz, S. S. 2018. "Today's Labour Market and the Future of Work." Remarks given by the Governor of the Bank of Canada at Queen's University. March 13, 2018.
Sinha, M. 2015. "Volunteering in Canada, 2004-2013." Spotlight on Canadians: Results from the General Social Survey (89-652-X).
Usalcas, J. and G. Bowlby. 2006. "Students in the Labour Market." Education Matters (81-004-XIE).
Notes
- Date modified: