Saving for postsecondary education
Sophie Lefebvre
In today's labour market, two out of three jobs require more than a high school education. In general, postsecondary graduates have a higher employment rate, are less vulnerable in the face of economic downturns, and enjoy higher earnings. Canadian families seem to understand the benefits of a postsecondary education: One study showed that parents of 95% of children under 19 believed that education beyond high school is important (Shipley, Ouellette and Cartwright 2003).
At the same time that postsecondary education has become a determinant of labour market success, its cost has increased dramatically. Average annual undergraduate university tuition fees have almost doubled, from $2,023 in 1993-94 to $4,025 in 2003-04 (Statistics Canada 2003). The increase in tuition fees and other education costs may be partly responsible for the increase in student debt. The average amount owed to student loan programs by university graduates increased 76% between 1990 and 2000 (Allen and Vaillancourt 2004). The Postsecondary Participation Survey found that one-third of students who left before graduating in 2002 did so for financial reasons (Barr-Telford et al. 2003).
Parents and the federal government apparently believe that saving for children's education will help ensure wider educational opportunities, successful completion of postsecondary education, and a minimal debt burden after graduation. Indeed, parents of more than 9 in 10 children agreed it was important to start saving early. The Survey of Approaches to Educational Planning showed that more children had savings put aside for their postsecondary education in 2002 than in 1999 (50% compared with 41%) (Shipley, Ouellette and Cartwright 2003).
The federal government encourages greater savings for postsecondary education expenses through the Canada Education Savings Grant (CESG), introduced in 1998. This grant is paid to a child's plan when parents (or others) invest in a registered education savings plan (RESP) (see RESPs and CESGs). Since the inception of the CESG, the use of RESPs by families saving for postsecondary education has increased. In 2002, more than half of children with savings had RESPs compared with 40% in 1999 (Shipley, Ouellette and Cartwright 2003).
This study uses the 2002 Survey of Approaches to Educational Planning to describe factors linked to the decision of parents to save for the postsecondary education of their children under 19 in 2002; the amount saved is also linked to these factors. A model was used to estimate cumulative parental savings (non-conditional on the decision to save), taking into consideration characteristics of the family and the child, aspirations and involvement of parents, awareness of saving incentive programs, and grant expectations.
Family and child characteristics
Saving for postsecondary education is influenced by many factors, including the family's financial circumstances and the child's age and performance at school.
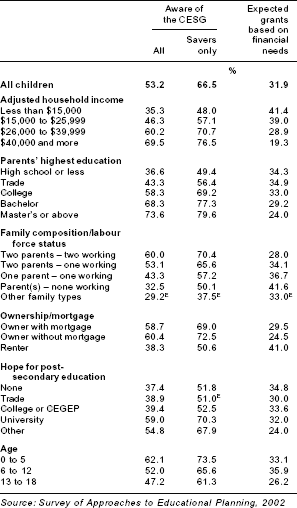
Over two-thirds of children from the highest income families had savings put aside for their postsecondary education compared with less than 30% of children from the lowest income group. Also, the amounts invested for children in the highest income families were twice those of the lowest income families (Table 1).
Savings are based on both present and past finances, so a family's wealth is an important factor. One indicator of wealth is homeownership.6 Children whose parents owned the family home outright were more likely to have had money put aside for their education than children living in rental housing. In addition, the average amount saved by mortgage-free parents was almost three times greater than the amount saved by parents living in rental housing.
The average saved increased with the age of the child, the amount for children 13 to 18 being almost three times higher than that for those under 6. Obviously, parents of older children would have had more time to start saving, so the incidence of saving and the amounts saved, conditional on saving, could be expected to increase with age. In fact, the age groups showed no significant differences in the likelihood of having saved.
As a child progresses through school, academic ability, measured by performance at school, may indicate to parents whether the child is a likely candidate for postsecondary education. Parents whose children perform well at school may be more inclined to save. Indeed, 55% of children with A averages had savings, compared with 42% of those with C averages, and only 28% of those with below C.
Another influencing factor is the saving for the child's education by others—grandparents, other relatives or friends. However, in reality few do so; in 2002, only 14% of children had saving plans established by persons other than parents. Those with such plans were also more likely to have savings from parents (59% versus 49%). Average amounts saved by parents did not seem to be significantly affected by the presence of other savings plans.
Parental aspirations and involvement
Parental aspirations are known to be related to the likelihood of a child's participating in postsecondary education. In 2002, two-thirds of children were expected by their parents to get a university education (Shipley, Ouellette and Cartwright 2003). The saving behaviour of parents clearly demonstrates that they plan financially based on their aspirations (Table 2). In fact, the higher the postsecondary credential they hoped the child would obtain, the more likely they were to save, and the greater the amount saved.7
The hours parents spend with their child, and the frequency with which they talk about school or read aloud, can be indicators of involvement in their child's education. Saving for education can be considered another (Hossler and Vesper 1993). One might expect that parents who are more actively involved are more likely not only to save but to save more. The incidence of educational savings was higher for children whose parents spent more time with them and who interacted regularly about education (See Data source and definitions); however, the average savings amount did not differ significantly. Children who regularly participated in activities outside school were also more likely than those who did not to have savings (54% compared with 37%)—but again, the average amounts were similar.
Household savings—for example, RRSPs—are known to be sensitive to changes in tax laws and in the labour market. It is therefore reasonable to assume that educational savings would be influenced by the introduction of savings incentive programs such as the CESG in 1998. Awareness of such a program could prompt parents to begin saving or add to existing savings (see Program awareness). Indeed, those who were aware of the CESG were more likely to save than those who were not (63% compared with 36%). The average amount saved was also greater.
Some parents anticipate that their child will receive financial help once enrolled in postsecondary education. About one-third of children had parents who expected them to receive grants based on financial need. Such expectations may lead parents to save less or not to save at all. Six in 10 children whose parents did not expect them to receive any grants had savings, compared with 4 in 10 children whose parents expected grants. Among children with savings, the average amount saved for them by parents not expecting grants was $10,100—substantially more than the $6,900 saved for children whose parents expected grants.
Factors that influence education saving
Parents set aside educational savings to insure that their children will have enough money to cover some or all of their postsecondary education costs. As shown, factors such as household income, homeownership, and age and academic ability of the child seem to be related to the incidence of saving and the amount saved (conditional on saving). The aspirations of parents also seem to be related. However, the factors are closely interrelated. To understand the relative contribution of a given factor in the amounts saved, a censored regression model was used (see Tobit model).
Financial means
Not surprisingly, a higher level of income meant more savings for a child's postsecondary education. Children from a family with an adjusted income of $40,000 or more had, on average, about $3,000 more in savings than children in a family with an adjusted income of less than $15,000 (Table 1). Controlling for factors such as other family characteristics, child's characteristics, parental aspirations, and program awareness greatly reduced the difference between the savings of the lowest income group and the highest income group. Initially, the former had an average of $1,600 in savings and the latter had $7,700. Controls reduced this difference by half to $2,900.
Children who lived in a mortgage-free home were most likely to have greater savings—$8,100 on average. Even after controlling for income and other factors, they had significantly more savings than children living in a mortgaged home—a difference of $3,400. On the other hand, the difference between the latter and those living in rental housing, while still significant, was relatively smaller, at $700.9
Parental education
Children with at least one parent holding a university degree had significantly more savings accumulated than children with parents who had a high school diploma or less. Families in which at least one parent had a master's degree or above saved $2,000 more, on average, than families in which parents had a high school diploma or less. Since household income and educational aspirations were controlled for in the model, part of the explanation for the larger savings may be that parents with a university degree are more aware of the different expenses faced during postsecondary studies.
Province
Saving rates also differed by province. Children in all provinces except British Columbia had significantly lower savings than Ontario children. This is consistent with Ontario's undergraduate university tuition fees being the second highest in the country (Statistics Canada 2003). Parents likely expect their child to study in their own province and plan their savings accordingly. Similarly, children living in Quebec, the Atlantic provinces, and Manitoba had the lowest amounts saved; Quebec, Newfoundland and Labrador and Manitoba also had the lowest undergraduate tuition fees. In Quebec, fees were frozen in 2003-04 for the seventh straight year at $1,900 ($1,700 for residents), approximately a third of fees in Ontario ($4,900).
Siblings and other relatives
Children with at least one sibling had almost $1,000 more in accumulated savings than those without siblings. Since income was adjusted by household size, the presence of a sibling might reflect a higher propensity to invest since parents will have to assist more than one child.
Even after controlling for other factors, children with savings originating from someone outside their household had significantly more savings from their parents. These 'others' may be filling the gap between expected costs and parents' ability to save or finance their children's postsecondary education when the time comes.
School performance and expectations
Children who were A students had more accumulated savings than those who had lower marks (Table 2). Students with B or C grades had about $1,000 less than A students on average, and those with below C had about $2,000 less. Parents seem to save more as they realize their children are performing well in school and are likely to pursue higher education.
The saving behaviour of parents was also related to aspirations for their child. Children expected to get a university education had more savings than children expected to get a college or CEGEP diploma—$5,400 compared with $4,300. This may be partly because a college diploma is generally less expensive than a university degree.
Children living in households in which parents were interacting regularly with them about education had accumulated slightly more savings. School-aged children whose parents were more involved had $400 more of accumulated savings than children with less involved parents, even after controlling for factors such as parents' education and child's academic performance. Another factor associated with parents' involvement is the child's regular participation in extra-curricular activities. Children regularly involved in activities outside school had more savings than those not regularly involved, a difference of $900. However, the number of hours children spent with their parents did not seem to affect the amount saved.
CESG awareness
Children whose parents were aware of the CESG program had, on average, over $2,000 more in savings than children whose parents were not aware—$6,000 compared with $3,900.10 Since the participation rate in the RESP program was significantly lower for the lowest income families—13% compared with 42% for the highest income families (see RESPs and CESGs)—it might be assumed that the program had different effects on accumulated savings for families of different income classes. In fact, there was no difference by income class. For children in the lowest income families, awareness of the program amounted to $2,100 more being saved, compared with $2,300 in the highest income class (Chart).
Financial assistance
Parents who expected their child to receive grants for postsecondary education based on financial need saved significantly less ($1,200 less) for their child's education when all other factors were held constant. This has important implications since parents do not seem to have an accurate perception about the probability of receiving financial help. Parents of 29% of 13 to 18 year-olds expected their child to receive such grants, but only 15% of 18 to 24 year-olds enrolled in postsecondary institutions in 2002 (or earlier) actually received funds from outside the family (Shipley, Ouellete and Cartwright 2003). It would seem that savings will fall short of actual needs for large numbers of students hoping to pursue higher education.
Summary
Characteristics such as financial capacity and education of parents are related to saving for postsecondary education. Characteristics other than income explained about half of the difference in savings between the highest income group and the lowest income group. Homeownership was especially strongly linked. Carrying a mortgage can interfere with the capacity to save, even if the family income is relatively high. Parents who were aware of the Canada Education Savings Grant program saved significantly more, regardless of income. The expectation of grants based on financial need to help pay for postsecondary education was associated with lower accumulated savings.
Data source and definitions
The Survey of Approaches to Educational Planning was conducted in October 2002 by Statistics Canada in partnership with Human Resources Development Canada. The sample was representative of children 18 years or younger living in the 10 provinces. Approximately 10,800 households with children participated. Respondents were interviewed by telephone for one randomly selected child. The information was collected from the person most knowledgeable about the child—in most cases, a parent.
If savings had been set aside for the child's postsecondary education, questions were asked about the current value of the plan, including earnings and interest, also taking into account the Canada Education Savings Grant, if applicable. Any type of savings plan was considered: bank account, term deposit, saving bonds, RESP, or RRSP. The analysis considered only saving plans held by household members. Parents were asked to report the current value of savings specifically dedicated to the selected child.
Using cross-sectional data means that the characteristics of the child and the family were observed only for 2002, but the savings could have been accumulating for many years.
A small group of children were excluded from the original sample (1.6% of the weighted sample): those who were never expected to attend schooling (0.24%), those whose parents who did not state if they knew of the CESG program (1.34%), and a few whose cumulative savings were unreasonably high and distorted the results (0.03%).
Postsecondary education: any type of formal education after high school including college and university as well as apprenticeships, trade/vocational programs, general and vocational college, CEGEPs (in Quebec), and other programs.
Adjusted household income: total income from all sources during the last 12 months before taxes and deductions, adjusted by the square root of the household size.
Others saving besides parents: Parents were asked if anyone else was preparing or had a financial plan for the child's postsecondary education.
Child's academic performance: based on the respondent's knowledge of the child's school work and report cards; how well the child performed overall at school. A is 80% and up; B is 70%-79%; C is 60%-69%.
Hope for postsecondary education: Respondents were asked how far they hoped the child would go in school.
Interactions with child: Respondents were asked how much time they or their spouse usually spent interacting with the child.
Interactions about education: For children who had attended grade one, information was from the question on how many times the parent or spouse talked about school activities or things the child studied in class. For children who had not attended grade one, the information was derived from the question on how often the parent or other adult read aloud to the child.
Involved in activities: Respondents were asked about the child's participation in non-school organized activities, such as sports, social activities, or cultural activities. A child who participated at least once a week was classified as participating regularly.
Aware of CESG program: When the respondent was aware of the program that provides an additional 20% on RESP contributions, the child was classified as living in a household aware of the CESG.
Expect grant based on financial needs: Respondents were asked if they expected any part of the child's postsecondary education to be paid by grants or bursaries based on financial need. |
RESPs and CESGs
Any child can be a beneficiary of a registered education savings plan (RESP), which grows tax free until the child is ready for postsecondary education. Parents, grandparents, relatives or friends can all contribute to an RESP.1 The maximum contribution is $4,000 per year, with a lifetime limit of $42,000. An RESP can be a family, non-family, or group plan.2
An RESP allows the subscriber to apply for the Canada Education Savings Grant (CESG) on the beneficiary's behalf. Introduced in 1998, the goal of this program is to encourage saving for postsecondary education through RESPs. The federal government contributes 20% up to a maximum annual grant per beneficiary of $400, with a lifetime limit of $7,200. Grant room can be carried forward to future years.
Income from an RESP can be paid out once the beneficiary is enrolled as a full-time student in a qualifying program. These educational assistance payments (EAP) consist of earnings on RESP contributions, earnings on the grant, and the grant itself,3 and are included in computing the student's taxable income. If the beneficiary does not go on to postsecondary education immediately after high school, the RESP can continue to earn tax-sheltered income up to a maximum of 26 years. Should the beneficiary decide not to pursue postsecondary education, the contributor can name another beneficiary,4 transfer RESP and grant earnings into a personal or spousal registered retirement savings plan, or withdraw the RESP earnings in the form of accumulated income payments.5 For more information on CESGs and RESPs see www.hrsdc.gc.ca.
In 2002, 27% of all children under 19 had RESPs established by their parents, with a median value (including interest and CESG) of $4,000. Median amounts varied by age of the child, ranging from $2,000 to $6,000. Higher-income families were more likely not only to have RESPs but also to have greater RESP savings.
In 2001, 22% of children received approximately two billion dollars in RESP contributions from their parents. These contributions attracted an estimated 400 million dollars in CESGs. The median contribution was $1,000 with a $200 grant. Parents of children aged 13 to 18 were less likely to contribute to RESPs, but when they did, the investments were larger ($1,400 compared with $1,000 for younger children). Surprisingly, higher-income families did not invest enough to attract the maximum CESG. Only 41% of higher-income families contributing to RESPs in 2001 invested $2,000 or more. Nevertheless, 45% of older children received enough RESP contributions in 2001 to attract the $400 CESG (and up to $800 if enough grant room was available). RESPs and CESGs table |
Tobit model
A regression model is useful to understand the effect of one variable on an outcome when all other explanatory variables are held constant. But ordinary least square methods provide biased estimates when the dependent variable is truncated. In fact, the amount saved for postsecondary education is truncated since the value cannot be negative. If parents did not save, cumulative savings equal zero. Just under half of the children did not have savings and hence had a zero value for cumulative savings. In this case, a Tobit model can be used to estimate the relationship between the independent variables and the amounts saved for all children, including those with zero savings. The Tobit model takes into account that the dependent variable is truncated and constrained to be non-negative. The results in Tables 1 and 2 and the chart are the expected value of savings calculated from the estimated coefficients using a Tobit model and the mean values of the variables. |
Program awareness
Given that awareness of the CESG program was found to be associated with increased savings, it seems reasonable to conclude that making more parents aware of the program might increase savings. Parents aware of the CESG program in 2002 were from higher-income families, were more educated, lived in owned housing, and had high aspirations for their child's education. Parents of children (under 6) were also more likely to be aware of the incentive program.8 Parents who were saving and aware of the CESG also had higher income, were more educated, were more likely to own their residence, and had higher educational aspirations than parents who were saving but unaware of the CESG.
Parents who expected their child to receive grants based on financial need also had significantly less savings. Although families who were more likely to expect grants had lower income and lived in rental housing, a surprising 19% of children in the highest income families were expected to receive such grants. It seems improbable that all these children will receive financial help, so perhaps parents need to be better informed about the details of such programs. Program awareness table. |
Notes
- Depending on the type of plan, spouses and common-law partners can be joint subscribers. The subscriber must be a person, not a corporation, trust or other organization.
- Family plans can have more than one beneficiary. However, each beneficiary must be related by blood or adoption to the subscriber and be under 21 when named. Contributions can be made only until a beneficiary turns 21. A non-family plan can have only one beneficiary. The beneficiary does not have to be related to the subscriber, and can be over 21 when named. A group plan is operated on a pooling principle, and if the beneficiary fails to qualify for payment, the earnings are distributed to other beneficiaries who do qualify.
- A portion of each EAP is considered to be attributable to CESG paid into the plan. This portion is based on the ratio of grant to total investment earnings in the plan, and reduces the remaining balance in the plan's CESG account.
- However, in order to keep the CESG, the new beneficiary must be under 21 and either a brother or sister of the former beneficiary, or both the new and old beneficiaries must be under 21 and related to the subscriber.
- Accumulated income payments are made to the subscriber out of an RESP's investment earnings (contributions are refunded as a lump sum). Payments can be made only if the plan has been in existence for 10 years, all beneficiaries past and present have reached age 21, no beneficiary is attending school, and the subscriber is a resident of Canada. Payments are taxable income for the subscriber and subject to an additional 20% tax (varies by province) unless transferred to an RRSP (contribution refunds are not taxable). The grant portion is returned to the Government of Canada.
- In 1999, 75% of families with positive financial wealth owned their residence compared with only 44% of families with no financial wealth (Morissette 2002).
- Except for trade, which represents a very small group of children.
- A logistic regression model was run, and for those variables, the coefficients of the categories were significantly different from the reference group.
- It could be argued that paying off a mortgage and building home equity is another way to save for postsecondary education, but it is difficult to verify this hypothesis. If true, this could explain in part why households with a mortgage had lower savings.
- An OLS regression model was estimated on savers only to determine if savers who knew about the CESG had more cumulative savings than savers who did not know about it. The coefficient of being aware of CESG was not significant, suggesting that being aware of this program increases the likelihood of taking the decision to save only and not the amounts saved.
References
- Allen Mary and Chantal Vaillancourt. 2004. Class of 2000: Profile of postsecondary graduates and student debt. Education, Skills and Learning Research Paper Series no. 16. Catalogue no. 81-595-MIE2004016. Ottawa: Statistics Canada.
- Barr-Telford, Lynn, Fernando Cartwright, Sandrine Prasil and Kristina Shimmons. 2003. Access, persistence and financing: First results from the Postsecondary Participation Survey. Education, Skills and Learning Research Paper Series no. 7. Catalogue no. 81-595-MIE2003007. Ottawa: Statistics Canada.
- Hossler, Don and Nick Vesper. 1993. "An exploratory study of the factors associated with parental saving for postsecondary education." Journal of Higher Education 64, no. 2 (March-April): 140-165.
- Morissette, René. 2002. "Families on the financial edge." Perspectives on Labour and Income (Statistics Canada, Catalogue 75-001-XIE) 3, no. 7. July 2002 online edition.
- Shipley, Lisa, Sylvie Ouellette and Fernando Cartwright. 2003. Planning and preparation: First results from the Survey of Approaches to Educational Planning 2002. Education, Skills and Learning Research Paper Series no. 10. Catalogue no. 81-595-MIE2003010. Ottawa: Statistics Canada.
- Statistics Canada. 2003. "University tuition fees, 2003-04." The Daily, August 12, 2003.
Full article in PDF
Author
Sophie Lefebvre is with the Income Statistics Division. She can be reached at (613) 951-5870 or perspectives@statcan.gc.ca.
You need to use the free Adobe Reader to view PDF documents. To view (open) these files, simply click on the link. To download (save) them, right-click on the link. Note that if you are using Internet Explorer or AOL, PDF documents sometimes do not open properly. See Troubleshooting PDFs. PDF documents may not be accessible by some devices. For more information, visit the Adobe website or contact us for assistance.
|


