 |
|
 |                |
Archived ContentInformation identified as archived is provided for reference, research or recordkeeping purposes. It is not subject to the Government of Canada Web Standards and has not been altered or updated since it was archived. Please contact us to request a format other than those available. |

| January 2006 |
||||||
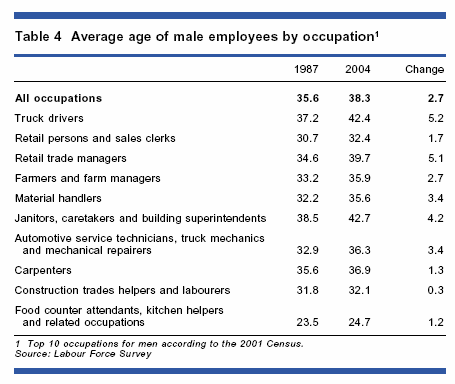
On the road again Vincent Dubé and Denis Pilon Trucking plays a major role in Canada's economy. More than 53% of exports to the United States and 78% of all imports were shipped by truck in 2004. But, because of the sector's steady growth, an aging workforce, and the declining popularity of the occupation, the industry may soon face a shortage of qualified truckers. According to one study, 37,000 new drivers will be needed annually in the coming years (CTHRC 2003). The challenge of recruiting and retaining qualified truckers is also exacerbated by provincial minimum-age regulations and insurance premiums for drivers under age 25. This article presents a recent overall picture of truck drivers based on various sources (see Data sources and limitations). Three major facets of the occupation are examined: employment, socio-economic characteristics, and labour market characteristics. Structural changes in the job marketAccording to the Labour Force Survey (LFS), there were approximately 271,000 truckers in Canada in 2004, up 28% from 1987—slightly less than the 29% increase registered for overall employment (Table 1).1 Nearly two-thirds of truckers worked for an employer whose principal activity was directly associated with transportation and warehousing.2 This group of workers closely corresponds to the segment of trucking defined as 'for-hire' (see The trucking industry), since 95% of them (166,000) work in the truck transportation subsector.5 After transportation and warehousing, the main employers were manufacturing, wholesale trade and retail trade. Truckers working for employers whose principal activity is not transportation, but who own vehicles primarily intended to transport their own goods, are included in the segment called private trucking. While truckers were evenly distributed between the two segments in 1987, the for-hire segment accounted for almost the entire increase subsequently. This appears to be a result of increased outsourcing (Chart A). Wage earners predominateNearly 80% of all truck drivers in 2004 were wage earners. These drivers work for a company and are assigned a truck for a given period. Depending on its size, the company may own a fleet of anywhere from two to more than a hundred trucks (Table 2). Self-employed truckers, on the other hand, have their own equipment (either owned or leased) and are responsible for their own arrangements. They may also have employees to assist them: some 7% had paid help in 2004. Approximately 94% of self-employed truckers were classified as being in for-hire trucking. Since 1987, the number of self-employed truckers has generally grown slowly. On the other hand, the number of wage-earning truckers has tended more to fluctuate, declining by 13,000 between 2002 and 2004 (Charts B and C). A typically male occupationDespite campaigns to promote non-traditional jobs, women still occupy a marginal place within the occupation. According to the 2004 LFS, 97% of truckers were men. While different factors have contributed to this situation, the number of hours spent outside the home may be a major drawback for women wishing to start a family6 (Table 3). An aging populationTruck drivers constitute a relatively older workforce, with an average age of 42 for wage-earning truckers and 45 for their self-employed counterparts in 2004. Also, a larger proportion were 55 or older: 18%, compared with 13% for workers in general. Among the 10 most popular of over 500 occupations classified for men, truck driving ranked second behind janitors, caretakers and building superintendents. Trucking has also seen the largest increase in average age since 1987 (Table 4). The ratio of entrants (men under 25) to those who will retire over the next 10 years (men 55 and over) underlines the greying of the occupation (Chart D). While the downward slope of the curve is not a positive outcome, the presence of ratios below unity is especially troubling, since it means that more will be leaving than entering the industry (negative flows). For example, the ratio of 0.5 in 2001 indicates that there were twice as many male truckers aged 55 and over as underÿ25. To better assess the phenomenon of aging, a second ratio was calculated using those under 30 as the entrant group. Despite a certain lag, essentially the same trend was observed. The year 2004 marked the first time truckers 55 and over outnumbered those under 30. Unless the situation turns around (as a result of increased immigration, for example; see Growing proportion of immigrants among truckers), the occupation may be hit by a large number of retirements in the coming years. However, truckers may be more likely to remain longer in the labour force. For example, trucking was the sixth most popular occupation among employed men aged 65 and over in 2001—4,255, up 82% from 1996 (Duchesne 2004). Also, a U.S. study found that the turnover rates for older or more experienced truckers tend to be lower, since a change of employment entails greater risks (Min and Lambert 2002). A survey of unemployed truck drivers points in a similar direction with the finding that younger drivers are more likely to resign than older ones (CTHRC 2003). Little new bloodJust as worrisome is the lack of young truck drivers. Only 5% of truckers were under 25 in 2004, compared with 15% in the labour force as a whole. Similarly, just over one-quarter of truckers were between 15 and 34, whereas the proportion in the labour force as a whole was 37%. From the standpoint of supply, this seems to indicate that today's young workers are less inclined than the previous generation to enter the occupation. Various reasons are cited—the demanding lifestyle, the poor perception of the occupation, and the appeal of competing occupations (particularly in construction). Only a study of young workers would provide definitive answers. As to demand for truckers, several factors come into play. First, the minimum age for obtaining a commercial vehicle driver's licence undoubtedly plays a role. In Canada, this ranges between 18 and 20 depending on the province, while in most U.S. states, the age is 21. In practice, the transport companies demand an even higher minimum age than that set by legislation. While this could be related to the high cost of insurance for young drivers (especially in international transport), it is more likely due to the importance given to practical driving experience. In a survey of fleet managers, experience was cited as the decisive factor in hiring a trucker (CTHRC 2003). Furthermore, the minimum experience required to drive a semi-trailer truck was three years. Low education levels do not necessarily reflect skillsOverall, truckers have a lower than average education level. Even though the qualification level for the occupation is high school completion, LFS figures show that more than one-third of truckers did not have a high school diploma in 2004, compared with only 14% of all workers. A major reason may be that many employers have not required any diploma or certificate other than the driver's licence corresponding to the type of truck used.7 Additionally, the larger proportion of older workers in the occupation could also have an impact, since previous generations are generally more likely to have less education. Also, the training given to truckers is not always reflected by education level (Nix 2003). Although some courses may lead to recognized accreditation, this is not always the case—in-house training by the employer for example. Many professional drivers appear to need training in order to better adapt to the current labour market (MacLeod 2002). However, the issue of training and skills is fairly complex. For example, more education may increase the likelihood of truckers finding a job outside the trucking sector (CTHRC 2003). English often used at workAccording to the 2001 Census, some 85% of Canadian truckers reported using English as a language of work. In Quebec, the proportion was 40%. Measures to make markets more open at the international level under NAFTA have likely also favoured English as a language of work in francophone settings. It is in fact essential that truckers crossing the border be able to function in English with U.S. customs officers. Few differences among the provincesOverall, the distribution of truckers within the provinces was similar to that of the labour force as a whole in 2004 (Table 3). However, British Columbia and Alberta had higher proportions of truckers in private trucking than in for-hire. Conversely, in Ontario, a much larger proportion were in for-hire trucking. Full-time, less unionized, and more in small workplacesAccording to the LFS, approximately 97% of wage-earning truckers worked full time in 2004. About one-quarter were unionized, less than the proportion for employees in general (32%). For-hire truckers had a unionization rate about one-third lower than those in private trucking. Furthermore, approximately 78% of wage-earning truckers were in workplaces with less than 100 employees, compared with two-thirds of wage earners overall (Table 5). An average wageThe average weekly wage of a wage-earning trucker working full time was $791 in 2004—approximately $41,100 per year. This was slightly more than the average for all employees ($778 per week or $40,500 per year). Unionized truckers earned about 11% more than their non-unionized counterparts. The average weekly wage was slightly higher in for-hire than in private trucking, likely because of differences in the work. For-hire truckers generally do more long-distance haulage; private truckers specialize more in local haulage. Also, long-distance truckers generally earn more, since they tend to work longer hours and make more compromises with respect to their personal and family life. Earning their payObviously, a relationship exists between hours worked and earnings. For example, drivers working 70 hours or more per week averaged more than $1,000 per week. But despite the often higher rate paid for overtime hours (especially in local freight haulage), the marginal gains of overtime generally fall off. Indeed, a recent American study showed that lower weekly wage rates for truckers are associated with higher probabilities of exceeding the maximum weekly hours allowed under rules governing hours of service (Monaco and Willmert 2003). Actual earnings of truckers stagnantThe average weekly earnings of truckers have hardly increased since 1998 (Chart E). In real terms, they rose 2% by 2004 for an average annual growth of approximately 0.3%, compared with 0.4% in all occupations. While the diversity of the trucking sector makes it difficult to generalize, the shortage of qualified truckers has so far not caused wages to rise. Even so, some sectors, such as long-distance haulage, may have registered strong wage increases. Seniority and education level have less impact on wagesSeniority appears to play a minor role in trucking, especially in the for-hire portion. While inexperienced workers face some barriers to entry, those who are hired reach a wage ceiling quickly. A comparison of the least experienced workers in for-hire trucking (aged 20 to 24) with the most experienced (55 and over) shows a wage difference of $100 per week. The comparable figure for wage earners in general was nearly $350. Hours worked by age group does not appear to be a major factor in the explanation since few differences are apparent in this regard. Little wage difference exists among male truckers according to education level. In 2004, the gap was less than $20 weekly between those who had not obtained a high school diploma, those who had, and those with postsecondary education. Little wage difference by category of workerAccording to the 2001 Census, no major differences were apparent between categories of workers (Table 6). Self-employed truckers nevertheless had a slightly higher annual income than wage earners. However, unlike their employed counterparts, the self-employed are not eligible for benefits, making them less likely to be covered by supplementary medical, dental or disability insurance plans. Without sickness benefits, they are more likely to incur larger financial losses if illness forces them to stop working (Akyeampong and Sussman 2003). Furthermore, since they are not eligible for an employer-sponsored pension plan, they must save more for retirement. Wage-earning truckers have fewer benefitsEmployer-sponsored benefits, such as insurance and retirement plans, are often taken as indicators of job quality (Marshall 2003). According to the 2002 Survey of Labour and Income Dynamics, a smaller proportion of wage-earning truckers received benefits than workers overall. This is especially so with respect to retirement plans: only 28% of truckers participated in a job-related pension plan, compared with 44% of all wage earners (Table 7). This is consistent with the finding that Quebec trucking companies have relatively low involvement in retirement plans: only about 25% of them offer such plans (Hébert 2005). On the other hand, roughly 50% provide various other insurance plans (such as medical care, prescription drugs, or life insurance). Fewer two-income families among truckersFewer truckers are in two-income families than workers in general. According to the 2002 Survey of Labour Income Dynamics, approximately 70% of spouses in husband-wife families in which a trucker was the major income recipient had gainful employment, compared with 82% for all workers. This could be because truckers are more likely to work longer hours to support their families (Bess 1999). It may also reflect the difficulty in reconciling the heavy demands of the occupation—especially time spent outside the home—with the demands on a two-income family. Always on the roadBecause of the rigours of the job, the highly competitive nature of the sector, and a pay structure that encourages truckers to work more hours to increase their earnings (see A different system of compensation), truckers generally put in a very long workweek. According to the LFS, wage-earning truckers averaged 47 hours per week in 2004, with 38% working 50 hours or more. For their part, self-employed truckers put in 49 hours per week, with 70% working 50 hours or more. One reason for the longer hours could be that self-employed truckers must spend more time on related activities (management tasks, mechanical maintenance, and so forth). Truckers in for-hire trucking had an even longer workweek. Wage-earners averaged 50 hours, but 47% put in 50 hours or more. Self-employed truckers averaged 55 hours, with 71% clocking 50 hours or more. This difference arises mainly because truckers working for companies that specialize in hauling freight (for-hire trucking) would be more likely to cover long distances (see Table 5). And, these figures may generally underestimate the actual hours worked by long-distance truckers (Bess 1999; Nix 2003). Since they represent hours usually paid or contracted, they may reflect the official hours entered in logbooks, which often exclude much of the time spent not driving but nevertheless worked. Waiting periods, mechanical checks, and customs inspections are typical examples of activities often entered as rest periods. This practice enables truckers, most of whom are paid on the basis of distance travelled, to keep their hours of service for driving and thus maximize their earnings (Nix 2003). Truckers have more irregular schedulesAccording to the Workplace and Employee Survey, 42% of truckers worked flexible hours in 2001, meaning that start and stop times could vary. The proportion was higher in for-hire trucking—approximately 45%.9 This type of schedule was more common among truckers than in the technical and trades occupational group (32%) or all occupations combined (34%). Also, more than a third (34%) of truckers did not work the same number of paid hours each week, not counting overtime. This rate is more than double the 15% overall rate (see A relatively demanding occupation). Can truckers take comfort in comparisons?To obtain a broader picture, the working conditions of truckers were compared with other popular occupations for men, as well as those with the same skill level (high school completion or less). Weekly hours, hourly wages, and weekly wages were used as indicators of working conditions. Trucking ranked second in weekly hours, behind farmers but far ahead of other occupations. It also ranked second in weekly wages, behind retail trade managers. Truckers' wages were considerably higher than those with a high school diploma or less, but lower than wages for all occupations. Despite the high number of weekly hours, the hourly earnings of truckers fell in the middle of the range. Hourly rates were also fairly similar to those in occupations with the same skill level. However, they remained below hourly earnings for male full-time workers as a group (Table 8). SummaryNearly 271,000 persons worked as truckers in 2004. Four in five were employees, while the others were self-employed (owner-operators). Just over 60% of all truckers worked directly for a company whose principal activity was truck transport of freight. Overall, truckers are almost exclusively men and tend to be older and less educated than the average. Also, their ranks contain a smaller percentage of immigrants than overall. Truckers earn a wage close to the average for all occupations, but they receive fewer benefits, especially with respect to a pension plan. By the same token, they work many more hours than the average for all occupations, often according to irregular schedules.
Notes
References
Full article in PDF Author
You need to use the free Adobe Reader to view PDF documents. To view (open) these files, simply click on the link. To download (save) them, right-click on the link. Note that if you are using Internet Explorer or AOL, PDF documents sometimes do not open properly. See Troubleshooting PDFs. PDF documents may not be accessible by some devices. For more information, visit the Adobe website or contact us for assistance. |
|||||||