75-001-XIE

 |
August 2001 Vol. 2, no. 8 |
Time lost due to industrial disputes
Statistics on time lost due to industrial disputes (strikes and lockouts) have always attracted widespread attention. Such time losses have several ramifications: they tend to reduce overall economic output, as well as corporate and government revenues; they tend to reduce the earnings, and hence spending power, of workers directly or even indirectly involved in the dispute; and they can also lead to social unrest.
With increasing economic globalization and trade liberalization (for example, the North American Free Trade Agreement), interest in this type of information has lately assumed an added dimension, since international differences may now play a role in corporate decisions on plant or office location (see International work-stoppage statistics).
To offer some historical perspective on industrial strife in Canada, this study combines Statistics Canada data with information compiled by Human Resources Development Canada (HRDC, 2001) on workdays lost due to strikes and lockouts over the past two decades.
Days lost have trended down over the past two decades
Analysis of year-over-year changes and trends in labour-dispute statistics is not straightforward. The annual data are affected by the collective bargaining timetables (in particular, the number and length of collective agreements), the size of the unions involved, the duration of the stoppages, the state of the economy, as well as any changes in industrial relations legislation.
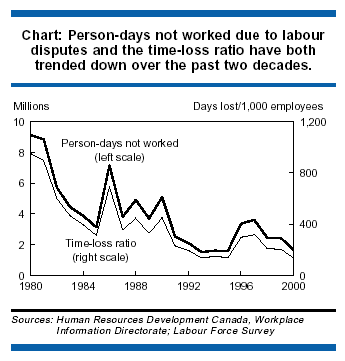
Nevertheless, the available data for the past 20 years do reveal overall downward trends in both the number of industrial disputes and the resulting days lost (Chart). The average annual number of work stoppages in Canada due to strikes and lockouts in the 1980s was almost double that of the 1990s (754 versus 394). The resulting workdays lost averaged 5.5 million annually in the 1980s, more than double the 2.6 million of the 1990s (Table). Using a time-loss ratio (the number of workdays lost due to strikes and lockouts per 1,000 employees) enables a meaningful comparison of the industrial dispute statistics. The annual average ratio fell from 547 in the 1980s to 233 in the 1990s.
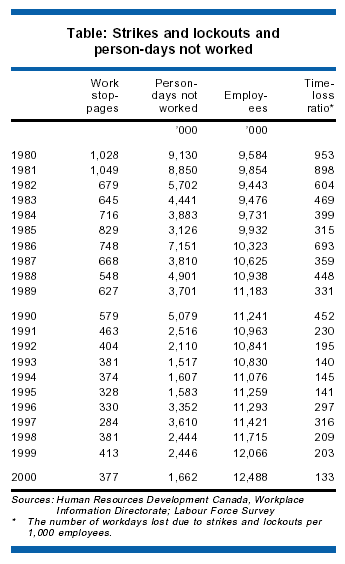
A comparison of the 2000 data with those of 1980 reveals an even more dramatic decline. In 1980, work stoppages due to strikes and lockouts totalled 1,028; in the year 2000, the corresponding number was just 377. Similarly in 1980, the resulting person-days not worked amounted to 9.1 million; in 2000 they totalled 1.7 million. The time-loss ratio in 1980 was estimated to be 953; in the year 2000, the corresponding figure was 133, only one-seventh the 1980 level.
Workdays lost to date in 2001 have changed little from 2000
The 90 strikes and lockouts during the first five months of 2001 were less than the 207 recorded during the same period in the preceding year. The 855,000 workdays lost from the stoppages during 2001, however, were slightly higher than the 827,000 of the year before, reflecting in part longer strike durations in 2001. Ten major strikes in Newfoundland, Quebec, Ontario, Alberta and British Columbia accounted for approximately 75% of total time lost during the first five months of 2001. ![]() 1 In spite of the slightly greater work time lost in 2001, the time-loss ratio remained unchanged at around 68 in both periods because of a higher employee count in 2001.
1 In spite of the slightly greater work time lost in 2001, the time-loss ratio remained unchanged at around 68 in both periods because of a higher employee count in 2001.
Summary
Canada's record on time lost due to industrial disputes has improved over the years. The average annual number of workdays lost per 1,000 employees (the time-loss ratio) fell from 547 in the 1980s to 233 in the 1990s. Moreover, the ratio of 133 recorded in 2000 was the lowest since 1980.
International work-stoppage statisticsBecause of differences in definitions and statistical coverage, international comparisons of labour dispute statistics must be made with caution. Many countries rely on voluntary notification of a dispute to a national or local government department. In Canada, the data reflect all work stoppages that come to the notice of Human Resources Development Canada's Workplace Information Directorate. Also, many countries, including Canada, do not measure work time lost at establishments whose employees are not involved in a dispute but are unable to work because of a shortage of materials supplied by establishments that are on strike. In addition, significant differences exist between countries on the threshold used to determine whether a particular stoppage should be entered in the official records. Most countries exclude small stoppages (judged by the number of workers involved, the length of the dispute, or the number of days lost) from the statistics. In particular, the threshold for inclusion is very high in the United States (1,000 workers), and so is the threshold of 100 workdays lost in Denmark. In Canada, the threshold for inclusion is 10 or more person-days lost. Some countries also exclude disputes in certain industrial sectors. For example, Portugal excludes public sector strikes. Several others exclude certain types of disputes: Portugal excludes general strikes from work-stoppage statistics, Japan excludes days lost in unofficial disputes, and the United Kingdom excludes so-called political work stoppages. No such exclusions exist in Canada. Finally, the inclusion or omission of workers indirectly involved in a stoppage, namely those who are unable to work because others at their workplace are on strike, varies between countries. The United States, together with many other countries such as the United Kingdom, France and Australia, attempts to include them. Canada, along with countries such as Germany and Italy, excludes them from the statistics. A complete description of these international coverage and definitional differences is contained in "A Technical note on coverage and methodology comparability of Labour Dispute Statistics" in the British journal, Labour Market Trends 109, no. 4. For the most recent data on unionization, see the Fact sheet available through "Key labour and income facts." |
Note
-
Major strikes January to May 2001:
Province Workers Workdays lost Newfoundland Hospital support staff 24,180 Provincial general service staff 16,900 Quebec La compagnie minière Québec-Cartier 37,990 Camco Inc. 17,330 Ontario Toronto District School Board 247,000 Falconbridge Ltd., Sudbury 43,710 McMaster University, Hamilton 42,900 Toronto Star 33,330 Alberta Calgary Transit 70,200 British Columbia Coast Mountain/TransLink 107,250
References
- Human Resources Development Canada. Workplace Gazette 4, no. 1 (Spring 2001): 40-44.
- United Kingdom National Statistics Office. "International comparisons of labour disputes in 1999," Labour Market Trends 109, no. 4: 195-201.
|
For the most recent data on unionization, see the Fact sheet available through Key labour and income facts. |
Author
Ernest B. Akyeampong is with the Labour and Household Surveys Analysis Division. He can be reached at (613) 951-4624 or ernest.akyeampong@statcan.gc.ca.
|
|
|
|
|
[ Highlights ] [ Main menu | Editor's corner | More news | Contact us | Survey information | Back issues ] [ Statistics Canada home page | In depth | Français ] |
|
© Statistics Canada - Conditions of use |