
Labour Statistics at a Glance
Reasons for working at 60 and beyond

Archived Content
Information identified as archived is provided for reference, research or recordkeeping purposes. It is not subject to the Government of Canada Web Standards and has not been altered or updated since it was archived. Please "contact us" to request a format other than those available.
by Myriam Hazel
Highlights
- Close to one-third of persons aged 60 and over worked or wanted to work in the previous year. Of these, more than 80% worked as the main activity, about 10% worked at some time during the period without it being the main activity, and less than 10% did not work but wanted to work.
- Half of older workers who worked or wanted to work in the previous year did so out of necessity, and the share was similar for men and women.
- Just less than 5% who reported being retired as their main activity worked at some time in the previous year.
Introduction
‘Freedom 55’ is becoming less and less a reality for Canadians as more and more Canadians are working past their 50s. Over the last two decades, this phenomena has translated into an increase in the average retirement age. According to the Labour Force Survey (LFS), workers in 2017 were retiring on average at 64 years, or almost three years later than in the late 1990s. Coinciding with an increase in retirement age, the last 20 years have witnessed a near doubling of the labour force participation rate for those aged 60 years and over, from 14% in 1997 to 26% in 2017. A similar upward trend in the labour force participation among the older population has also been observed in the United States.
Several factors may have contributed to an increase in labour market participation among older people. These include higher life expectancy and more years of good health, less physically-demanding jobs, increased educational attainment (particularly of the baby-boom generation whose youngest cohort members are now in their 50s), delayed early life transitions having an impact later in life, and changes in older people’s financial situation. In particular, the 2008/2009 recession and the related global financial crisis combined with the decline in pension coverage and the shift from defined-benefit to defined-contribution pension plans in the 1990s and 2000s may have made it harder for a portion of this population to accumulate sufficient savings and wealth for retirement (Drolet and Morissette, 2014; Gougeon, 2009).
Using LFS data collected in September 2018, during which several questions were added on a one-time basis on the main activity of Canadians in the previous 12 months, this analysis provides new information on the labour force participation of older Canadians (defined in this analysis as persons aged 60 years and older) and sheds light on the reasons why they were working.
Most people aged 60 and over who worked in the previous year reported that this was their main activity
About 2.7 million people aged 60 and over, representing almost one-third of the population aged 60 and over, reported working or wanting to work in the previous 12 months. Conversely, more than two-thirds of older Canadians said they did not work and did not want to work (including those who did not work due to a long term illness). In line with the fact that men of the baby-boom generation had higher labour force participation rates than women over the course of their core working years, older men (36.6%) were more likely to work or to want to work than older women (26.1%). Men (30.5%) were also more likely than women (20.8%) to indicate that working was their main activity, particularly for married men or those living in a common-law relationship.Note
Among those who worked or wanted to work during this period, 81.8% indicated that working was their main activity, while 11.6% reported working only at some time during the 12-month period. The remaining 6.6% said they did not work but wanted to.
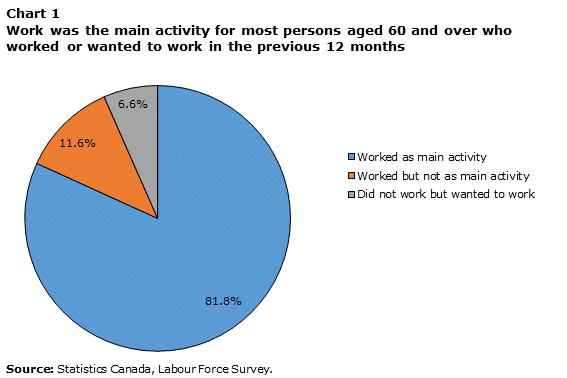
Data table for Chart 1
| Percent | |
|---|---|
| Worked as main activity | 81.8 |
| Worked but not as main activity | 11.6 |
| Did not work but wanted to work | 6.6 |
| Source: Statistics Canada, Labour Force Survey. | |
Partly reflecting increased health issues as people traverse their senior years, the proportion of those who reported that working was their main activity in the previous 12 months declined with age. Fifty-five percent of those aged 60 to 64 reported working as their main activity. This fell to just 7.0% for those aged 70 years and over.
Fewer than 5% of those aged 60 and over who described themselves as ‘retired’ worked at some time during the year
Being retired was the main activity for close to 9 in 10 (86.3%) persons aged 60 and over who said they were doing something other than working as the main activity in the previous year. Of these 5.5 million retired persons, relatively few (4.4%) engaged in paid work at some time over this period.
People aged 60 and over whose main activity was going to school or looking for work (34.8%) had a larger proportion of people who worked at some time during the previous 12 months (without it being their main activity), although the size of this group was relatively small (55,000).
Working out of necessity is a reality for about half of older workers
Different reasons can lead people to continue working past their 50’s. Older people may work mainly because they need the money. Others work mainly because they like what they do, they want to stay busy or even because they like socializing with their co-workers. The LFS explored the reasons why Canadians continued working at a later age by asking whether they were working or wanted to work mainly by choice or by necessity.
‘Working by necessity’ included paying for essential expenses (such as bills, mortgages, and food), not being eligible yet for pension or supporting family members. ‘Working by choice’ included paying for desirable items (such as holidays or leisure), liking to work, staying engaged or not being ready to stop working.Note
The reasons among those aged 60 and over were almost evenly split, with 49.0% working or wanting to work mainly out of necessity and 51.0% doing so out of choice.

Data table for Chart 2
| By choice | By necessity | |
|---|---|---|
| percent | ||
| 60 years and over | 51.0 | 49.0 |
| 60 to 64 years | 40.7 | 59.3 |
| 65 to 69 years | 59.7 | 40.3 |
| 70 years and over | 71.6 | 28.4 |
| Source: Statistics Canada, Labour Force Survey. | ||
Needing to work and wanting to work changes however with age. In their early 60s, the majority (59.3%) of people who worked or wanted to work did so by necessity. This fell to 40.3% for those in their late 60s. However, even for individuals aged 70 and over, necessity was cited by more than one-quarter (28.4%) of those who worked or wanted to work. The decrease in the proportion of people working or wanting to work by necessity as people age may partly reflect access to public pension plans, which normally comes into effect at age 65, as well as registered pension plans and registered retirement savings plans.
Although proportionally more men than women worked or wanted to work at an older age, the incidence of working or wanting to work by necessity was similar between older men (48.8%) and older women (49.3%).
The proportion of those working or wanting to work by necessity varied slightly by province, ranging between 44.6% in Saskatchewan and 53.0% in Prince Edward Island. In general, the incidence of working out of necessity among older Canadians living in the largest census metropolitan areas, including Toronto (53.4%) and Vancouver (49.4%), was similar to that of those living in areas outside the CMAs and the census agglomerations (48.2%).
Overall, people aged 60 and over who worked or wanted to work were slightly more educated than those of the same age who did not work and did not want to work. Around 26% of older persons who worked or wanted to work had a bachelor’s degree or higher compared with about 18% for those who did not work and did not want to work. These results are in line with previous studies (Statistics Canada, 2017; Carrière and Galarneau, 2012) that observed a positive relation between education and labour force attachment.
The highly-educated were also more likely to work by choice past their 50s than their counterparts with a lower level of education. Around 55% of older persons with a high school diploma or less who worked as their main activity did so by necessity, compared with about 44% among older persons with a bachelor’s degree or higher. Looking at older persons who worked at some time in the previous year without it being their main activity, the likelihood of working by necessity was also higher for those with a high school diploma or less. Individuals with higher levels of education tend to have greater wealth, in the forms of higher home values, greater access and contributions to employer-sponsored pension plans and private savings (Messacar, 2017).
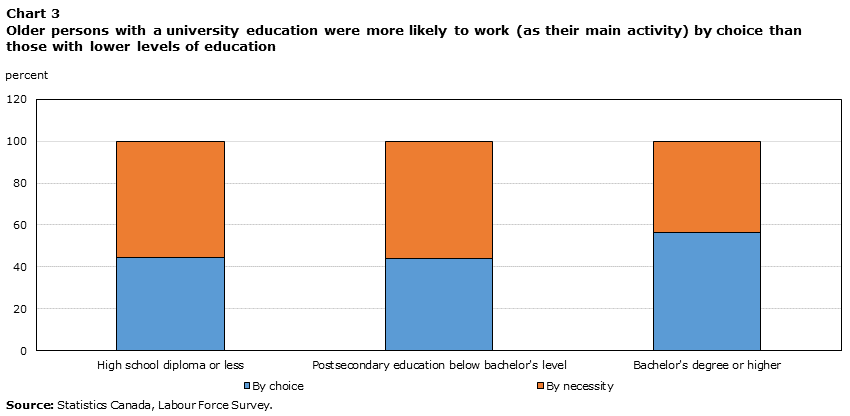
Data table for Chart 3
| By choice | By necessity | |
|---|---|---|
| percent | ||
| High school diploma or less | 44.6 | 55.4 |
| Postsecondary education below bachelor's level | 44.2 | 55.8 |
| Bachelor's degree or higher | 56.2 | 43.8 |
| Source: Statistics Canada, Labour Force Survey. | ||
Among older people for whom working was their main activity in the previous year, employees were more often citing they worked by necessity (56.5%) than the self-employed (42.4%). A higher propensity of working by necessity among older employees was observed across all broad education levels compared with the older self-employed. Overall, 71.6% of older people who worked as their main activity in the previous 12 months reported mainly being employees and 28.4% were mainly being self-employed. LFS data show that older workers are more likely to be self-employed than core-aged and young workers. Research suggests this phenomena mainly reflects the fact that self-employed tend to stop working at a later age than employees and, to a lesser extent, because a number of older people transition to self-employment (Schuetze, 2015).
For older workers who reported being self-employed, the most common reasons reported for doing so were ‘independence/freedom/own boss’, and ‘had to be self-employed (nature of job)’.
Of all older employees, about 9 in 10 (86.0%) mainly had permanent employment in the previous year while a little over 1 in 10 (14.0%) had temporary employment. The most common reasons for being employed on a temporary basis were that ‘the job had to be non-permanent (nature of job)’, ‘other’, which includes the reason ‘the job is seasonal’, and ‘did not want a permanent job’. Among older temporary employees, necessity was cited by 42.4% of employees as the main reason for working.
Canadians aged 60 and over working in agriculture and in professional, scientific and technical services were the most likely to be working by choice
Looking at those who were employed in September 2018, the proportions of the 60 and older who worked or wanted to work by necessity in the previous 12 months were highest in transportation and warehousing (63.6%), construction (63.1%), and business, building and other support services (62.2%). By contrast, working or wanting to work by necessity was least common in agriculture (37.8%) and professional, scientific and technical services (38.5%). This is consistent with the fact that many workers in agriculture are self-employed and that those in professional, scientific and technical services tend to be more highly educated, two categories of workers who are mostly working by choice.

Data table for Chart 4
| By choice | By necessity | |
|---|---|---|
| percent | ||
| Agriculture | 62.2 | 37.8 |
| Professional, scientific and technical services | 61.5 | 38.5 |
| Information, culture and recreation | 56.1 | 43.9 |
| Retail trade | 50.6 | 49.4 |
| Educational services | 50.2 | 49.8 |
| Public administration | 49.1 | 50.9 |
| Other services (except public administration) | 48.7 | 51.3 |
| Health care and social assistance | 47.8 | 52.2 |
| Finance, insurance, real estate, rental and leasing | 47.4 | 52.6 |
| All industries | 47.1 | 52.9 |
| Natural resources | 45.0 | 55.0 |
| Utilities | 44.5 | 55.5 |
| Wholesale trade | 43.6 | 56.4 |
| Accommodation and food services | 41.2 | 58.8 |
| Manufacturing | 41.0 | 59.0 |
| Business, building and other support services | 37.8 | 62.2 |
| Construction | 36.9 | 63.1 |
| Transportation and warehousing | 36.4 | 63.6 |
| Source: Statistics Canada, Labour Force Survey. | ||
Looking at broad occupational groups, working or wanting to work by necessity was most often reported by older persons in trades, transport and equipment operators occupations (63.4%) and by those in occupations in manufacturing and utilities (61.8%). In contrast, the largest proportions of older persons who were working or wanted to work by choice were in occupations in art, culture, recreation and sport (57.2%) and management (56.7%).
Conclusion
Close to 1 in 3 persons aged 60 and over were working or wanted to work in the previous year, according to a one-time addition of questions in the LFS on the reasons for working among older persons. Why are so many persons working beyond their 50s instead of enjoying retirement? About half of those working or wanting to work reported this was mainly because they needed to while the other half mainly did it by choice. The proportion of people working or wanting to work by necessity fell with age, decreasing to 28.4% for those aged 70 and over, as people become eligible to public and private pension plans.
Start of text box
Data sources and definitions
This analysis uses data that were derived from questions added to the September 2018 Labour Force Survey to determine, among other topics, the main activity of respondents in the previous 12 months. The reasons for working or wanting to work over this period were also asked to persons aged 60 and over who reported having worked or wanting to work in the previous 12 months. Hence, this analysis focusses on older persons aged 60 years and over.
The additional questions, which were asked on a voluntary basis, were:
a) During the past 12 months, was your main activity working at a paid job, self-employed or something else?
b) During the past 12 months, was your main job permanent, or is there some way that it was not permanent (for example, seasonal, temporary, term or casual)?
c) What was the main reason you were in a non-permanent job?
d) What was the main reason you were self-employed?
e) In the past 12 months, what was your main activity? (if working was not the main activity)
f) Did you work at a job or business at any time in the past 12 months?
g) Did you want to work in the past 12 months?
h) What was your main reason for wanting to work in the past 12 months? (if respondent did not work but wanted to work)
i) What was your main reason for working in the past 12 months? (if respondent worked)
j) In the past 12 months, how often did you volunteer for a group or organization?
k) In the past 12 months, how often did you carry out any of these types of activities without pay?
End of text box
References
Baker, Michael, Jonathan Gruber and Kevin Milligan. 2001. “The Retirement Incentive Effects of Canada’s Income Security Programs.” NBER Working Paper Series. No. 8658. The National Bureau of Economic Research. Cambridge, Massachusetts.
Carrière, Yves and Diane Galarneau. 2012. “How many years to retirement?” Insights on Canadian Society. Statistics Canada Catalogue no. 75-006-X.
Carrière, Yves and Diane Galarneau. 2012. “The Impact of Involuntary Breaks in Employment and Level of Education on the Timing of Retirement.” Labour Statistics: Research Papers. Statistics Canada Catalogue no. 75-004-M.
Chen, Xuyang, Maxime Fougère and Bruno Rainville. 2012. “Financial Factors and Labour Market Transitions of Older Workers in Canada.” International Journal of Population Research. Vol. 2012, article ID 458723.
Drolet, Marie and René Morissette. 2014. “New facts on pension coverage in Canada.” Insights on Canadian Society. Statistics Canada Catalogue no. 75-006-X.
Gougeon, Philippe. 2009. “Shifting pensions.” Perspectives on Labour and Income. Vol. 10, no. 5. May. pp. 16-23. Statistics Canada Catalogue no. 75-001-X.
Messacar, Derek. 2017. “The Effects of Education on Canadians’ Retirement Savings Behaviour.” Analytical Studies Branch Research Paper Series. No. 391. March. Statistics Canada Catalogue no. 11F0019M.
Pignal, Jean, Stephen Arrowsmith and Andrea Ness. 2010. First Results from the Survey of Older Workers, 2008. Statistics Canada Catalogue no. 89-646-X. Ottawa, Ontario.
Schuetze, Herbert J. 2015. “Self-Employment and Retirement in Canada: The Labour Force Dynamics of Older Workers.” Canadian Public Policy. Vol. 41, no. 1. March. pp. 65-85.
Statistics Canada. 2017. “Working seniors in Canada.” Census in Brief. 2016 Census of Population. Statistics Canada Catalogue no. 98-200-X2016027.
Uppal, Sharanjit. 2016. “Financial literacy and retirement planning.” Insights on Canadian Society. Statistics Canada Catalogue no. 75-006-X.
- Date modified: