
Labour Force Information
Chart 9

Archived Content
Information identified as archived is provided for reference, research or recordkeeping purposes. It is not subject to the Government of Canada Web Standards and has not been altered or updated since it was archived. Please "contact us" to request a format other than those available.
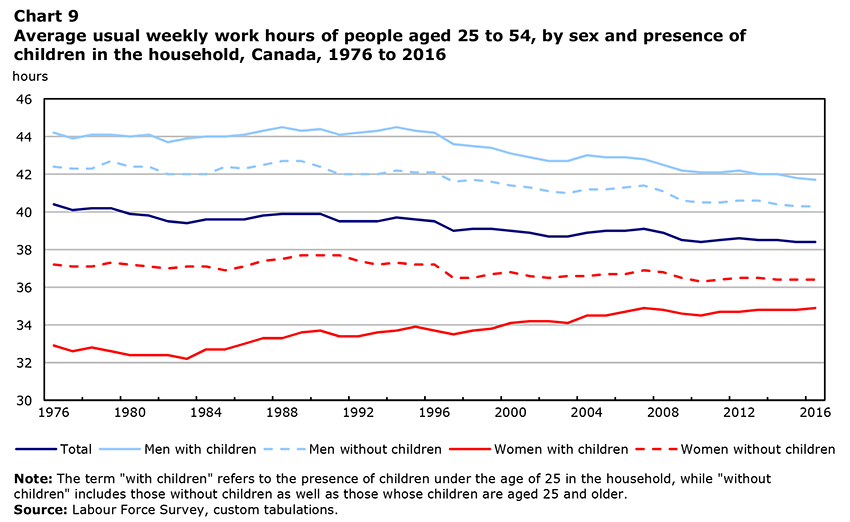
Description for Chart 9
| Years | Total | Men with children | Men without children | Women with children | Women without children |
|---|---|---|---|---|---|
| hours | |||||
| 1976 | 40.4 | 44.2 | 42.4 | 32.9 | 37.2 |
| 1977 | 40.1 | 43.9 | 42.3 | 32.6 | 37.1 |
| 1978 | 40.2 | 44.1 | 42.3 | 32.8 | 37.1 |
| 1979 | 40.2 | 44.1 | 42.7 | 32.6 | 37.3 |
| 1980 | 39.9 | 44.0 | 42.4 | 32.4 | 37.2 |
| 1981 | 39.8 | 44.1 | 42.4 | 32.4 | 37.1 |
| 1982 | 39.5 | 43.7 | 42.0 | 32.4 | 37.0 |
| 1983 | 39.4 | 43.9 | 42.0 | 32.2 | 37.1 |
| 1984 | 39.6 | 44.0 | 42.0 | 32.7 | 37.1 |
| 1985 | 39.6 | 44.0 | 42.4 | 32.7 | 36.9 |
| 1986 | 39.6 | 44.1 | 42.3 | 33.0 | 37.1 |
| 1987 | 39.8 | 44.3 | 42.5 | 33.3 | 37.4 |
| 1988 | 39.9 | 44.5 | 42.7 | 33.3 | 37.5 |
| 1989 | 39.9 | 44.3 | 42.7 | 33.6 | 37.7 |
| 1990 | 39.9 | 44.4 | 42.4 | 33.7 | 37.7 |
| 1991 | 39.5 | 44.1 | 42.0 | 33.4 | 37.7 |
| 1992 | 39.5 | 44.2 | 42.0 | 33.4 | 37.4 |
| 1993 | 39.5 | 44.3 | 42.0 | 33.6 | 37.2 |
| 1994 | 39.7 | 44.5 | 42.2 | 33.7 | 37.3 |
| 1995 | 39.6 | 44.3 | 42.1 | 33.9 | 37.2 |
| 1996 | 39.5 | 44.2 | 42.1 | 33.7 | 37.2 |
| 1997 | 39.0 | 43.6 | 41.6 | 33.5 | 36.5 |
| 1998 | 39.1 | 43.5 | 41.7 | 33.7 | 36.5 |
| 1999 | 39.1 | 43.4 | 41.6 | 33.8 | 36.7 |
| 2000 | 39.0 | 43.1 | 41.4 | 34.1 | 36.8 |
| 2001 | 38.9 | 42.9 | 41.3 | 34.2 | 36.6 |
| 2002 | 38.7 | 42.7 | 41.1 | 34.2 | 36.5 |
| 2003 | 38.7 | 42.7 | 41.0 | 34.1 | 36.6 |
| 2004 | 38.9 | 43.0 | 41.2 | 34.5 | 36.6 |
| 2005 | 39.0 | 42.9 | 41.2 | 34.5 | 36.7 |
| 2006 | 39.0 | 42.9 | 41.3 | 34.7 | 36.7 |
| 2007 | 39.1 | 42.8 | 41.4 | 34.9 | 36.9 |
| 2008 | 38.9 | 42.5 | 41.1 | 34.8 | 36.8 |
| 2009 | 38.5 | 42.2 | 40.6 | 34.6 | 36.5 |
| 2010 | 38.4 | 42.1 | 40.5 | 34.5 | 36.3 |
| 2011 | 38.5 | 42.1 | 40.5 | 34.7 | 36.4 |
| 2012 | 38.6 | 42.2 | 40.6 | 34.7 | 36.5 |
| 2013 | 38.5 | 42.0 | 40.6 | 34.8 | 36.5 |
| 2014 | 38.5 | 42.0 | 40.4 | 34.8 | 36.4 |
| 2015 | 38.4 | 41.8 | 40.3 | 34.8 | 36.4 |
| 2016 | 38.4 | 41.7 | 40.3 | 34.9 | 36.4 |
| Source: Labour Force Survey, custom tabulations. | |||||
- Date modified: