
Prices Analytical Series:
Technical Guide for the For-hire Motor Carrier Freight Services Price Index (FHMCFSPI)
Skip to text
Text begins
1 Introduction
The For-hire Motor Carrier Freight Services Price Index (FHMCFSPI) measures monthly and quarterly movements in prices of services provided by trucking companies in Canada. The FHMCFSPI is an aggregation of the following five 5-digit NAICS service industries:
- NAICS 48411: General freight trucking, local
- NAICS 48412: General freight trucking, long distance
- NAICS 48421: Used household and office goods moving
- NAICS 48422: Specialized freight trucking, local
- NAICS 48423: Specialized freight trucking, long distance
A sub-aggregation for General Freight Trucking [4841] is created by pooling data for NAICS 48411 and NAICS 48412. General Freight Trucking covers a variety of commodities and does not require the use of specialized equipment.
A second sub-aggregation for Specialized Freight Trucking [4842] is created by pooling data for NAICS 48421, NAICS 48422 and NAICS 48423. Specialized Freight Trucking covers transportation of commodities that require specialized equipment due to their size, weight, or other inherent characteristics.
The FHMCFSPI is an important indicator of economic activity within the truck transportation industry, serving as a tool for performance evaluation, cost monitoring, contract assessment and benchmark comparisons. Truck transportation is an integral component of supply chain and is also the most significant mode of freight transportation in Canada. The FHMCFSPI also provides supplemental information to the Canadian System of Macroeconomic Accounts to calculate real gross domestic product and measure changes in productivity.
2 Data
The monthly data used to construct the FHMCFSPI are collected on a quarterly basis via an electronic questionnaire. Data collection for the reference quarter begins in the middle of the last month of the quarter and continues for six weeks. The data for the reference quarter is released three weeks after the end of collection.
Indexes are published at the national level for each of the 5-digit NAICS industries, NAICS 4841, NAICS 4842, and for the overall aggregated FHMCFSPI.
2.1 Sampling Process
The target population for the FHMCFSPI survey consists of all establishments on the Statistics Canada's Business Register (BR) that are classified to NAICS 484 Truck Transportation under the North American Industry Classification System (NAICS).
The population is stratified by region and 5-digit NAICS. Establishments that contribute to the bottom 10% of the total revenue in each region and 5-digit NAICS are excluded from the sampling frame. The largest establishments are selected into the sample with a probability of 100%, forming the take-all (TA) stratum. The remaining establishments are selected for the take-some (TS) stratum based on the Sequential Poisson Probability Proportional to Size sampling methodology, whereby the probability of selection is proportional to revenue.
2.2 Prices
The price is defined as the amount charged by a carrier for delivering a specific freight between selected origin and destination under certain terms of shipment.
| NAICS | Freight Carried | Volume | Origin | Destination |
|---|---|---|---|---|
| 48423 | Wheat | 1234 kilograms | Calgary | Toronto |
| Source: Statistics Canada. | ||||
Each establishment is asked to report for three services that are representative of the industry it is classified to and can consistently provide monthly prices every quarter. For quarterly collection cycle, base rate, fuel surcharge, discounts along with other specifications of the service, such as freight carried, volume, origin, destination, and distance are obtained from respondents. The FHMCFSPI takes into account origin destination pairs across Canada and the US.
These collected prices are used to compute a final price for each service. Final price is the dollar amount invoiced to a client for a particular shipping service and includes adjustments for discounts and surcharges but excludes all taxes. If applicable, the final price in US dollar is converted to Canadian dollar using the Bank of Canada monthly average exchange rate. The final price is defined as:
The FHMCFSPI survey aims to track same services over time to maintain continuity in the price index; however, service substitutions do occur periodically if shipping services are updated or become discontinued.
In any given period, price data may not be available for collection. In such cases, missing prices are imputed using the average price movement of remaining services within the establishment. If all services within an establishment have missing prices, then imputation is done using the average price movement of remaining units within the same stratum (TA or TS).
2.2.1 Outliers
The FHMCFSPI excludes outliers from calculation if there is reason to believe that the reported prices do not accurately represent a service’s pure price movement. Outlier prices are not representative of typical industry movement and, if left untreated, may disproportionately drive the index.
Prices are flagged for outlier review if they vary more than twenty percent of the previous month’s prices. Outlier treatment is subject to analyst’s judgment, on a case-by-case basis, and takes services’ historical trends and industry trends into account.
2.3 Revisions
With each data release, data for the previous quarter may be revised. These revisions occur when late data is collected for a previously non-responding establishment. The indexes are not seasonally adjusted.
This revision period exists so that respondents can edit their price data for the previous quarter. This is conducive to price data quality as respondents may make corrections to their data, as in cases of input errors or revisions and audits of their prices.
2.4 Weights
The FHMCFSPI is calculated as a weighted average of the price change of trucking services in Canada. The weights are designed to capture the relative importance of establishments and industries as measured by their revenue shares. The overall impact of a price change of an establishment on the total index is determined by its weight value.
Two sets of weights are associated with each sampled unit: economic weights and design weights. Economic weights refer to the establishment revenue at the time of selection of the sample and are derived from the revenue data reported in the Statistics Canada's BR. The economic weights of establishments are accumulated to derive their respective industry weights. The share of total revenue of each industry in the sample is assumed to be representative of the true share of the industry in the population.
The design weight can be interpreted as the revenue in the target population that each sampled unit represents and is equivalent to the reciprocal value of the establishment’s probability of being included in the sample.
For the FHMCFSPI, sampling weight is the product of economic weight and design weight for each establishment and represents its relative importance in the population. Sampling weights are used for aggregating upper-level indexes.
3 Aggregation Structure
Figure 1 presents the aggregation structure from the elementary aggregates at the establishment level up to the total FHMCFSPI. Elementary aggregates are defined as the lowest level of aggregation and are formed by taking an unweighted geometric average of price relatives of services. All index levels above elementary aggregates use sampling weights for aggregation.
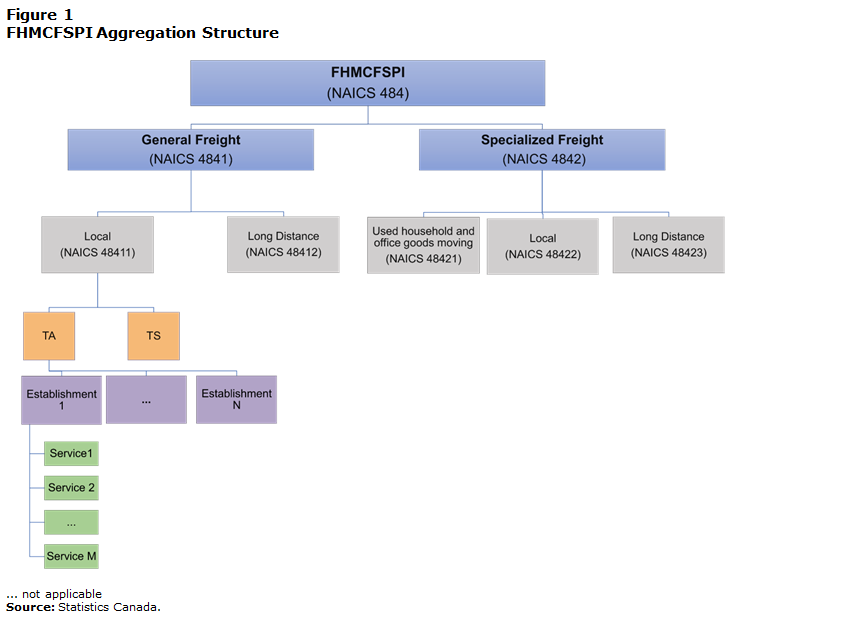
Description for Figure 1
This diagram illustrates the aggregation structure for the FHMCFSPI. The highest level of aggregation is the total FHMCFSPI. Below the total index are indexes for two sub‑aggregations, General Freight Trucking [NAICS 4841] and Specialized Freight Trucking [NAICS 4842].
Each 4‑digit NAICS index is calculated using the 5‑digit NAICS price indices below it where each 5‑digit NAICS is estimated by aggregating its respective stratum indices. Each stratum index is calculated using the n establishment level elementary price indices where each elementary price index is estimated by aggregating the price relatives of m shipments for each establishment.
4 Index Estimation and Aggregation
4.1 Introduction
The FHMCFSPI is based on a fixed sample, where price changes for a fixed basket of services are measured over time. The FHMCFSPI is calculated for the current period and compared to the previous period to track changes in prices.
Index estimates are produced by calculating a weighted average of price relatives by industry [NAICS 4841 and NAICS 4842], which are then chained together to form an index series for NAICS 484. The FHMCFSPI is a fixed base Laspeyres index, available at the national level only.
All levels of indexes along with the top level FHMCFSPI are estimated using a transparent and efficient R-based process. The package, PIAR Price Index AggregationNote , is used for index estimation where month-over-month elemental indexes are first calculated for elementary aggregates each month, and then aggregated according to the aggregation structure.
4.2 Calculation of elementary aggregates
At the lowest level, the price relatives are aggregated using an unweighted geometric average of shipping services for each establishment for each stratum (i.e., a Jevons index).
The monthly index for establishment n in stratum k is given by:
: Elementary aggregate for establishment n in stratum k at time t.
: Price of shipping service m for establishment n in stratum k at time t.
4.3 Compilation of upper-level aggregated indexes
The elementary price indexes are aggregated across establishments within each stratum to calculate a stratum index using a weighted arithmetic Laspeyres. Both stratum indexes are then combined to calculate their corresponding 5-digit level NAICS index .
At higher level of aggregations, the 4-digit NAICS index is computed using the period-to-period price relatives of its 5-digit NAICS industries.
The above price index is then aggregated across both NAICS 4-digit level indexes, , to produce the total FHMCFSPI. The monthly total FHMCFSPI is calculated as follows:
Where;
: The total monthly price index for the trucking industry [484] at time t.
: Price index for the NAICS 4-digit level industry i at time t.
: Price updated weights of NAICS 4-digit level industry i at time t. Price updated weights are obtained by multiplying the initial revenue weights by price relatives. This allows the index to be chained i.e., be calculated between month t and t-1 without referring to the base period t0 .
: The base weight of NAICS 4-digit level industry i.
: The FHMCFSPI at time 0.
The quarterly index is the average index value of the three months within a given quarter. The index is calculated using the following formula:
: The total quarterly price index for the trucking industry [484].
4.4 Basket Updates
Revenue weights of the sampling units are updated on a regular basis to better represent current economic activity. For the FHMCFSPI, this occurs every 5 years. Basket updates consist of revising revenue weights and the sample of establishments by adding or removing units to ensure the sample is representative of the population.
With the introduction of a new basket, historical estimates are linked to the new basket by maintaining the same historical monthly changes. This is achieved by multiplying each element of the old index series by a link factor, which is calculated as the ratio of the new index value to the old index value in the overlap period. This chain-linking process ensures that period-over-period changes in the index only reflect price movements.
- Date modified: