
Prices Analytical Series
Technical Guide for the Wholesale Services Price Index (WSPI)
1 Introduction
The Wholesale Services Price Index (WSPI) measures the monthly and the quarterly changes in the price of wholesale services in Canada. This index is an indicator of economic activity in the wholesales services sector, as well as a tool that can be utilized by the industry for cost monitoring, contract assessment and benchmark comparisons. In addition, it is used by the Canadian System of Macroeconomic Accounts to arrive at estimates of real value added for the industry and to measure changes in productivity.
The WSPI is comprised of two separate indexes: an industry-based index and a product-based index.
The industry-based index covers the Wholesale Trade sector, which is classified to Code 41 under the North American Industry Classification System (NAICS) 2017 v3. This sector comprises establishments primarily engaged in wholesaling merchandise, generally without transformation, and rendering services incidental to the sale of merchandise. The index excludes Business-to-business electronic markets, agents and brokers (Code 419).
The product-based index covers the Wholesale trade (except commissions) group of products, which is classified to Code 551 under the North American Products Classification System (NAPCS) 2017 v2. This group comprises the services of buying and selling merchandise on own account at an intermediate step in the distribution chain. Wholesale services bundled with services incidental to the own account sale of merchandise such as logistics, inventory management, marketing services, packaging and labeling, handling of warranty claims, in-store or co-op promotions, and product training are also included.
The industry-based WSPI is published on a quarterly basis, 3 months after the reference period. Estimates for the previous quarter may be revised during every quarterly release. The product-based WSPI is not published and may be accessed by request.
2 Data Sources
The price data used to produce the WSPI is obtained through the Wholesale Services Price Index survey. Data collection takes place during the quarter following the reference quarter. Monthly data is collected and released on a quarterly basis.
Since a product survey frame is not available, the product-based index uses the same sample as the industry-based index.
2.1 Sampling process
The target population for the WSPI survey consists of all establishmentsNote on the Statistics Canada's Business RegisterNote that are classified to NAICS 41 Wholesale Trade under the North American Industry Classification System (NAICS), excluding Business-to-business electronic markets, agents and brokers.
The population is stratified by NAICS 5 industry. The sample is drawn using a probability proportional to size method called Sequential Poisson samplingNote . The establishments with a probability of selection equal to or greater than one are selected with certainty, forming the take-all (TA) stratum. The remaining establishments were selected with a probability proportional to the establishment revenue, forming the take-some (TS) stratum.
The sample was last updated in 2016 using Business Register data for 2013.Note The targeted sample size of 3,460 establishments was chosen to obtain a sufficient number of price quotes to represent the industry.
Each establishment selected for the WSPI survey is asked to report a maximum of six products chosen based on a judgmental sampling approach. The respondent is asked to select products that are representative of the business’ wholesaling activity, i.e. products that are a major wholesale revenue generator for the business and are sold regularly throughout the year.
If a product is discontinued and no longer sold, respondents are asked to replace it with a similar product in the same product group.
2.2 Prices
The price of the wholesale service is defined as the margin price, which is the difference between the average purchase price and the average selling price of a given product for a given month: It does not constitute and should not be interpreted as a wholesale selling price.
To derive the margins, the WSPI survey collects the monthly average purchase prices and the monthly average selling prices for each of the products selected by the respondent. Purchase price is the cost incurred by the business to acquire the product and includes adjustments for discounts, rebates, freight, and duties. Selling price is the amount received by the business for selling the product and includes adjustments for discounts and promotions but excludes taxes and freight.
The survey aims to track the same products over time to maintain continuity in the margin price index; however, product substitutions do occur periodically if products become updated or discontinued. To minimize the number of breaks in the series, price movements resulting from product changes are researched and validated so that products deemed comparable are accepted into the index calculation. A product is deemed “comparable” to the old one if it serves the same function, has similar characteristics and prices, and serves the same niche market. Price movements that arise from non-comparable product substitutions are excluded, as are negative margins and outlier margins.
In order to avoid creating breaks in the reported data, missing data, due to non-response or to exclusions, are imputed using the parental imputation method. The first level of imputation is at the establishment level, i.e. products with missing prices are imputed using the average price movement of all other products within the establishment. If all products within the establishment have missing prices, then imputation is done using the average movement at the next level of aggregation, and so forth. For the industry-based index, this would be the TA or TS stratum movement followed by the industry movement. For the product-based index, this would be the product detail movement.
2.2.1 Outliers
The WSPI excludes outliers from calculation if there is reason to believe that the reported prices do not accurately represent a product’s pure price movement. For example, inventory liquidation by merchant wholesalers are a situation where reported prices do not reflect what they would be sold at under normal circumstances. Outlier margins are not representative of typical industry movement, and if left untreated, may disproportionately drive up or down the index.
Margins are flagged for outlier review if they are more than three times or less than one-third of the previous month’s margins.Note Price movements within this range are deemed typical of most wholesalers based on historical wholesale data. Outlier treatment is subject to analyst’s judgment, on a case-by-case basis, and takes products’ historical trends and industry trends into account. For certain volatile industries and products, more extreme movement is a regular occurrence and may not disrupt historical trends. For others such as those whose prices are less than a dollar or whose prices rarely change month-over-month, small movement can create large spikes in the index.
2.3 Weights
As WSPI is a sample survey, weights for aggregation are establishments’ revenue in the population at the time of sample selection. There are two sets of weights associated to each sampling unit: the economic weight and the design weight. The economic weight is the establishment’s revenue at the time of sample selection. The design weight is the inverse of the establishment’s selection probability, this is the weight induced by the sample design. The design weight can be interpreted as the number of times that each sampled unit should be replicated to represent the entire population. Sampling revenue weight is the product of the economic weight and the design weight and represents the relative importance of the corresponding sampling unit in the population.
Weights are updated during a sample/basket update which typically occurs every 5 years. The last update occurred with the release of second quarter 2016 data.Note
2.3.1 Industry-based index (NAICS)
The WSPI based on the NAICS industry classification uses establishment revenues and industry gross margins as its weighting sources. Establishment revenue data are derived from the Business Register and the industry gross margins from Statistics Canada’s Annual Wholesale Trade Survey (AWTS).
All levels of aggregation above the industry level (i.e. NAICS 4 and above) use annual gross margin weights. The weight reference period is currently 2013. The last update occurred with the release of second quarter 2016 data.
2.3.2 Product-based index (NAPCS)
The Wholesale Services Price Index (WSPI) based on the product classification (NAPCS) uses sales of goods by product detail category and establishment and gross margins by product detail category as its weighting sources. Sales of goods and gross margins by product detail category are derived from the AWTS.
Establishments are divided into the overlap Note and non-overlapNote groups, where “overlap” serves to define establishments that are sampled into both the Wholesale Services Price Index survey and the Annual Wholesale Trade Survey. Overlap units have a weight equal to the reported sales of goods by product detail category. Establishments in the non-overlap group are weighted using sales revenues by product detail category for their respective industries. These weights are used to aggregate the establishment indexes to the product detail category level.
All levels of aggregation above the product detail category level (i.e. NAPCS 6 and above) use annual gross margin weights.
The weight reference period is currently 2016.
2.4 Revision Period
With each data release, data for the previous quarter may have been revised. These revisions occur when late data is collected for a previously non-responding establishment and respondent input errors or revisions.
The WSPI does not revise data further than a single quarter and does not take into account the seasonality of products and their prices. This revision period exists so that respondents can edit their price data for the previous quarter. This is conducive to price data quality as respondents may make corrections to their data, as in cases of input errors or revisions and audits of their prices.
3 Aggregation Structure
3.1 Industry-based Aggregation Structure
For the industry-based WSPI, establishments are classified into one of 70 industries which are further gathered in 8 subsectors. Figure 1 presents the aggregation structure from the elementary aggregates at the establishment level up to the top level NAICS 2 Wholesale Sector index, or the total WSPI.

Description for Figure 1
This diagram presents the aggregation structure for the industry-based WSPI. The structure consists of various levels of aggregation from the elementary aggregates at the establishment level up to the top level NAICS 2 Wholesale Sector index, or the total WSPI.
The lowest elementary aggregates at the establishment level are formed by taking an unweighted geometric average of the price relatives (Jevons index) of all products reported by the establishment. Establishments are grouped into TA or TS stratum.
Elementary aggregates (or establishment relatives) from the TA and TS stratums are combined using a weighted arithmetic average to form respectively the TA and TS stratum indexes, using weights derived from establishment revenues from the Business Register. TA and TS indices are combined to create the next level of aggregation: the NAICS 5 Industry index.
All the Industry indices within the same 4-digit NAICS are then combined to form the NAICS 4 Industry Group indices. Industry Group indices are aggregated to form the NAICS 3 Subsector indices, which are finally combined to form the NAICS 2 Wholesale Sector index, or total industry-based WSPI. All levels of aggregation above the NAICS 5 industry level use annual gross margin weights from the Annual Wholesale Trade Survey (AWTS).
3.2 Product-based Aggregation Structure
For the product-based WSPI, wholesale services are classified into one of 199 product detail groups gathered in 9 classes. Figure 2 presents the aggregation structure of the product-based WSPI from the elementary aggregates at the establishment level up to the top level NAPCS 3 Wholesale Group index, or the total product-based WSPI.
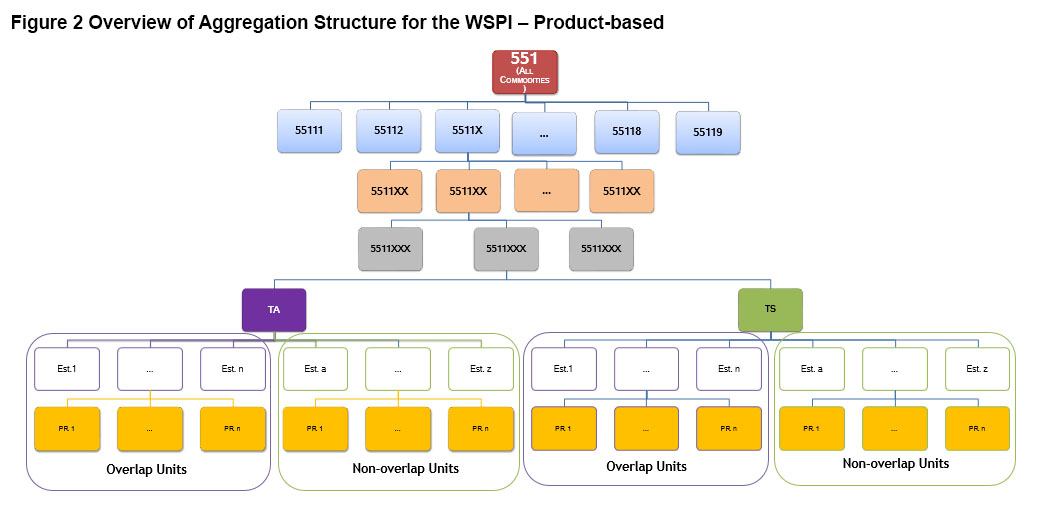
Description for Figure 2
This diagram presents the aggregation structure for the product-based WSPI. The structure consists of various levels of aggregation from the elementary aggregates at the establishment level up to the top level NAPCS 3 Wholesale Group index, or the total product-based WSPI.
The lowest level of aggregation consists of performing an unweighted geometric average of price relatives (Jevons index) at the establishment level to form establishment elementary aggregates. Establishments fall into either the overlap or the non-overlap groups.
Establishment elementary aggregates are aggregated together within the overlap and the non-overlap groups to form the TA and TS stratum indexes. Establishments in the overlap group are weighted by sales of goods sold reported in the AWTS for a specific product detail category. Establishments in the non-overlap group are weighted using an allocation of commodity group sales revenues by industry, which serves as proxies.
The stratum level indexes are then used to form the NAPCS 7 Detail index which uses a weighted arithmetic average. The Detail indexes are subsequently aggregated to form the NAPCS 6 Subclass indexes, which are then aggregated to form the NAPCS 5 Class indexes. Finally the 9 Class indexes are combined to form the NAPCS 3 Group index, or the total product-based WSPI. All levels of aggregation above the NAPCS 7 Detail level are weighted using annual gross margins from the AWTS.
4 Index Estimation and Aggregation
4.1 Introduction
The WSPI is based on a fixed sample-drawn in 2013. The base period is 2013 (2013=100). The index is calculated for the current period and compared to the previous period in order to measure the price change using a two stage approach. At the first stage, an elementary index is calculated using a Jevons formula. In the second stage or upper aggregates, a weighted arithmetic average is calculated using a chain calculation where the weights are price updated each period.
4.2 Calculation of elementary aggregates
At the first stage, the price relatives are aggregated using an unweighted geometric average, also known as a Jevons to form a price index for a particular establishment. These initial level aggregations are referred to as elementary price indices. The formula for a Jevons is as follows.
Where represents the elementary aggregate for establishment i at time t.
4.3 Compilation of upper level aggregated indices
4.3.1 Industry-based Index
The elementary price indices are then aggregated across establishments within the TA and TS stratums, and then industry, using a weighted arithmetic average. The weights used to aggregate to the NAICS 5 level are the establishment sampling revenue weights . The calculation is done using a chain approach, which means the value of any given period is compared to the value of its immediately preceding period, rather than to the base period. This allows the price relative from period to period to be reflected directly in the calculation. To do this, weights at the upper level need to be price updated.
The index for a TA or TS strata NAICS 5 industry j at time t is given by:
If we let:
denote the price index for strata level at the NAICS 5-digit industry j at time t.
denote the initial weights for establishment k.
denote establishment k price updated weights at time t.
At higher level of aggregations, the index is computed using the period to period price relatives of the NAICS level directly below it (i.e a weighted arithmetic average of all indices within that aggregation level).
Thus, the index above the NAICS 5-digit strata level can be generalized as:
If we let:
denote the index at the jth NAICS level
denote the period-to-period price relative of the ith NAICS level where the ith NAICS level is exactly one level below the jth NAICS level.
denote the initial weight at the ith NAICS level.
denote the price updated weights at the ith NAICS level.
4.3.2 Product-based Index
Within each 7-digit NAPCS stratum, the elementary price indexes are aggregated using a weighted arithmetic average of all establishments across the overlap and non-overlap groups to create the strata level indices. The weights used for this aggregation are derived from the proportion of sales of goods sold for the product detail category in the Annual Wholesale Trade Survey.
The index at the strata level for NAPCS 7 product detail category j at time t is given by:
If we let:
denote the price index at the strata level for the NAPCS 7-digit product detail category j at time t.
denote establishment k initial weights
denote establishment k price updated weights at time t.
At the higher level of aggregations, the index is computed by taking a weighted arithmetic average of all product detail category period-to-period relatives directly below that aggregation. The weight for each product detail category is the total product detail category gross margins, as reported in the Annual Wholesale Trade Survey.
Thus, the index above the NAPCS 7-digit strata level can be defined as:
If we let:
denote the index at the jth NAPCS level
denote the period-to-period price relative of the ith NAPCS level where the ith NAPCS level is exactly one level below the jth NAPCS level.
denote the initial weight at the ith NAPCS level.
denote the price updated weights at the ith NAPCS level.
Glossary
Imputation / Parental imputation method
Industry-based aggregation structure / NAICS
Industry-based Index / North American Industry Classification System (NAICS)
Product-based aggregation structure / NAPCS
Product-based index / North-American Product Classification System (NAPCS)
Sampling method / Sequential Poisson sampling
Wholesale Service Price Index (WSPI)
Related information
For a more detailed description of the Wholesale Services Price Index (WSPI), please visit the WSPI Surveys and statistical programs page; https://www23.statcan.gc.ca/imdb/p2SV.pl?Function=getSurvey&SDDS=5106
Recently published data for WSPI can be found on Statistics Canada’s “results and documentation of surveys and statistical programs” page: https://www150.statcan.gc.ca/n1/en/surveys/5106
Visit the Producer price indexes portal to view a wide variety of statistics and measures related to producer prices: https://www.statcan.gc.ca/eng/subjects-start/prices_and_price_indexes/producer_price_indexes
- Date modified: