
Prices Analytical Series
Industrial Product Price Index: Annual Review, 2020
Skip to text
Text begins
1 Summary
The effects of the COVID-19 pandemic on the global economy had a substantial influence on the prices of many commodities sold by manufacturers operating in Canada in 2020, as measured by the Industrial Product Price Index (IPPI).
Overall, the IPPI fell 0.5% between 2019 and 2020, its second consecutive year of decline. A 27.5% decrease in energy and petroleum product prices was the main factor behind this annual decline.
Excluding energy and petroleum products, the IPPI rose 2.7% between 2019 and 2020, mainly as a result of higher prices for primary non-ferrous metal products (+12.6%), lumber and other wood products (+19.3%), and meat, fish, and dairy products (+5.6%).
2 The COVID-19 pandemic
The first case of COVID-19 was reported to the World Health Organization (WHO) on December 31st, 2019. Initially described as an unknown form of pneumonia, the infection had first been detected in the city of Wuhan, Hubei province, China, earlier that month (WHO, 2020, July 31). From this point, the virus spread rapidly, prompting global lockdowns that heavily impacted economic activity.
In Canada, the first presumptive case of COVID-19 was a reported on January 25th, 2020. The number of new infections reported per day rapidly escalated, reaching more than 1,000 per day on March 20th (Government of Canada, 2020a) and prompting both interprovincial and international border shutdowns, business and school closures, and civilian lockdown measures designed to decrease contacts and, therefore, case numbers. Those who were able to shift to remote work, did so, while more than one million were left unemployed by either temporary or permanent layoffs between February and April, as their places of employment were forced to close (Gellatly, 2020). Despite extensive measures put in place by the Federal Government to support individuals and businesses, over 88,000 businesses closedNote in Canada during the month of April, the most in the last 5 years (Lafrance-Cooke, MacDonald, and Willox, 2020; Statistics Canada, Table 33-10-0270-01). Consumer activities shifted dramatically, with Canadians staying home, travelling less, and buying more of certain items, such as household goods, and less of others (e.g. passenger vehicles), while industrial activities slowed or stopped due to public health restrictions, impacting the prices of raw materials and industrial and consumer products (Gellatly, 2020; Statistics Canada, 2020, April 8; Statistics Canada, 2020, April 30; Statistics Canada, 2020, May 29; Statistics Canada, 2020, October 8; Statistics Canada, 2020, December 11).
National new cases of COVID-19 fell to less than 1,000 per day for the first time on May 10th (Government of Canada, 2020a). Lockdown measures began to ease by May in many provinces as the number of daily new infections decreased. As activities resumed, production backlogs and pent-up demand again impacted prices. Case numbers began to rise again in late August, once more reaching over 1,000 per day on September 14th, prompting renewed lockdowns, though often on a more limited scale than during the first wave (Government of Canada, 2020a; Kirkey, 2020).
On December 9th, Health Canada authorized the Pfizer-BioNTech COVID-19 mRNA vaccine, with the first doses administered on December 14th (Gillies, 2020; Government of Canada, 2020b). At the end of December, as stricter lockdown measures were put in place in response to continued rising case numbers and as vaccination proceeded, it remained unclear at what rate new infections would decline and what impact that would have on industrial and other product prices in 2021. As of December 31st, 2020, COVID-19 had resulted in the deaths of more than 1,800,000 people worldwide, and over 15,000 in Canada (Government of Canada, 2020a; WHO, 2020, December 31).
3 Industrial product prices decreased in 2020, led mainly by lower prices for energy and petroleum products
Prices for products manufactured in Canada, as measured by the Industrial Product Price Index (IPPI), fell 0.5% between 2019 and 2020. This followed a slight decrease of 0.1% in 2019, and was its largest annual decrease since 2015 (-0.8%). Among the 21 major commodity groups covered by the IPPI, 7 were down and 14 were up.
Energy and petroleum products often have the largest influence on the change in the IPPI, due to their high relative importance and volatility. In 2020, 6 of the 12 monthly changes in the IPPI were driven primarily by this group.
Excluding energy and petroleum products, the IPPI grew 2.7% in 2020, continuing an upward trend observed since 2006.
Beginning in March, the IPPI was driven downward as a result of the pandemic and associated lockdowns. Between February and April, the IPPI dropped 3.0%, led by reductions in prices for energy and petroleum products, which decreased dramatically largely as a result of reduced demand due to economic contraction and reduced travel (U.S. Energy Information Administration, 2020, July 20). The IPPI began to recover starting in May with the lifting of restrictions, increasing 4.9% between from its low in April to December 2020. This increase was driven primarily by rises in prices for lumber and other wood products and energy and petroleum products, as well as primary non-ferrous metal products and meat, fish, and dairy products.
Excluding energy and petroleum products, the IPPI increased fairly steadily over the course of 2020, with the exception of decreases of 0.8% in June and 0.9% in November. June’s decline was led by lower prices that month for meat, fish, and dairy products, and motorized and recreational vehicles, while November’s was led by lower prices for lumber and other wood products. The overall increasing trend in the IPPI with energy and petroleum products excluded was driven mainly by prices for primary non-ferrous metal products, lumber and other wood products, and meat, fish, and dairy products.
Prices of raw materials purchased by manufacturers operating in Canada, as measured by the Raw Materials Price Index (RMPI; -8.1%), decreased as well in 2020, mostly due to lower prices for crude energy products.

Data table for Chart 1
| Year and month | Industrial product price index | Industrial product price index, excluding energy and petroleum products |
|---|---|---|
| index (January 2020=100) | ||
| 2019 | ||
| January | 99.1 | 99.8 |
| February | 99.4 | 99.6 |
| March | 100.6 | 100.1 |
| April | 101.5 | 100.4 |
| May | 101.4 | 100.2 |
| June | 99.9 | 99.6 |
| July | 99.6 | 99.0 |
| August | 99.8 | 99.7 |
| September | 99.7 | 99.5 |
| October | 99.7 | 99.4 |
| November | 99.8 | 99.4 |
| December | 100.0 | 99.7 |
| 2020 | ||
| January | 100.0 | 100.0 |
| February | 100.0 | 100.6 |
| March | 98.9 | 101.7 |
| April | 97.0 | 101.7 |
| May | 97.9 | 102.2 |
| June | 98.0 | 101.4 |
| July | 99.1 | 101.9 |
| August | 100.1 | 103.1 |
| September | 100.8 | 104.3 |
| October | 100.8 | 104.3 |
| November | 100.3 | 103.4 |
| December | 101.8 | 104.3 |
|
Notes: Dotted lines Dec. 2019, WHO hears of atypical pneumonia cases in China. Jan. 2020, Canada has first presumptive case. Mar. 2020, All provinces have state of emergency. May 2020, Restrictions start to lift in many provinces. Sept. 2020, Second wave declared. Source: Statistics Canada, Table 18-10-0265-01. |
||
3.1 Prices for energy and petroleum products decline dramatically
Prices for energy and petroleum products declined 27.5% in 2020, primarily as a result of decreased demand due to the COVID-19 pandemic, their largest annual decline since 2009 (-28.1%). The decline in this commodity group was mainly due to an unprecedented decrease in prices for refined petroleum products (-29.0%), including motor gasoline (-25.9%), light fuel oils (-33.8%), and diesel and biodiesel fuels (-30.3%). This was the largest annual decrease in motor gasoline prices since the start of the series in 1971, and the largest in light fuel oils and diesel and biodiesel fuels since 2009. Prices for crude energy products (-31.7%), the raw material used for the production of refined petroleum products, also declined markedly in 2020; in a dramatic single-day example, on April 20th, West Texas Intermediate, one of the main global oil benchmarks, settled at an unprecedented low of -$37.63 USD/bbl for the May futures contract (Ngai, Raimonde, & Longley, 2020).

Data table for Chart 2
| Year and month | Energy and petroleum products | Crude energy products |
|---|---|---|
| index (January 2020=100) | ||
| 2019 | ||
| January | 95.7 | 98.3 |
| February | 98.7 | 104.0 |
| March | 105.2 | 109.5 |
| April | 109.6 | 120.0 |
| May | 110.4 | 114.9 |
| June | 102.8 | 101.6 |
| July | 104.0 | 105.6 |
| August | 101.0 | 101.1 |
| September | 101.5 | 103.8 |
| October | 102.7 | 98.5 |
| November | 102.9 | 101.9 |
| December | 103.2 | 107.3 |
| 2020 | ||
| January | 100.0 | 100.0 |
| February | 94.1 | 90.8 |
| March | 75.0 | 57.9 |
| April | 56.0 | 30.4 |
| May | 59.8 | 58.7 |
| June | 69.1 | 71.2 |
| July | 74.4 | 75.7 |
| August | 74.3 | 77.6 |
| September | 70.3 | 72.8 |
| October | 70.7 | 73.0 |
| November | 73.4 | 74.9 |
| December | 80.0 | 82.4 |
|
Notes: Dotted lines Dec. 2019, WHO hears of atypical pneumonia cases in China. Jan. 2020, Canada has first presumptive case. Mar. 2020, All provinces have state of emergency. May 2020, Restrictions start to lift in many provinces. Sept. 2020, Second wave declared. Source: Statistics Canada, Tables 18-10-0265-01 and 18-10-0268-01. |
||
Prices for refined petroleum products sharply declined between January and April (-48.6%) as a result of economic contraction due to decreased demand caused by the COVID-19 pandemic (U.S. Energy Information Administration, 2020, May 11). Reduced economic growth and limitations on air and other travel resulted in oversupply of oil, which drove down prices (U.S. Energy Information Administration, 2020, May 11). April’s month-over-month decline (-28.8%) was the largest on record for this product group; the energy and petroleum products (-25.3%) as a whole, as well as those of motor gasoline (-33.9%), light fuel oils (-23.5%), and diesel and biodiesel fuels (-23.3%) also posted record month-over-month declines in April. Beginning in May, an agreement by the Organization of the Petroleum Exporting Countries (OPEC) and other, non-OPEC oil-producing countries to cut production by 9.7 million barrels per day for at least two months (OPEC, 2020, April 9), combined with gradual easing of lockdowns and resumption of economic activities (U.S. Energy Information Administration, 2020, June 9), resulted in partial recovery of both crude and refined energy product prices, though not to 2019 levels. Cuts were scaled back in August 2020 and January 2021, but as of the end of 2020, were expected to continue until the end of April 2022, as outlined in the initial agreement (OPEC, 2020, April 9; OPEC, 2020, June 22; OPEC, 2020, December 3).

Data table for Chart 3
| Year and month | Total world petroleum supply | Total world petroleum consumption |
|---|---|---|
| million barrels per day | ||
| 2019 | ||
| January | 100.4 | 99.6 |
| February | 100.2 | 101.5 |
| March | 100.3 | 99.8 |
| April | 100.5 | 100.9 |
| May | 100.2 | 100.3 |
| June | 100.5 | 101.3 |
| July | 99.9 | 102.4 |
| August | 101.2 | 102.4 |
| September | 99.2 | 101.5 |
| October | 101.3 | 100.8 |
| November | 102.0 | 101.9 |
| December | 101.7 | 102.3 |
| 2020 | ||
| January | 101.4 | 96.7 |
| February | 100.2 | 97.6 |
| March | 100.5 | 91.3 |
| April | 100.3 | 80.6 |
| May | 88.6 | 84.4 |
| June | 88.6 | 89.9 |
| July | 90.2 | 92.8 |
| August | 91.3 | 92.5 |
| September | 91.1 | 94.7 |
| October | 91.6 | 94.8 |
| November | 93.5 | 95.7 |
| December | 93.8 | 95.6 |
|
Notes: Dotted lines Dec. 2019, WHO hears of atypical pneumonia cases in China. Jan. 2020, Canada has first presumptive case. Mar. 2020, All provinces have state of emergency. May 2020, Restrictions start to lift in many provinces. Sept. 2020, Second wave declared. Source: U.S. Energy Information Administration, 2021, January 12. |
||
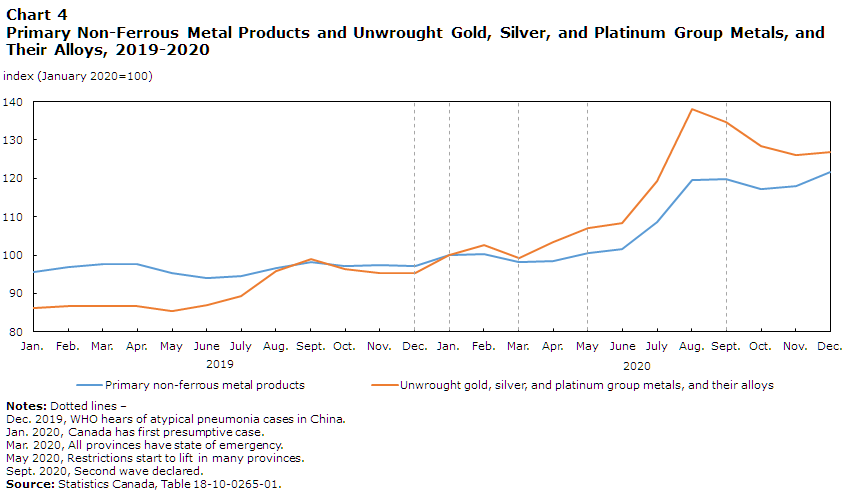
3.2 Primary non-ferrous metal products increase, driven largely by investment in safe havens such as gold and silver
Prices for primary non-ferrous metals increased by 12.6% in 2020, driven largely by increasing prices for unwrought gold, silver, and platinum group metals, and their alloys (+28.0%). This was the largest annual increase in unwrought gold, silver, and platinum group metals, and their alloys since 2011 (+50.1%).
3.2.1 Unwrought gold, silver, and platinum group metals, and their alloys
Prices for unwrought gold, silver, and platinum group metals, and their alloys were up 28.0% over the course of 2020, following a 7.6% increase in 2019, and posted their largest ever month-over-month increase in August (+15.9%). The global macroeconomic pessimism that drove investors to investments regarded as safe havens, such as gold, in 2019, was intensified in 2020, primarily due to the economic uncertainty caused by the COVID-19 pandemic (London Bullion Market Association, 2020, October 7). Prices for these metals rose to multi-year highs in 2020, with gold reaching $2061.50 USD per troy ounce on August 7th, and silver reaching $28.89 USD per ounce September 1st (London Bullion Market Association, 2020). Prices began to decline in the fall due to improving economic conditions (Baffes and Koh, 2020).
Data table for Chart 4
| Year and month | Primary non-ferrous metal products | Unwrought gold, silver, and platinum group metals, and their alloys |
|---|---|---|
| index (January 2020=100) |
||
| 2019 | ||
| January | 95.6 | 86.1 |
| February | 96.8 | 86.8 |
| March | 97.7 | 86.8 |
| April | 97.6 | 86.6 |
| May | 95.2 | 85.5 |
| June | 94.0 | 86.9 |
| July | 94.6 | 89.2 |
| August | 96.6 | 95.8 |
| September | 98.3 | 99.0 |
| October | 97.1 | 96.4 |
| November | 97.4 | 95.3 |
| December | 97.2 | 95.3 |
| 2020 | ||
| January | 100.0 | 100.0 |
| February | 100.2 | 102.7 |
| March | 98.3 | 99.3 |
| April | 98.4 | 103.3 |
| May | 100.5 | 107.0 |
| June | 101.6 | 108.4 |
| July | 108.6 | 119.2 |
| August | 119.5 | 138.1 |
| September | 119.7 | 134.8 |
| October | 117.3 | 128.5 |
| November | 118.0 | 126.2 |
| December | 121.6 | 126.8 |
|
Notes: Dotted lines Dec. 2019, WHO hears of atypical pneumonia cases in China. Jan. 2020, Canada has first presumptive case. Mar. 2020, All provinces have state of emergency. May 2020, Restrictions start to lift in many provinces. Sept. 2020, Second wave declared. Source: Statistics Canada, Table 18-10-0265-01. |
||
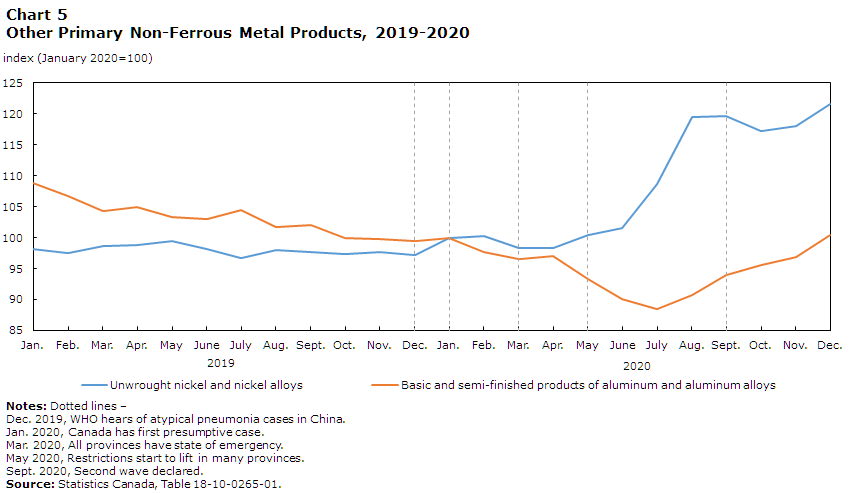
3.2.2 Other contributors to primary non-ferrous metals
Also contributing to the increase in the price of primary non-ferrous metals, though to a much lesser extent, were prices for unwrought nickel and nickel alloys (+10.9%), supported by strong demand from the stainless steel industry – especially in China – as well as consistent growth in demand from the electric vehicle industry (Home, 2020; Treadgold, 2020).
Counterbalancing these gains, prices for basic and semi-finished products of aluminum and aluminum alloys (-7.9%) decreased in 2020. Prices for these products decreased at the start of the year with the onset of the COVID-19 pandemic and slowdown of global manufacturing activity; despite increases in the latter half of the year as activity resumed, prices had not recovered to 2019 levels by the end of the year (Horner, 2020).
Data table for Chart 5
| Year and month | Unwrought nickel and nickel alloys | Basic and semi-finished products of aluminum and aluminum alloys |
|---|---|---|
| index (January 2020=100) | ||
| 2019 | ||
| January | 98.2 | 108.8 |
| February | 97.5 | 106.7 |
| March | 98.7 | 104.3 |
| April | 98.8 | 105.0 |
| May | 99.4 | 103.3 |
| June | 98.1 | 103.0 |
| July | 96.7 | 104.5 |
| August | 98.0 | 101.7 |
| September | 97.7 | 102.1 |
| October | 97.4 | 100.0 |
| November | 97.7 | 99.8 |
| December | 97.2 | 99.5 |
| 2020 | ||
| January | 100.0 | 100.0 |
| February | 100.2 | 97.7 |
| March | 98.3 | 96.5 |
| April | 98.4 | 97.1 |
| May | 100.5 | 93.3 |
| June | 101.6 | 90.0 |
| July | 108.6 | 88.5 |
| August | 119.5 | 90.7 |
| September | 119.7 | 94.0 |
| October | 117.3 | 95.5 |
| November | 118.0 | 96.9 |
| December | 121.6 | 100.5 |
|
Notes: Dotted lines Dec. 2019, WHO hears of atypical pneumonia cases in China. Jan. 2020, Canada has first presumptive case. Mar. 2020, All provinces have state of emergency. May 2020, Restrictions start to lift in many provinces. Sept. 2020, Second wave declared. Source: Statistics Canada, Table 18-10-0265-01. |
||
3.3 Prices for lumber and other wood products increase with heightened residential construction and renovation
Prices for lumber and other wood products increased 19.3% in 2020, driven mainly by a 38.2% increase in the price softwood lumber. This was the largest annual increase in softwood lumber since 1993 (+42.0%). From its lowest point of the year in April to its peak in September, the price of softwood lumber increased 95.6%, posting increases of 22.5% in July, 23.3% in August, and 20.4% in September, the three largest month-over-month increases since the beginning of the series in 1956.
The increase in softwood lumber was partially attributable to an unanticipated rise in demand beginning in May, as more time spent at home increased demand for housing and lockdowns eased so that residential construction was able to resume in both Canada and the U.S. (Verma & Husain, 2020). Approximately 68% of Canada’s forests products are exported to the U.S., mostly for residential home framing, while Canadian buyers account for just 10% of sales, making the U.S. the #1 destination for Canadian forest products, with a value of CAD $22B in 2019 (Kosman, 2020, November 19; Natural Resources Canada, 2020). Overall, U.S. total housing starts were up 7.9% in 2020 compared to 2019, while Canadian total housing starts were up 5.1% (Federal Reserve Bank of St. Louis, 2020; Canada Mortgage and Housing Corporation, 2021).
High prices for softwood lumber in 2020 were also influenced by an increase in improvement projects undertaken by homeowners during the summer months, as continued work-from-home orders and travel restrictions kept people at home and increased desire and need for home renovations (Clark, 2020; Verma & Husain, 2020). At the same time, softwood lumber production was decreased from 2019, causing even more supply pressure; Canadian softwood manufacturing volumes totalled 17,085 mfbm between January and September 2020, down 7% compared to the same period in 2019 (Kosman, 2020, December 9). The price of softwood lumber declined 23.5% from its high in September to November, responding to decreased demand as buyers stalled in anticipation of usual fall and winter construction slowdowns and concomitant price decreases; as construction activity continued into December, however, buyers were forced to accept prices as they were, increasing demand and prices, once again, in the last month of the year (Kosman, 2020, November 19).
The high demand for finished lumber during the summer months also drove up prices for raw logs and bolts, which increased 11.2% from July to December, after decreasing 7.2% from January to July due to mill closures that limited lumber production capacity (Stewart, 2020). Despite these gains in the latter part of the year, prices for logs and bolts were down 4.6% in 2020 compared to 2019.

Data table for Chart 6
| Year and month | Lumber and other wood products | Softwood lumber (except tongue and groove and other edge worked lumber) |
|---|---|---|
| index (January 2020=100) |
||
| 2019 | ||
| January | 101.6 | 94.9 |
| February | 101.1 | 100.6 |
| March | 102.0 | 100.6 |
| April | 101.4 | 96.2 |
| May | 100.1 | 93.1 |
| June | 100.5 | 94.2 |
| July | 101.5 | 96.9 |
| August | 101.5 | 94.8 |
| September | 100.8 | 96.8 |
| October | 100.7 | 97.0 |
| November | 100.8 | 99.5 |
| December | 100.8 | 99.4 |
| 2020 | ||
| January | 100.0 | 100.0 |
| February | 105.0 | 107.8 |
| March | 107.5 | 109.3 |
| April | 102.3 | 98.9 |
| May | 103.0 | 100.6 |
| June | 106.1 | 106.3 |
| July | 118.7 | 130.2 |
| August | 133.1 | 160.6 |
| September | 149.2 | 193.4 |
| October | 144.5 | 176.0 |
| November | 131.8 | 148.0 |
| December | 145.2 | 177.7 |
|
Notes: Dotted lines Dec. 2019, WHO hears of atypical pneumonia cases in China. Jan. 2020, Canada has first presumptive case. Mar. 2020, All provinces have state of emergency. May 2020, Restrictions start to lift in many provinces. Sept. 2020, Second wave declared. Source: Statistics Canada, Table 18-10-0265-01. |
||
3.4 Meat, fish and dairy products prices highly variable in 2020
Prices for meat, fish, and dairy products were 5.6% higher in 2020 compared to 2019, driven primarily by higher prices for fresh and frozen beef and veal (+18.1%).
3.4.1 Fresh and frozen beef and veal
The price of fresh and frozen beef and veal was 18.1% higher, on average, in 2020 than 2019, resulting largely from a 43.6% increase between March and May. This was the largest annual increase in fresh and frozen beef and veal prices since 2015 (+18.1%); in addition, April’s (+32.5%) month-over-month increase was the largest on record for this series. Higher prices during the March to May period were driven largely by reduced supply due to slaughterhouse and processing plant closures due to COVID-19 lockdowns (Patrice & Lamboni, 2020). Prices decreased 34.4% from May to July as plants reopened, ending 2.7% lower in December than they had begun the year. Countering April’s record increase, July’s (-26.7%) month-over-month change was the largest decrease ever for this series. Processing backlogs in both Canada and the U.S. kept prices for live cattle and calves (-2.7%) down in 2020 when compared to 2019 (Patrice & Lamboni, 2020).

Data table for Chart 7
| Year and month | Meat, fish and dairy products | Fresh and frozen beef and veal |
|---|---|---|
| index (January 2020=100) |
||
| 2019 | ||
| January | 95.2 | 96.6 |
| February | 94.5 | 95.3 |
| March | 95.7 | 97.1 |
| April | 98.7 | 99.6 |
| May | 99.6 | 100.7 |
| June | 99.3 | 96.9 |
| July | 97.4 | 93.7 |
| August | 100.1 | 96.1 |
| September | 96.6 | 94.0 |
| October | 96.3 | 95.1 |
| November | 97.4 | 102.6 |
| December | 99.5 | 102.0 |
| 2020 | ||
| January | 100.0 | 100.0 |
| February | 99.9 | 102.5 |
| March | 101.7 | 109.6 |
| April | 107.0 | 145.2 |
| May | 114.0 | 157.4 |
| June | 108.3 | 141.0 |
| July | 101.5 | 103.3 |
| August | 101.7 | 105.0 |
| September | 102.8 | 106.4 |
| October | 101.9 | 103.8 |
| November | 100.3 | 109.7 |
| December | 97.0 | 97.3 |
|
Notes: Dotted lines Dec. 2019, WHO hears of atypical pneumonia cases in China. Jan. 2020, Canada has first presumptive case. Mar. 2020, All provinces have state of emergency. May 2020, Restrictions start to lift in many provinces. Sept. 2020, Second wave declared. Source: Statistics Canada, Table 18-10-0265-01. |
||
3.4.2 Other contributors to meat, fish, and dairy products
Higher prices for processed meat, other meats, and animal by-products (+10.2%) and, to a lesser extent, fresh and frozen poultry of all types (+3.5%) also contributed to the increase in meat, fish, and dairy product prices.
While prices for processed meat, other meats, and animal by-products increased fairly steadily, those for fresh and frozen poultry experienced notable variations.
Fresh and frozen poultry prices declined 15.6% from March to May, largely as a result of reduced demand from the food service industry (Lupescu, 2020). Canadian producers responded by cutting production by 50,000 metric tonnes during the May to August period; processing backlogs were also generally avoided by diverting poultry to open facilities (Lupescu, 2020). Prices increased 21.5% from their low in May to July, supported by these measures and responding to increasing demand as lockdowns eased and the summer barbeque season began (Lupescu, 2020). Prices began to decline once again starting in August as production resumed, ending 2.7% lower in December than they had begun the year (Agriculture and Agri-Food Canada, Production Report 036).

Data table for Chart 8
| Year and month | Processed meat products, other meats, and animal by-products | Fresh and frozen poultry of all types |
|---|---|---|
| index (January 2020=100) |
||
| 2019 | ||
| January | 98.3 | 93.5 |
| February | 97.6 | 94.6 |
| March | 97.2 | 94.4 |
| April | 96.8 | 95.8 |
| May | 96.2 | 96.9 |
| June | 98.0 | 98.3 |
| July | 98.6 | 99.0 |
| August | 101.8 | 99.1 |
| September | 98.1 | 98.4 |
| October | 100.2 | 96.5 |
| November | 99.2 | 94.7 |
| December | 98.2 | 94.1 |
| 2020 | ||
| January | 100.0 | 100.0 |
| February | 103.4 | 102.6 |
| March | 103.8 | 104.4 |
| April | 102.1 | 95.7 |
| May | 110.3 | 88.1 |
| June | 109.0 | 99.7 |
| July | 108.2 | 107.0 |
| August | 110.9 | 106.9 |
| September | 111.5 | 103.9 |
| October | 112.7 | 97.4 |
| November | 114.0 | 95.3 |
| December | 114.3 | 95.2 |
|
Notes: Dotted lines Dec. 2019, WHO hears of atypical pneumonia cases in China. Jan. 2020, Canada has first presumptive case. Mar. 2020, All provinces have state of emergency. May 2020, Restrictions start to lift in many provinces. Sept. 2020, Second wave declared. Source: Statistics Canada, Table 18-10-0265-01. |
||
3.5 Other influences in 2020
Prices for pulp and paper products, chemicals and chemical products, and fruits, vegetables, feed, and other food products also influenced the IPPI movement in 2020, but to a lesser extent.
Prices for pulp and paper products declined in 2020, by 4.4%.
Chemical and chemical product prices reduced 2.6% in 2020, mainly due to the influence of lower prices for petrochemicals (-15.9%), down due to lower crude oil prices.
Prices for fruits, vegetables, feed, and other food products (+2.7%) were up in 2020, led by increases in grain and oilseed products, n.e.c. (+6.5%). Strong demand from China, as well as concerns about production and supply played a part in these price gains (Producteurs de grains du Québec, 2020). Prices for crop products, including grains (except wheat; +1.7%), oilseeds (except canola; +10.6%, wheat (+2.5%), and canola (including rapeseed; +8.7%) also increased over the course of 2020.
Appendix
The Industrial Product Price Index (IPPI) measures price changes for major commodities sold by manufacturers operating in Canada (Statistics Canada, 2020, December 10).
Each month, about 3,600 price quotes, from about 1,100 producers, are used in the calculation of the IPPI. The prices collected are for goods sold at the factory gate. As a result, the prices covered by the IPPI refer not to what a purchaser pays, but to what the producer receives. They exclude all indirect taxes, such as sales taxes and tariffs as this money does not go to the factors of production (i.e. labour, capital, or profit). They also exclude any transportation service performed by a common carrier beyond the factory gate and any distribution services performed by the retail or wholesale trade industries.
The Raw Materials Price Index (RMPI) measures price changes for raw materials purchased for further processing by manufacturers operating in Canada. As a purchasers' price index, prices include all charges purchasers incur to bring a commodity to the establishment gate. They include transportation charges, net taxes paid, custom duties, as well as subsidies, if applicable. The RMPI is produced and published together with the IPPI as it meets many of the same interest and needs (Statistics Canada, 2020, November 27).
Goods in both the IPPI and RMPI are aggregated hierarchically into groups based on the North American Product Classification System (NAPCS) 2017 v2. For example, ‘motor gasoline’ is a component of ‘refined petroleum energy products, and biofuels’, which is a component of ‘energy and petroleum products’, which is one of the 21 major groups in the IPPI. An index value and percent change is calculated for each one of these levels.
Each good and group has a weight (also referred to as ‘relative importance’) based on the value of the total sales of that good by domestic manufacturers in a specific reference year. Groups contain the sum of the weights of the goods contained therein. A good or group with a higher weight will affect the index proportionally based on its weight. Therefore a large price movement from a lower weighted group can have less impact than a very small movement from a higher weighted group. For the IPPI and RMPI, commodity and industry weights are derived from a combination of the 2016 Supply and Use Tables that closely reflect actual economic transactions by industry and the sales of goods manufactured by companies as reported for the 2016 Annual Survey of Manufacturers and Logging (ASML).
Typically, the IPPI and RMPI are measured and published monthly. For the purposes of the year to year comparisons included in this analytical paper, the annual average index values have been calculated, and comparisons done between averages.
The current time base for both indexes is January 2020=100.
References
Agriculture and Agri-Food Canada. Production Report 036: Poultry Production Report by Month/Year. Poultry and Egg Market Information: Poultry and Egg Production. https://aimis-simia.agr.gc.ca/rp/index-eng.cfm?action=pR&r=24&pdctc=
Baffes, J. & Koh, W. C. (2020, December 28). Precious Metals Prices Expected to be Lower in 2021. World Bank Blogs. https://blogs.worldbank.org/opendata/precious-metal-prices-expected-be-lower-2021
Canada Mortgage and Housing Corporation. (2021, January). Monthly Housing Starts and Other Construction Data. Housing Market Information. https://assets.cmhc-schl.gc.ca/sites/cmhc/data-research/publications-reports/preliminary-housing-starts-data/2021/monthly-housing-starts-construction-data-64695-2021-m01.pdf
Clark, J. (2020, August 24). How Does a Soaring Lumber Market Impact Timber Prices? Forest 2 Market. https:/www.forest2market.com/blog/how-does-a-soaring-lumber-market-impact-timber-prices
Federal Reserve Bank of St. Louis. (2020, November 18). Housing Starts: Total: Privately Owned Housing Units Started. FRED Economic Data: Production and Business Activity: Housing: Housing Starts. https://fred.stlouisfed.org/series/HOUST#0
Gellatly, G. (2020, May 26). Recent Developments in the Canadian Economy, 2020: COVID-19, first edition. Economic Insights. https://www150.statcan.gc.ca/n1/pub/11-626-x/11-626-x2020002-eng.htm
Gillies, R. (2020, December 14). Canada Administers First Doses of COVID-19 vaccine. AP. https://apnews.com/article/toronto-ontario-health-coronavirus-pandemic-quebec-b5e7c334cb00663b4566f02a0eba3071
Government of Canada. (2020, December 16a). Coronavirus disease 2019 (COVID-19): Epidemiology Update. Coronavirus Disease: For Health Professionals. https://health-infobase.canada.ca/covid-19/epidemiological-summary-covid-19-cases.html?stat=num&measure=total#a2
Government of Canada. (2020, December 16b). Pfizer-BioNTech COVID-19 Vaccine: What You Should Know. Coronavirus Disease: COVID-19 Health Product Industry: COVID-19 Drugs and Vaccines: COVID-19 Vaccines. https://www.canada.ca/en/health-canada/services/drugs-health-products/covid19-industry/drugs-vaccines-treatments/vaccines/pfizer-biontech.html
Home, A. (2020, October 27). Nickel Surplus Loom as Electric Vehicle Buzz Fades. Reuters. www.reuters.com/article/us-metals-nickel-electric-ahome-column/column-nicle-surplus-looms-as-electric-vehicle-buzz-fades-andy-home-idUSKBN27C291
Horner, W. (2020, October 20). Aluminum Prices Surge as Chinese Demand Accelerates. Wall Street Journal. www.wsj.com/articles/aluminum-prices-surge-as-chinese-demand-accelerates-11603200739
Kirkey, S. (2020, October 30). Second Wave Will Be “Weeks and Months” of Limiting Contacts, But Trudeau Says “Blunt” Lockdowns Unnecessary. The National Post. https://nationalpost.com/news/canada/second-wave-will-be-weeks-and-months-of-limiting-contacts-but-trudeau-says-blunt-nationwide-lockdowns-unnecessary
Kosman, K. (2020, November 19). U.S. Housing Starts & Softwood Lumber Prices: October and November 2020. Madison’s Lumber Reporter. www.madisonsreport.com/2020/11/19/us-housing-starts-softwood-lumber-prices-october-and-november-2020/
Kosman, K. (2020, December 9). North America Softwood Lumber Production, Sawmill Capacity Utilization, WWPA: September 2020. Madison’s Lumber Reporter. https://madisonsreport.com/2020/12/09/north-america-softwood-lumber-production-sawmill-capacity-utilization-wwpa-september-2020/
Lafrance-Cooke, A., Macdonald, R., & Willox, M. (2020, August 5). Monthly Business Openings and Closures: Experimental Series for Canada, the Provinces and Territories, and Census Metropolitan Areas. Economic Insights. https://www150.statcan.gc.ca/n1/pub/11-626-x/11-626-x2020014-eng.htm
London Bullion Market Association. (2020). Precious Metal Prices. LBMA Prices and Data.http://www.lbma.org.uk/precious-metal-prices#/
London Bullion Market Association. (2020, October 7). Q3 2020 Precious Metals Report – The End of a Long Hot Summer? LBMA Media Centre. www.lbma.org.uk/_blog/lbma_media_centre/post/q3-2020-precious-metals-report---the-end-of-a-long-hot-summer/
Lupescu, M. (2020, June 2). Canada: COVID-19 Impact on Poultry Sector. United States Department of Agriculture: Foreign Agricultural Service. https://apps.fas.usda.gov/newgainapi/api/Report/DownloadReportByFileName?fileName=Canada%20-%20COVID-19%20Impact%20on%20Poultry%20Sector_Ottawa_Canada_05-28-2020
Natural Resources Canada. (2020, December 16). How does the forest sector contribute to Canada’s economy? State of Canada’s Forests Report 2020. https://www.nrcan.gc.ca/our-natural-resources/forests-forestry/state-canadas-forests-report/forest-industry-contribute/16517
Ngai, C., Raimonde, O., & Longley, A. (2020, April 19). Oil Plunges Below Zero for First Time in Unprecedented Wipeout. Bloomberg. https://www.bloomberg.com/news/articles/2020-04-19/oil-drops-to-18-year-low-on-global-demand-crunch-storage-woes
OPEC. (2020, April 9). The 9th (Extraordinary) OPEC and non-OPEC Ministerial Meeting Concludes. Press Releases 2020. https://www.opec.org/opec_web/en/press_room/5882.htm
OPEC. (2020, June 22). GECF and OPEC Hold First Technical Meeting VIA Videoconference. Press Releases 2020. www.opec.org/opec_web/en/press_room/6015.htm
OPEC. (2020, December 3). The 12th OPEC and non-OPEC Ministerial Meeting Concludes. Press Releases 2020. www.opec.org/opec_web/en/press_room/6257.htm
Patrice, T. & Lamboni, D. (2020, November 17). COVID-19 and the Beef Supply Chain: An Overview. COVID-19: A Data Perspective. www150.statccan.gc.ca/n1/pub/45-28-0001/2020001/article/00086-eng.htm
Producteurs de grains du Québec. (2020, October 23). Tendances des prix du maïs et du soya au Québec. Service d’information sur les marchés. https://www.pgq.ca/articles/services-dinformation-sur-les-marches/les-analyses/tendances-des-prix-du-mais-et-du-soya-au-quebec-octobre-2020/
Statistics Canada. (2020, April 8). Canadian Consumers Prepare for COVID-19. Prices Analytical Series. https://www150.statcan.gc.ca/n1/pub/62f0014m/62f0014m2020004-eng.htm
Statistics Canada. (2020, April 30). Industrial Product and Raw Materials Price Indexes, March 2020. The Daily. https://www150.statcan.gc.ca/n1/daily-quotidien/200430/dq200430b-eng.htm
Statistics Canada. (2020, May 29). Industrial Product and Raw Materials Price Indexes, April 2020. The Daily. https://www150.statcan.gc.ca/n1/daily-quotidien/200529/dq200529c-eng.htm
Statistics Canada. (2020, October 8). Adjusting the Consumer Price Index to the New Spending Realities During the Pandemic. The Daily. https://www150.statcan.gc.ca/n1/daily-quotidien/201008/dq201008a-eng.htm
Statistics Canada. (2020, November 27). Raw Materials Price Index (RMPI). Surveys and Statistical Programs. https://www23.statcan.gc.ca/imdb/p2SV.pl?Function=getSurvey&SDDS=2306
Statistics Canada. (2020, December 10). Industrial Product Price Index (IPPI). Surveys and Statistical Programs. https://www23.statcan.gc.ca/imdb/p2SV.pl?Function=getSurvey&SDDS=2318
Statistics Canada. (2020, December 11). Canadian Economic Dashboard and COVID-19. COVID-19: A Data Perspective. https://www150.statcan.gc.ca/n1/pub/71-607-x/71-607-x2020009-eng.htm
Statistics Canada. Table 18-10-0265-01: Industrial Product Price Index, By Major Product Group, Monthly. https://www150.statcan.gc.ca/t1/tbl1/en/tv.action?pid=1810026501
Statistics Canada. Table 18-10-0268-01: Raw Materials Price Index, Monthly. https://www150.statcan.gc.ca/t1/tbl1/en/tv.action?pid=1810026801
Statistics Canada. Table 33-10-0270-01: Experimental Estimates for Business Openings and Closures for Canada, the Provinces and Territories, Census Metropolitan Areas, Seasonally Adjusted. https://www150.statcan.gc.ca/t1/tbl1/en/tv.action?pid=3310027001
Stewart, P. (2020, August 18). Why Are Lumber Prices at Record Highs? Forest 2 Market. https://www.forest2market.com/blog/why-are-lumber-prices-at-record-highs?
Treadgold, T. (2020, June 4). Nickel Rush Restarts as Steel and Battery Demand Rises. Forbes.https://www.forbes.com/sites/timtreadgold/2020/06/04/nickel-rush-restarts-as-steel-and-battery-demand-rises/?sh=75c41abe28ab
U.S. Energy Information Administration. (2020, May 11). Short Term Energy Outlook, May 2020. Analysis and Projections. www.eia.gov/steo/archives/may20.pdf
U.S. Energy Information Administration. (2020, June 9). Short Term Energy Outlook, June 2020. Analysis and Projections. www.eia.gov/steo/archives/jun20.pdf
U.S. Energy Information Administration. (2020, July 20). EIA forecasts US petroleum demand will remain below 2019 levels for several more months. Today in Energy.www.eia.gov/todayinenergy/detail.php?id=44417
U.S. Energy Information Administration. (2021, January 12). Short Term Energy Outlook, January 2021, Table 3a. Analysis and Projections. www.eia.gov/steo/archives/jan21_base.xlsx
Verma, R. & Husain, R. (2020, October 5). The Resilience and Strength of the New Housing Market During the Pandemic. COVID-19: A Data Perspective. https://www150.statcan.gc.ca/n1/pub/45-28-0001/2020001/article/00080-eng.htm
WHO. (2020, July 31). Rolling Updates on Coronavirus Disease (COVID-19). Coronavirus Disease (COVID-19): Events As They Happen. https://www.who.int/emergencies/diseases/novel-coronavirus-2019/events-as-they-happen
WHO. (2020, December 31). Overview. WHO Coronavirus Disease (COVID-19) Dashboard. https://covid19.who.int/
- Date modified: