
Prices Analytical Series
Canadian Consumers Adapt to COVID-19: A Look at Canadian Grocery Sales up to April 11
Skip to text
Text begins
In the weeks since the release of the Statistics Canada study Canadian Consumers Prepare for COVID-19, which analyzed trends in consumer demand and sales up to the week ending March 14, 2020, Canadians have been adapting to a new normal. With many stores and service providers closed or operating with reduced hours, classrooms moved online, a newly defined workforce made up of essential workers and those able to work from home, and millions of Canadians experiencing lost hours of work or layoffs as a result of the pandemicNote , life at home has taken on a new definition. The way Canadians are making purchases at grocery stores can provide some insight into the way they are sustaining themselves and their families, and spending their time at home.
Sales continue upward trend after exceptional March surge
Whether Canadians were simply restocking depleted pantries, preparing to shop less frequently and reduce their exposure to COVID-19, or truly panic buying, grocery store sales surged in March 2020 (Chart 1).

Data table for Chart 1
| All products sold at grocery stores | |
|---|---|
| 52-week % change | |
| 2019 | |
| January | |
| Week 1 | 4 |
| Week 2 | -1 |
| Week 3 | 0 |
| Week 4 | -2 |
| Feburary | |
| Week 1 | 0 |
| Week 2 | -1 |
| Week 3 | -2 |
| Week 4 | 2 |
| March | |
| Week 1 | -1 |
| Week 2 | -1 |
| Week 3 | -1 |
| Week 4 | -3 |
| Week 5 | -12 |
| April | |
| Week 1 | 9 |
| Week 2 | 0 |
| Week 3 | 12 |
| Week 4 | -12 |
| May | |
| Week 1 | -1 |
| Week 2 | -2 |
| Week 3 | -3 |
| Week 4 | -3 |
| June | |
| Week 1 | -3 |
| Week 2 | -1 |
| Week 3 | -6 |
| Week 4 | -3 |
| Week 5 | -3 |
| July | |
| Week 1 | 1 |
| Week 2 | -2 |
| Week 3 | -1 |
| Week 4 | -1 |
| August | |
| Week 1 | 1 |
| Week 2 | 1 |
| Week 3Data table Note 1 | 0 |
| Week 4 | 1 |
| Week 5 | 1 |
| September | |
| Week 1 | 2 |
| Week 2 | 0 |
| Week 3 | -1 |
| Week 4 | 0 |
| October | |
| Week 1 | -8 |
| Week 2Data table Note 2 | 20 |
| Week 3 | -4 |
| Week 4 | -1 |
| November | |
| Week 1 | 0 |
| Week 2 | 2 |
| Week 3 | 1 |
| Week 4 | -10 |
| Week 5 | 1 |
| December | |
| Week 1 | 0 |
| Week 2 | -1 |
| Week 3 | -5 |
| Week 4 | 11 |
| 2020 | |
| January | |
| Week 1 | 4 |
| Week 2 | 4 |
| Week 3 | -3 |
| Week 4 | 5 |
| Febuary | |
| Week 1 | 2 |
| Week 2 | 2 |
| Week 3 | 2 |
| Week 4 | 0 |
| Week 5 | 5 |
| March | |
| Week 1 | 8 |
| Week 2Data table Note 3 Data table Note 6 | 46 |
| Week 3Data table Note 4 | 40 |
| Week 4Data table Note 5 | 12 |
| April | |
| Week 1 | 12 |
| Week 2 | 19 |
Source: Consumer Prices program, special tabulation. |
|
By the week ending March 21, nearly all provinces and territories had declared states of emergency due to COVID-19, and transborder restrictions and international travel bans were in effect. Canadian consumers continued to react and prepare in response to reduced access to businesses, goods and services, and increasing restrictions on their movement. Retail grocery sales that week rose 40% higher compared with the same week last year.Note
Following the March spike, grocery store receipts continued to rise, on a historical basis, over the next three weeks, with year-over-year sales rising 19% in the week ending April 11.
This study uses transaction data for grocery products to calculate a sales index consisting of a series of weekly sales divided by the average weekly sales of a reference period. A year-over-year percent change of weekly sales is calculated to provide a perspective on current consumption patterns relative to the same period last year. This measure is particularly useful when analyzing data series with known calendar effects. In the case of Easter this year, the comparison with Easter 2019 is calculated over 51 weeks instead of 52.
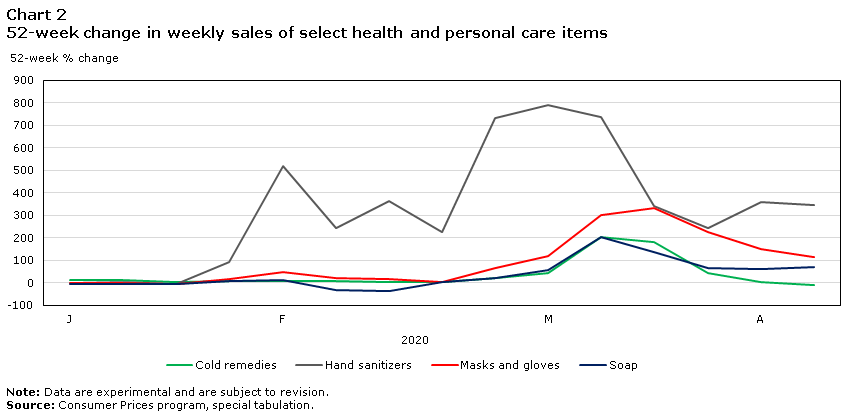
After considerable acceleration in March, purchases of many health and personal care items slowed over the following weeks.
In the first week of March, hand sanitizer sales rose 792% over the same week last year; by April 11 sales slowed to a still-impressive 345% increase, as demand for products to supplement or replace soap-and-water handwashing remained strong (Chart 2). Demand for hand sanitizer has been so high that the federal government has begun approving product licenses for non-traditional manufacturers such as distilleriesNote to produce it.Note
Data table for Chart 2
| 2020 | Cold remedies | Hand sanitizers | Masks and gloves | Soap |
|---|---|---|---|---|
| 52-week % change | ||||
| January | ||||
| Week 1 | 12 | -1 | -2 | -6 |
| Week 2 | 13 | 2 | -4 | -7 |
| Week 3 | 5 | -8 | -8 | -5 |
| Week 4 | 7 | 93 | 15 | 6 |
| Feburary | ||||
| Week 1 | 9 | 521 | 47 | 13 |
| Week 2 | 7 | 245 | 21 | -32 |
| Week 3 | 1 | 365 | 15 | -37 |
| Week 4 | 1 | 224 | 4 | 4 |
| Week 5 | 21 | 734 | 66 | 19 |
| March | ||||
| Week 1 | 42 | 792 | 116 | 58 |
| Week 2 | 204 | 735 | 301 | 204 |
| Week 3 | 181 | 340 | 334 | 135 |
| Week 4 | 42 | 244 | 227 | 64 |
| April | ||||
| Week 1 | 2 | 358 | 148 | 61 |
| Week 2 | -11 | 345 | 114 | 68 |
|
Note: Data are experimental and are subject to revision. Source: Consumer Prices program, special tabulation. |
||||
While sales for cold remedies (-11%) returned to pre-pandemic levels, sales for soap (+68%) and masks and gloves (+114%) remained high in the week ending April 11, relative to sales one year ago, though sales of the latter may have been affected by reported shortages.Note
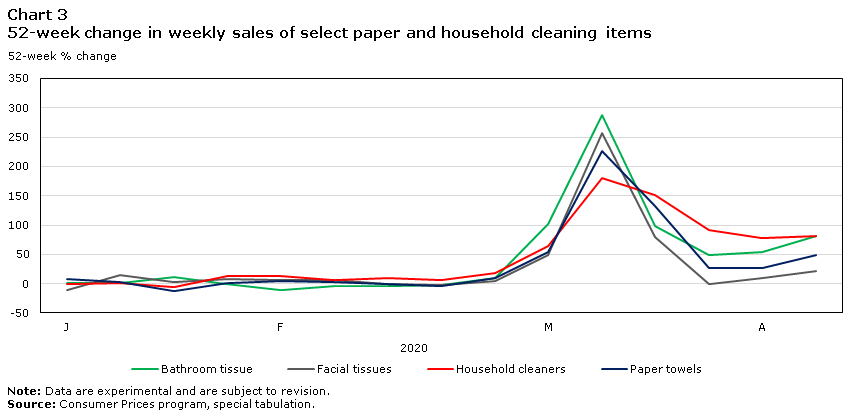
Sales for household paper products moderated in the first weeks of April but remained higher than those recorded a year ago (Chart 3). Bathroom tissue, which continued to captivate Canadians’ attention in the media, saw sales increase at a slower rate in April after reassurances from manufacturers that supply was not an issue,Note but remained high above historic levels in the week ending April 11, registering an 81% increase over the same week last year.
Data table for Chart 3
| 2020 | Bathroom tissue | Facial tissues | Household cleaners | Paper towels |
|---|---|---|---|---|
| 52-week % change | ||||
| January | ||||
| Week 1 | 1 | -11 | 0 | 8 |
| Week 2 | 2 | 14 | 0 | 3 |
| Week 3 | 11 | 3 | -6 | -12 |
| Week 4 | -1 | 7 | 13 | 1 |
| Feburary | ||||
| Week 1 | -10 | 6 | 12 | 5 |
| Week 2 | -5 | 5 | 6 | 3 |
| Week 3 | -5 | -1 | 9 | -1 |
| Week 4 | -2 | -2 | 6 | -4 |
| Week 5 | 10 | 5 | 18 | 9 |
| March | ||||
| Week 1 | 102 | 48 | 65 | 54 |
| Week 2 | 288 | 257 | 180 | 227 |
| Week 3 | 97 | 79 | 152 | 132 |
| Week 4 | 49 | -1 | 91 | 27 |
| April | ||||
| Week 1 | 54 | 10 | 77 | 26 |
| Week 2 | 81 | 22 | 81 | 49 |
|
Note: Data are experimental and are subject to revision. Source: Consumer Prices program, special tabulation. |
||||
By the week of April 11 Canadians’ purchases of many shelf-stable foods were at levels closer to those reported the year before, including purchases of rice which rose just 12% (Chart 4). Rice sales will continue to be of interest as global suppliers in Thailand, Vietnam and India stockpile and curb exportsNote despite high overall global supply.Note
In contrast to receipts from most other shelf-stable goods that surged in March, sales of infant formula fell 15% below totals for the same week in 2019.

Data table for Chart 4
| 2020 | Canned vegetables | Infant formula | Pasta | Rice |
|---|---|---|---|---|
| 52-week % change | ||||
| January | ||||
| Week 1 | -6 | 3 | -5 | 47 |
| Week 2 | 0 | 1 | 0 | 2 |
| Week 3 | -2 | -2 | -2 | -28 |
| Week 4 | ||||
| Feburary | 0 | 7 | 7 | 23 |
| Week 1 | -4 | 32 | -1 | 15 |
| Week 2 | 0 | 43 | 0 | -6 |
| Week 3 | -4 | 26 | -1 | -2 |
| Week 4 | -7 | 12 | -3 | 5 |
| Week 5 | 19 | 28 | 22 | 43 |
| March | ||||
| Week 1 | 33 | 32 | 37 | 107 |
| Week 2 | 165 | 121 | 193 | 284 |
| Week 3 | 152 | 74 | 165 | 161 |
| Week 4 | 62 | -2 | 70 | 52 |
| April | ||||
| Week 1 | 50 | -9 | 48 | 20 |
| Week 2 | 47 | -15 | 49 | 12 |
|
Note: Data are experimental and are subject to revision. Source: Consumer Prices program, special tabulation. |
||||
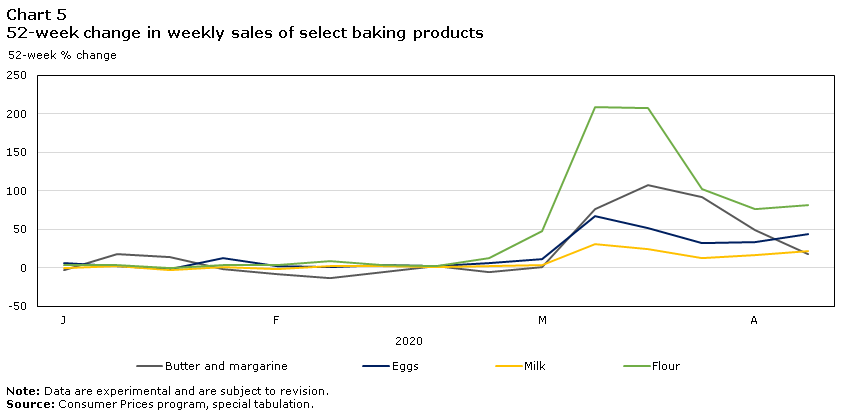
Amid stories of stress baking and sourdough starters,Note sales of flour continue to surpass those registered last year, rising above 200% year-over-year in March, and reaching 81% in the week ending April 11, compared to the same period a year ago (Chart 5). Increased year-over-year sales in other baking supplies such as butter and margarine (+18%), eggs (+44%) and milk (+21%) help round out the picture of the Canadian home baker’s supply list.
Data table for Chart 5
| 2020 | Butter and margarine | Eggs | Milk | Flour |
|---|---|---|---|---|
| 52-week % change | ||||
| January | ||||
| Week 1 | -4 | 6 | -1 | 3 |
| Week 2 | 18 | 2 | 3 | 4 |
| Week 3 | 14 | -2 | -3 | -1 |
| Week 4 | -2 | 12 | 1 | 3 |
| Feburary | ||||
| Week 1 | -8 | 2 | -1 | 3 |
| Week 2 | -13 | 1 | 2 | 8 |
| Week 3 | -6 | 3 | 2 | 4 |
| Week 4 | 2 | 2 | 0 | 3 |
| Week 5 | -6 | 6 | 2 | 13 |
| March | ||||
| Week 1 | 1 | 11 | 4 | 47 |
| Week 2 | 76 | 67 | 31 | 208 |
| Week 3 | 107 | 51 | 24 | 207 |
| Week 4 | 92 | 32 | 12 | 102 |
| April | ||||
| Week 1 | 48 | 34 | 16 | 76 |
| Week 2 | 18 | 44 | 21 | 81 |
|
Note: Data are experimental and are subject to revision. Source: Consumer Prices program, special tabulation. |
||||
Sharp cut in flower sales during the Easter season, but chocolate sales rival 2019
For some seasonal products, sales typically rise in the week leading up to Easter, including chocolate,Note flowers and traditional celebratory meats. In 2020, Easter celebrations were not derailed—sales of traditional holiday favourites in the week before Easter weekend were similar to sales in the week leading up to Easter 2019 (Chart 6). Sales of chocolate from grocery stores rose 1%, while a decline in sales of ham (-13%) was offset by an increase in sales of fresh and frozen turkey (+19%).

Data table for Chart 6
| 2020 | Chocolate | Fresh or frozen turkey | Ham |
|---|---|---|---|
| 51-week % change | |||
| January | |||
| Week 1 | -7 | 38 | 14 |
| Week 2 | -8 | -23 | -9 |
| Week 3 | 3 | 4 | 12 |
| Week 4 | -5 | 19 | 30 |
| Feburary | |||
| Week 1 | -6 | 11 | 33 |
| Week 2 | -33 | 0 | 6 |
| Week 3 | 60 | 8 | -31 |
| Week 4 | -5 | 0 | -27 |
| Week 5 | 1 | 1 | -21 |
| March | |||
| Week 1 | 3 | 34 | 4 |
| Week 2 | 16 | 70 | 72 |
| Week 3 | 32 | 66 | 64 |
| Week 4 | 14 | 44 | 22 |
| April | |||
| Week 1 | 16 | 16 | -12 |
| Week 2 | 1 | 19 | -13 |
|
Note: Data are experimental and are subject to revision. Source: Consumer Prices program, special tabulation. |
|||
While Canadian Easter traditions appear to have been observed amid physical distancing, there was still a notable impact on one product: Canadian sales of cut flowers in grocery stores fell 47% in the week leading up to Easter 2020 compared with the week leading up to Easter 2019 (Chart 7). While many Canadians celebrated Easter, they seem to have celebrated at home in small numbers, or virtually, while in-person exchanges of flowers were trimmed.Note

Data table for Chart 7
| 2020 | Cut flowers |
|---|---|
| 51-week % change | |
| March | |
| Week 1 | 6 |
| Week 2 | -3 |
| Week 3 | -33 |
| Week 4 | -50 |
| April | |
| Week 1 | -47 |
| Week 2 | -47 |
|
Note: Data are experimental and are subject to revision. Source: Consumer Prices program, special tabulation. |
|
Consumers adjust to staying at home for extended periods
Meanwhile, Canadians adjusted to physical distancing measures towards the end of March by spending more on other types of goods. In spite of increasing financial pressure on Canadians amid job losses and falling wages,Note sales rose for a number of products Canadians are turning to for diversion and comfort which may previously have been fulfilled outside their homes.
Most Canadian bars and restaurants were ordered to temporarily close in the later half of March.Note In provinces where beer and wine are available from grocery stores, Canadians purchased alcohol for home consumption at levels notably higher than in 2019 (Chart 8). At the same time, Canadians turned to home coffee brewing as access to coffee shops was limited, with sales of coffee filters increasing 68% in the week leading up to April 11 compared to the same period a year ago.

Data table for Chart 8
| 2020 | Alcohol | Coffee filters |
|---|---|---|
| 52-week % change | ||
| January | ||
| Week 1 | 9 | 10 |
| Week 2 | 4 | 15 |
| Week 3 | 2 | 8 |
| Week 4 | 9 | 14 |
| Feburary | ||
| Week 1 | 6 | 11 |
| Week 2 | 5 | 8 |
| Week 3 | 9 | 3 |
| Week 4 | 4 | -5 |
| Week 5 | 7 | 4 |
| March | ||
| Week 1 | 7 | 16 |
| Week 2 | 25 | 49 |
| Week 3 | 76 | 80 |
| Week 4 | 32 | 55 |
| April | ||
| Week 1 | 37 | 52 |
| Week 2 | 46 | 68 |
|
Note: Data are experimental and are subject to revision. Source: Consumer Prices program, special tabulation. |
||
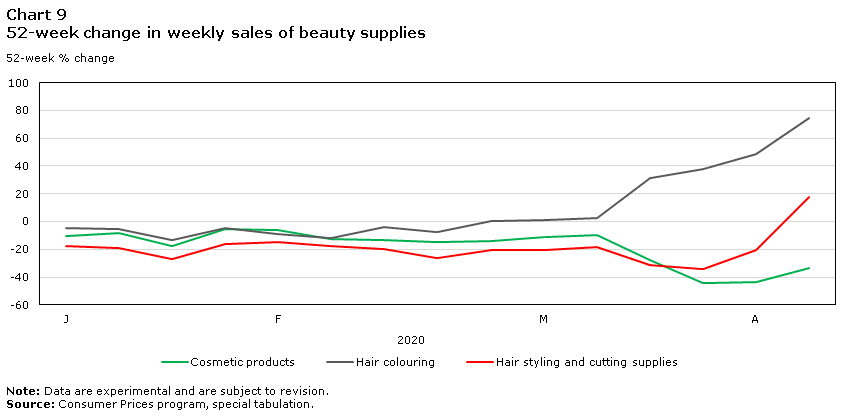
Walmart CEO Doug McMillon recently pointed to rising sales of hair dye as an example of consumer preferences evolving during the pandemic.Note Indeed, year-over-year growth in sales of hair colouring continued to 75% in the week ending April 11, as Canadians, faced with the closure of hair salons and barbershops, took personal grooming into their own hands (Chart 9).
In a surprising countertrend, Canadians were, on average, letting their hair grow and true complexions show—at least for a few weeks. Year-over-year, purchases of cosmetics dropped 44% and hair styling and cutting supplies fell 34% in the week ending March 28. Two weeks later, sales of hair styling and cutting supplies rose 17% and cosmetic products edged up slightly, although sales were still 33% lower than the same week in 2019.
Data table for Chart 9
| 2020 | Cosmetic products | Hair colouring | Hair styling and cutting supplies |
|---|---|---|---|
| 52-week % change | |||
| January | |||
| Week 1 | -11 | -5 | -18 |
| Week 2 | -9 | -6 | -19 |
| Week 3 | -18 | -14 | -27 |
| Week 4 | -5 | -4 | -17 |
| Feburary | |||
| Week 1 | -6 | -9 | -15 |
| Week 2 | -13 | -12 | -18 |
| Week 3 | -13 | -4 | -20 |
| Week 4 | -15 | -8 | -26 |
| Week 5 | -14 | 0 | -21 |
| March | |||
| Week 1 | -11 | 1 | -20 |
| Week 2 | -10 | 3 | -18 |
| Week 3 | -28 | 31 | -32 |
| Week 4 | -44 | 38 | -34 |
| April | |||
| Week 1 | -44 | 49 | -21 |
| Week 2 | -33 | 75 | 17 |
|
Note: Data are experimental and are subject to revision. Source: Consumer Prices program, special tabulation. |
|||
As Canadians were faced with the possibility of an extended stay-at-home order, sales of family planning products rose throughout the first few weeks of March (Chart 10). News reports from Malaysia suggest that a lockdown imposed in March would limit condom production as factories closed to limit the spread of COVID-19.Note While Canadians purchased more condoms at the outset of the pandemic, sales slowed in subsequent weeks to historic levels.

Data table for Chart 10
| 2020 | Condoms, contraceptives and lubricants | Pregnancy tests |
|---|---|---|
| 52-week % change | ||
| January | ||
| Week 1 | 0 | -1 |
| Week 2 | -3 | 1 |
| Week 3 | -5 | -9 |
| Week 4 | 1 | 4 |
| Feburary | ||
| Week 1 | 4 | 0 |
| Week 2 | -1 | -1 |
| Week 3 | 0 | 0 |
| Week 4 | 0 | -1 |
| Week 5 | -1 | 1 |
| March | ||
| Week 1 | 4 | 2 |
| Week 2 | 30 | 9 |
| Week 3 | 41 | 7 |
| Week 4 | -1 | -3 |
| April | ||
| Week 1 | 0 | 1 |
| Week 2 | 2 | 2 |
|
Note: Data are experimental and are subject to revision. Source: Consumer Prices program, special tabulation. |
||
As Canadian consumers adapt to staying at home, new behaviours and shopping habits are evolving to reflect the new reality.
Purchases at grocery stores spiked during the first three weeks of March, but stabilized by the end of the month as no shortages were anticipated. Seasonal sales of products related to Easter celebrations slowed in 2020 compared with 2019, and sales of certain goods including health and personal care items increased.
A work in progress
Over the next few weeks this study will be updated to incorporate more products of interest to the Canadian population. Statistics Canada’s ongoing work informing Canadians through data products such as this study and the Consumer Price Index will help to give context to uncertain economic times, and enable data users to make informed decisions.
- Date modified: