
Prices Analytical Series
E-commerce and the Consumer Price Index: Measuring Inflation in a Digital Economy
by Taylor Mitchell
Skip to text
Text begins
Introduction
The emergence of the digital economy in recent years has presented challenges to the measurement of official statistics. Evolving consumption patterns, such as the increasing popularity of online shoppingNote 1 and the rise of new consumer goods and services have required the Consumer Price Index (CPI) to adapt to maintain accuracy in measuring inflation dynamics. New goods and services are being incorporated into the CPI basket, and collection methods are being updated to mirror the evolving consumer behaviour of Canadians as e-commerce takes an increasingly large role in the retail landscape.
Much of the recent discussion and analysis of the digital economy have centred on e-commerce and the diverging pricing patterns of products available for online purchase. Cavallo (2018)Note 2 pointed to the high degree of price flexibility which characterizes online retailers and the subsequent tendency of online prices to move differently than in-store prices. While the stickinessNote 3 of in-store prices is a well-established economic phenomenon, online prices should, in theory, be able to adjust to the market clearing price more quickly in response to ever-changing market forces, including product shortages, exchange rate movements, higher input costs or other supply shocks. Further, online retailers are uniquely able to monitor demand in real time based on consumer behaviour on their websites, and are in a stronger position than traditional brick-and-mortar retailers to monitor the pricing behaviour of competitors. Using this information, online retailers can responsively optimize profits through the use of algorithmic pricingNote 4Note 5. Along with online marketplaces like Amazon, evidence of algorithmic pricing has also been observed in prices for airfares and travel services.
The use of algorithmic pricing, which can result in rapidly changing prices, may pose challenges in terms of the measurement of consumer price inflation. Because prices are collected on a monthly basis for most consumer goods and services, the CPI represents a monthly snapshot of price changes. Prices that rapidly change create considerable volatility over the reference month, which the Canadian CPI currently does not capture, but that is supported by consumer behaviour. The inability to capture and aggregate price volatility at the lowest levels of the CPI within the pricing month introduces the potential for significant month-to-month volatility in the headline CPI. This may distort the measure of pure price change reported in the monthly CPI.
In an era where most consumer products are available online, and where Canadians routinely purchase services such as flights, hotel rooms or rental cars over the Internet, the CPI will need to consider and adapt to the divergent patterns of online price movements to maintain its relevance, responsiveness and accuracy as an indicator of inflation dynamics. Using prices collected to produce the CPI, this article will analyze how online prices for consumer goods move relative to prices collected in stores in a Canadian retail landscape, and evaluate how e-commerce is impacting the CPI. It will also explore how the CPI can further adapt and evolve in an increasingly digitalized world. As Statistics Canada begins replacing field collected price data with other sources, including data obtained through web scraping or online price collection, this paper provides a fuller understanding of the behaviour of online prices to ensure the effective management and optimization of the CPI sample.
The Canadian CPI
With the introduction of the 2017 basket (January 2019 reference month), several CPI aggregates are at least partially priced online. Government services, retail club memberships and passenger vehicle registration fees were among the first indexes to be priced online. The list of products priced entirely online has since expanded to incorporate a range of goods and services regularly purchased online by consumers. These indexes comprise 17.2% of the CPI basket.
- Traveller accommodation
- Air transportation
- Rental of passenger vehicles
- Telephone services
- Internet access services
- Rail, highway bus and other inter-city transportation
- City bus and subway transportation
- Drivers’ licences
- Government services
- Passenger vehicle registration fees
- Retail club memberships
- Textbooks
- Purchase of passenger vehicles
- Video and audio subscription services
- Recreational and medicinal cannabis
- Travel tours
- Furniture
- Household textiles
- Toys, games (excluding video games) and hobby supplies
- Household appliances
- Non-electric kitchen utensils, tableware and cookware
- Purchase of digital media
- Multipurpose digital devices
- Photographic equipment and supplies
- Audio equipment
- Books and reading material (excluding textbooks)
Several of these commodities are eliminated from this analysis, as their price dynamics are unlikely to be influenced by online pricing. The price of a drivers’ licence, for example, is set by the various provincial governments and does not frequently change, nor does its price vary by point of purchase. Similarly, indexes measuring the prices of local transit, passenger vehicle registration fees and retail club memberships can also be reasonably eliminated from this analysis. The purchase of passenger vehicles index is also eliminated, because while prices may be collected online, sales are not routinely made online. This limits any potential price volatility by reintroducing menu costsNote 6 and the stickiness associated with in-store prices.
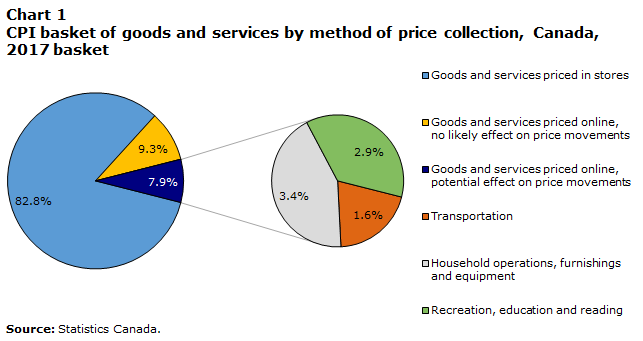
Among the remaining indexes, approximately 7.9% of the CPI basket was priced online in January 2019. The majority of this basket weight was comprised of services, including air transportation and traveller accommodation. With respect to goods, only textbooks and cannabis are fully priced online, and those partially priced online comprise less than 1% of the total CPI basket (Chart 1).
Data table for Chart 1
| Percent | |
|---|---|
| Goods and services priced in stores | 82.8 |
| Goods and services priced online, no likely effect on price movements | 9.3 |
| Goods and services priced online, potential effect on price movements | 7.9 |
| Transportation | 1.6 |
| Household operations, furnishings and equipment | 3.4 |
| Recreation, education and reading | 2.9 |
| Source: Statistics Canada. | |
In addition, several elementary aggregates are imputedNote 7 from aggregates partially priced online. These include kitchen utensils, handicrafts and artists’ supplies, electronic books, and maps, sheet music and other reading material.
Data
In order to compare price patterns by method of collection in the CPI, the prices used in its calculation are analyzed using descriptive statistics. The collection process (physical outlets, internet, or alternative data) is identified when prices are collected and this information is used to differentiate prices collected online from those collected in stores. Additionally, any prices collected from an outlet which is a website (such as Amazon.ca) are identified as being collected online. To control for the effects of time and avoid bias introduced by comparing prices collected in different time periods, this analysis only includes products partially priced online. Preliminary investigation revealed no significant regional effect, and therefore comparisons are made at the Canada level.
Many commodities that may be subject to algorithmic pricing, such as air transportation and traveller accommodation, transitioned to internet price collection at the same time that other aspects of the sample and methodology were updated, making the effects of online price collection impossible to conclusively isolate. These commodities are consequently excluded from this analysis.
Other research limitations include inherent differences between the sample of prices collected online and those collected in stores. In most cases, the online sample is considerably smaller than the sample of prices collected in stores. Consequently, given the small number of mainstream e-commerce firms, the sample of prices collected from stores represents a larger number of outlets compared with the sample of prices collected online. Further, prices collected online are often, but not always, subject to national pricing strategies while prices collected in stores are just as likely to be subject to regional pricing strategies.
Despite these limitations, the resulting analysis provides an adequate basis to assess the impact of the diverging behaviour of prices collected online and those collected in stores on the monthly CPI.
Analysis
The degree of variation in price movements, rather than price levels, defines the volatility of a given index. For the purposes of this analysis, volatility is measured by calculating the 1-month change in the index in absolute terms (since indexes may regularly increase or decrease on a 1-month basis) and comparing the arithmetic mean and standard deviation of the movements of goods priced online and those not priced online. Comparisons are made across elementary aggregates,Note 8 which are subcategories of published CPI indexes; the prices of tablets collected in stores, for instance, were directly compared with the prices of tablets collected online.
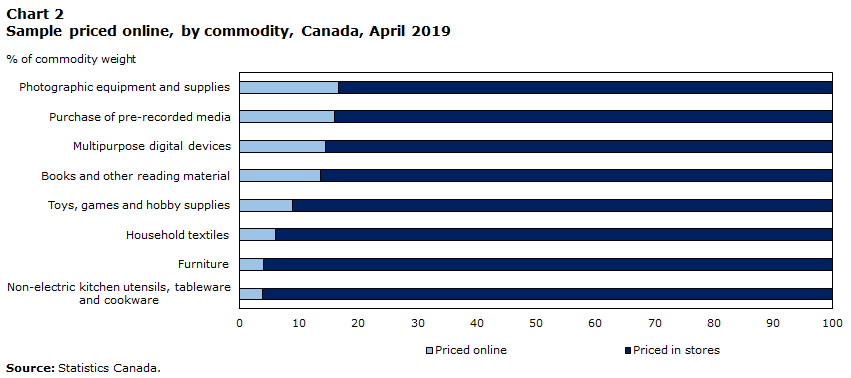
For indexes partially priced online, where the majority of prices are collected in stores by interviewers, no unusual volatility is observed at the published level following the introduction of partial online pricing. In most cases, the proportion of the sample priced online is likely too small to influence the index movement in a significant way at the published level (Chart 2).
Data table for Chart 2
| Priced online | Priced in stores | |
|---|---|---|
| % of commodity weight | ||
| Photographic equipment and supplies | 16.67 | 83.33 |
| Purchase of pre-recorded media | 15.96 | 84.04 |
| Multipurpose digital devices | 14.53 | 85.47 |
| Books and other reading material | 13.67 | 86.33 |
| Toys, games and hobby supplies | 8.96 | 91.04 |
| Household textiles | 5.96 | 94.04 |
| Furniture | 4.03 | 95.97 |
| Non-electric kitchen utensils, tableware and cookware | 3.90 | 96.10 |
| Source: Statistics Canada. | ||
Below the published level, however, analysis of price movements across collection methods (in-store pricing or online pricing) reveals that goods priced online tend toward larger monthly movements than goods priced in stores, with more volatility in the data. This phenomenon varies by commodity, with prices for books, pre-recorded digital media (such as CDs and DVDs), multipurpose digital devices and toys demonstrating more volatility when priced online (Table 1).
| Month transitioned to partial internet pricing | Items priced in stores | Items priced online | |||||
|---|---|---|---|---|---|---|---|
| Mean m/m % change | Standard deviation | n | Mean m/m % change | Standard deviation | n | ||
| Books and other reading materialTable 1 Note 1 | December 2016 | 14.7 | 21.8 | 6,746 | 30.5 | 33.9 | 1,039 |
| Furniture | February 2015 | 8.2 | 18.0 | 44,157 | 1.3 | 4.2 | 2,089 |
| Household textiles | September 2016 | 5.2 | 15.7 | 15,736 | 0.1 | 1.2 | 928 |
| Multipurpose digital devices | October 2015 | 5.8 | 11.8 | 10,876 | 8.8 | 18.4 | 1,489 |
| Non-electric kitchen utensils, tableware and cookware | December 2014 | 10.5 | 31.6 | 30,753 | 0.3 | 2.4 | 930 |
| Photographic equipment and supplies | October 2015 | 8.1 | 22.8 | 12,717 | 6.6 | 14.5 | 1,895 |
| Portable speakers and MP3 players | April 2017 | 3.2 | 8.8 | 2,861 | 4.0 | 7.5 | 298 |
| Purchase of pre-recorded mediaTable 1 Note 1 | June 2017 | 8.5 | 15.4 | 4,850 | 37.9 | 50.9 | 900 |
| Toys, games and hobby supplies | April 2017 | 2.7 | 9.5 | 10,146 | 10.4 | 17.6 | 868 |
| USB drives and external hard drives | October 2015 | 10.5 | 29.8 | 5,471 | 8.2 | 21.0 | 741 |
|
|||||||
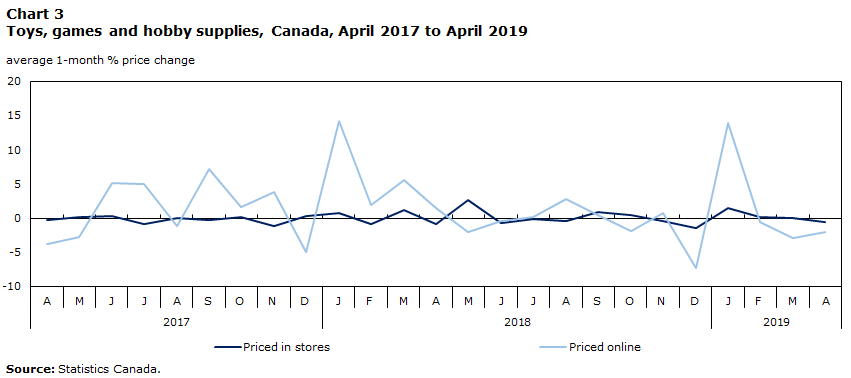
When collected online, the average price movement of a product priced for the toys, games (excluding video games) and hobby supplies index was 10.4% (s = 17.6), as opposed to an average movement of 2.7% (s = 9.5) when collected in stores. This indicates a higher degree of volatility in prices for toys collected from online marketplaces (Chart 3).
Data table for Chart 3
| Priced in stores | Priced online | ||
|---|---|---|---|
| average 1-month % price change | |||
| 2017 | April | -0.35 | -3.81 |
| May | 0.21 | -2.75 | |
| June | 0.34 | 5.15 | |
| July | -0.85 | 4.99 | |
| August | 0.04 | -1.21 | |
| September | -0.33 | 7.19 | |
| October | 0.16 | 1.57 | |
| November | -1.09 | 3.88 | |
| December | 0.28 | -4.92 | |
| 2018 | January | 0.79 | 14.14 |
| February | -0.84 | 1.84 | |
| March | 1.20 | 5.55 | |
| April | -0.90 | 1.48 | |
| May | 2.60 | -1.97 | |
| June | -0.80 | -0.38 | |
| July | -0.09 | 0.09 | |
| August | -0.46 | 2.85 | |
| September | 0.89 | 0.45 | |
| October | 0.42 | -1.85 | |
| November | -0.44 | 0.72 | |
| December | -1.52 | -7.36 | |
| 2019 | January | 1.48 | 13.90 |
| February | 0.19 | -0.52 | |
| March | 0.02 | -2.94 | |
| April | -0.56 | -2.06 | |
| Source: Statistics Canada. | |||
Prices for furniture, household textiles, tableware and cookware showed less volatility when priced online,Note 9 and prices for digital cameras, portable audio equipment and portable media drives moved fairly consistently across collection methods.
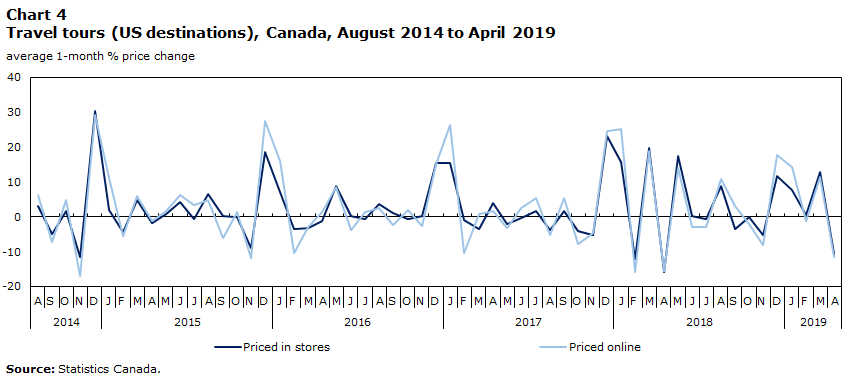
Among the service indexes priced online, the travel tours index (which comprises 1.21% of the CPI basket) is unusual in that 50% of the index is priced online. Online prices for travel tour packages have been included in the CPI since August 2014, when packages with US destinations transitioned to internet pricing. By December 2015, packages to Europe, Mexico and the Caribbean were also being priced online (Table 2).
| Destination | Month transitioned to partial internet pricing | Priced in stores | Priced online | ||||
|---|---|---|---|---|---|---|---|
| Mean m/m % change | Standard deviation | n | Mean m/m % change | Standard deviation | n | ||
| United States | August 2014 | 18.9 | 16.4 | 8,676 | 18.6 | 18.5 | 23,412 |
| Europe | June 2015 | 11.0 | 9.3 | 1,526 | 11.1 | 10.2 | 4,250 |
| Caribbean | December 2015 | 16.8 | 12.6 | 4,510 | 17.0 | 13.2 | 10,891 |
The average monthly price movements for tours to each destination are relatively large, with the high standard deviation reflecting the seasonal nature (and the subsequent spread) of the index.
Data table for Chart 4
| Priced in stores | Priced online | ||
|---|---|---|---|
| average 1-month % price change | |||
| 2014 | August | 3.17 | 6.09 |
| September | -4.94 | -7.20 | |
| October | 1.60 | 4.89 | |
| November | -11.68 | -16.98 | |
| December | 30.26 | 29.30 | |
| 2015 | January | 1.97 | 11.23 |
| February | -4.24 | -5.47 | |
| March | 4.83 | 5.96 | |
| April | -1.68 | -1.13 | |
| May | 0.67 | 1.62 | |
| June | 4.33 | 6.23 | |
| July | -0.62 | 3.35 | |
| August | 6.54 | 4.89 | |
| September | 0.08 | -6.15 | |
| October | -0.20 | 1.38 | |
| November | -8.83 | -11.92 | |
| December | 18.60 | 27.56 | |
| 2016 | January | 6.99 | 16.02 |
| February | -3.65 | -10.26 | |
| March | -3.31 | -2.94 | |
| April | -1.31 | 1.23 | |
| May | 8.83 | 8.40 | |
| June | 0.26 | -3.70 | |
| July | -0.60 | 1.39 | |
| August | 3.56 | 2.40 | |
| September | 0.98 | -2.37 | |
| October | -0.58 | 1.92 | |
| November | 0.15 | -2.67 | |
| December | 15.47 | 15.11 | |
| 2017 | January | 15.52 | 26.30 |
| February | -1.04 | -10.26 | |
| March | -3.56 | 0.90 | |
| April | 3.87 | 1.61 | |
| May | -2.00 | -3.16 | |
| June | -0.25 | 2.37 | |
| July | 1.66 | 5.24 | |
| August | -3.76 | -5.19 | |
| September | 1.74 | 5.47 | |
| October | -4.00 | -7.79 | |
| November | -5.12 | -4.54 | |
| December | 23.07 | 24.69 | |
| 2018 | January | 15.74 | 25.12 |
| February | -12.23 | -15.72 | |
| March | 19.84 | 18.79 | |
| April | -15.78 | -15.50 | |
| May | 17.33 | 13.86 | |
| June | 0.09 | -2.83 | |
| July | -0.58 | -2.86 | |
| August | 8.86 | 10.69 | |
| September | -3.61 | 3.02 | |
| October | -0.12 | -2.08 | |
| November | -5.23 | -8.06 | |
| December | 11.71 | 17.55 | |
| 2019 | January | 7.52 | 14.17 |
| February | 0.43 | -1.20 | |
| March | 12.85 | 11.43 | |
| April | -10.83 | -11.57 | |
| Source: Statistics Canada. | |||
The standard deviation of the monthly price movement is higher when priced online, indicating a higher degree of volatility in prices collected from the internet than those collected in travel agencies. While the average size of a monthly movement was fairly consistent across collection methods, travel tour prices collected online tended to display higher seasonal peaks and lower troughs than those collected in stores, as evidenced by recent seasonal holiday movements for travel tours with destinations in the United States (Chart 4).
Online-only retailers vs. brick-and-mortar stores
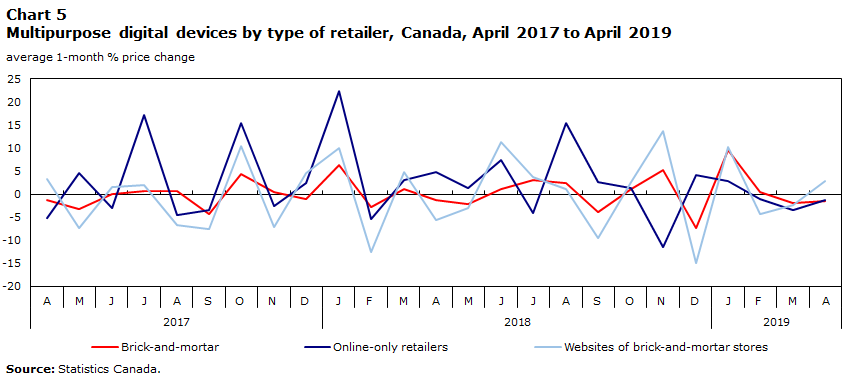
The type of retailer also has an effect on volatility. While the Canadian CPI sample includes products priced from online-only marketplaces (such as Amazon.ca), prices are also collected from online retailers that are primarily known for their physical stores.
Whereas an online-only retailer is theoretically subject to smaller menu costs in setting its prices, this may not be the case for the online version of a brick-and-mortar store. In the latter scenario, online prices often match the prices in the retailer’s physical stores, which reintroduces the price stickiness faced by brick-and-mortar stores. In this analysis, prices collected from online-only retailers exhibited considerably more volatility than prices collected either in brick-and-mortar stores or in the online versions of brick-and-mortar stores (Chart 5).
Data table for Chart 5
| Brick-and-mortar | Online-only retailers | Websites of brick-and-mortar stores | ||
|---|---|---|---|---|
| average 1-month % price change | ||||
| 2017 | April | -1.21 | -5.24 | 3.30 |
| May | -3.32 | 4.51 | -7.31 | |
| June | 0.01 | -2.95 | 1.52 | |
| July | 0.76 | 17.04 | 1.86 | |
| August | 0.62 | -4.54 | -6.80 | |
| September | -4.41 | -3.37 | -7.61 | |
| October | 4.26 | 15.39 | 10.40 | |
| November | 0.50 | -2.48 | -7.14 | |
| December | -1.12 | 2.49 | 4.46 | |
| 2018 | January | 6.33 | 22.35 | 9.96 |
| February | -2.71 | -5.31 | -12.53 | |
| March | 1.03 | 2.98 | 4.69 | |
| April | -1.38 | 4.78 | -5.71 | |
| May | -2.14 | 1.23 | -3.04 | |
| June | 1.11 | 7.44 | 11.36 | |
| July | 3.13 | -4.06 | 3.69 | |
| August | 2.39 | 15.48 | 1.03 | |
| September | -3.78 | 2.55 | -9.56 | |
| October | 1.07 | 1.29 | 2.67 | |
| November | 5.16 | -11.38 | 13.58 | |
| December | -7.42 | 4.04 | -14.97 | |
| 2019 | January | 9.46 | 2.76 | 10.20 |
| February | 0.43 | -1.09 | -4.33 | |
| March | -1.98 | -3.40 | -2.42 | |
| April | -1.42 | -1.35 | 2.75 | |
| Source: Statistics Canada. | ||||
Consequently, the amount of volatility in a given index depends on the type of retailer from which prices are being collected. Furniture, household textiles, tableware and cookware are only priced online from retailers who also have a physical presence. Prices for these goods, when collected online, did not display significant volatility when compared with prices of goods collected in stores. The indexes with the greatest disparity between the movements of prices collected online and those collected in stores are exclusively priced online from online-only retailers. These goods include toys, books and digital media.
The “brick-and-mortar” effect likely impacts several services indexes as well. Cellular or Internet access services, for example, can be bought online, but consumers can make the same transactions in physical outlets from the same providers.
Pricing dynamics
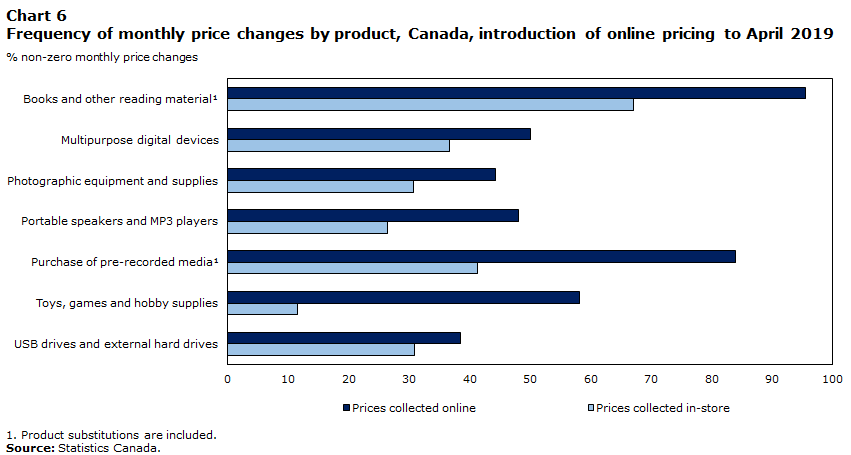
Most goods that showed more volatility when priced online did so because of frequent price changes. The frequency of monthly price changes, as measured by the proportion of non-zero price changes from one month to the next, was higher in most product categories, as seen in chart 6. For some goods, such as toys, games and hobby supplies, there was a significant difference in the frequency of price changes: prices collected online changed 58.2% of the time from one month to the next, compared with 11.5% of prices collected in stores.
Data table for Chart 6
| Prices collected online | Prices collected in-store | |
|---|---|---|
| % non-zero monthly price changes | ||
| Books and other reading materialData table Note 1 | 95.6 | 67.2 |
| Multipurpose digital devices | 50.2 | 36.8 |
| Photographic equipment and supplies | 44.2 | 30.7 |
| Portable speakers and MP3 players | 48.1 | 26.4 |
| Purchase of pre-recorded mediaData table Note 1 | 84.0 | 41.3 |
| Toys, games and hobby supplies | 58.2 | 11.5 |
| USB drives and external hard drives | 38.5 | 30.9 |
|
||
This pricing behaviour is consistent with the hypothesis that online retailers have fewer barriers to price adjustment than brick-and-mortar stores. Rather, they are able to adjust prices as frequently as market forces dictate. To this point, the frequency of online price change is highest for product groups where online prices are collected exclusively from retailers without a brick-and-mortar presence.
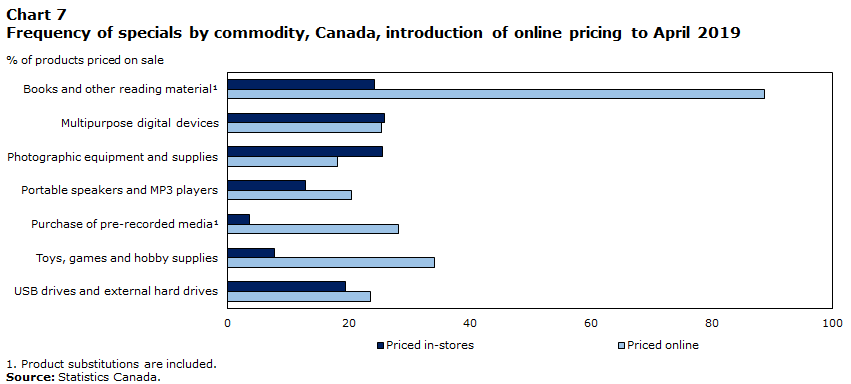
Similarly, in most product groups, there is a higher proportion of specials in products priced online. Outside of specials, prices collected online also change more frequently (Chart 7), indicating that online prices have a greater frequency of unadvertised price changes. Such pricing behaviour is consistent with the use of algorithmic pricing on the part of online retailers.
Data table for Chart 7
| Priced in-stores | Priced online | |
|---|---|---|
| % of product priced on sale | ||
| Books and other reading materialData table Note 1 | 24.3 | 88.7 |
| Multipurpose digital devices | 25.9 | 25.5 |
| Photographic equipment and supplies | 25.6 | 18.2 |
| Portable speakers and MP3 players | 12.8 | 20.5 |
| Purchase of pre-recorded mediaData table Note 1 | 3.5 | 28.2 |
| Toys, games and hobby supplies | 7.7 | 34.2 |
| USB drives and external hard drives | 19.5 | 23.6 |
|
||
Notably, these month-to-month price change dynamics are strongest for the lowest-priced goods, including toys, pre-recorded digital media and books. With respect to the frequency of price changes and specials, higher-priced commodities show less divergence between the behaviour of prices collected online and prices collected in stores. This is also generally true at lower levels of aggregation. For instance, prices for paperback books collected online change more frequently than hardcover books.
Long-term price trends
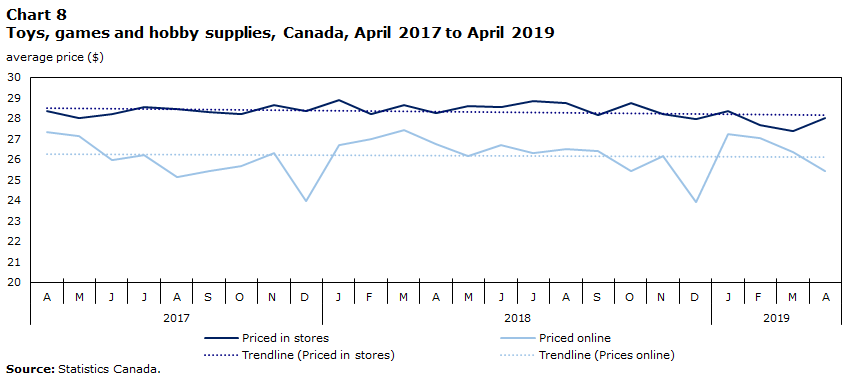
When comparing average prices over time, there is no clear difference between the long-term movements of prices collected online and those collected in stores. For most commodities, including toys, books, pre-recorded media and blank media drives, prices trended similarly across collection methods over time. Prices for multipurpose digital devices trended higher when collected online, while prices for portable speakers and mp3 players trended lower. While prices collected online changed more frequently and were more widely dispersed around the mean than those collected in stores, price growth in these indexes indicates that this divergent behaviour is primarily a short-term phenomenon (Chart 8). The linear trend in chart 8 demonstrates that the two-year price movement between April 2017 and April 2019 is nearly identical for goods priced online and those priced in stores, indicating that, in the long-term, prices move quite similarly across collection methods.
Data table for Chart 8
| Priced in stores | Trendline (Priced in stores) | Priced online | Trendline (Priced online) | ||
|---|---|---|---|---|---|
| average price ($) | |||||
| 2017 | April | 28.37 | 28.50 | 27.31 | 26.00 |
| May | 28.02 | 28.50 | 27.15 | 26.00 | |
| June | 28.22 | 28.50 | 25.98 | 26.00 | |
| July | 28.55 | 28.50 | 26.21 | 26.00 | |
| August | 28.45 | 28.50 | 25.15 | 26.00 | |
| September | 28.28 | 28.50 | 25.41 | 26.00 | |
| October | 28.23 | 28.50 | 25.69 | 26.00 | |
| November | 28.64 | 28.50 | 26.31 | 26.00 | |
| December | 28.35 | 28.50 | 23.95 | 26.00 | |
| 2018 | January | 28.88 | 28.50 | 26.71 | 26.00 |
| February | 28.19 | 28.50 | 27.01 | 26.00 | |
| March | 28.62 | 28.50 | 27.42 | 26.00 | |
| April | 28.24 | 28.50 | 26.74 | 26.00 | |
| May | 28.58 | 28.50 | 26.14 | 26.00 | |
| June | 28.56 | 28.50 | 26.69 | 26.00 | |
| July | 28.85 | 28.50 | 26.29 | 26.00 | |
| August | 28.74 | 28.50 | 26.49 | 26.00 | |
| September | 28.15 | 28.50 | 26.39 | 26.00 | |
| October | 28.72 | 28.50 | 25.45 | 26.00 | |
| November | 28.19 | 28.50 | 26.18 | 26.00 | |
| December | 27.96 | 28.50 | 23.94 | 26.00 | |
| 2019 | January | 28.35 | 28.50 | 27.24 | 26.00 |
| February | 27.67 | 28.50 | 27.04 | 26.00 | |
| March | 27.36 | 28.50 | 26.33 | 26.00 | |
| April | 28.00 | 28.50 | 25.41 | 26.00 | |
| Source: Statistics Canada. | |||||
Estimated impact on the CPI
Several indexes recorded increases in volatility and the size of the average monthly movement when priced online, and this observation consistently held when online prices were collected solely from online-only marketplaces. Using the difference in the average movement of an index when priced online and its weight in the 2017 CPI basket, the average change in contribution to the CPI is estimated to be ±0.02 percentage points, with the books and other reading material, purchase of pre-recorded digital media and toys, games and hobby supplies indexes contributing the most. To put this estimate into context, the average monthly movement of the all-items CPI was 0.2% in both 2017 and 2018. While the disparity between the behaviour of prices collected online and those collected in stores is quite pronounced, the effect on the headline CPI is considerably muted because of the relatively low basket weights of the most affected commodities in this analysis and the low proportion of prices collected online.
While the quantifiable impact of online pricing on the CPI is qualitatively modest, it bears consideration that there are a significant number of indexes not included in this analysis, primarily services, where the measurable effect of online pricing is impossible to isolate. In these indexes, changes in sampling and/or methodology were implemented simultaneously with the transition to internet pricing, confounding any impact from collecting prices online. Several of these services, including inter-city transportation, traveller accommodation and rental of passenger vehicles, are in industries where the academic literature has found evidence of algorithmic pricing strategies, and it is not unlikely that prices collected to produce these indexes are affected by pricing patterns unique to online marketplaces. For every percentage point added to the average monthly price movement due to volatility introduced by the online price market for these indexes, the estimated average impact on the headline CPI is an additional ±0.01 percentage points.
Looking forward
As e-commerce becomes an increasingly important part of the retail landscape, online pricing dynamics will assume greater relevance to the measurement of consumer prices. It has been established that prices collected online move differently than those collected in stores, and this divergence, in the short-term, has the potential to distort conventional understanding of monthly inflation dynamics. This effect will only increase as the popularity of e-commerce continues to grow. By continuing to adapt to the evolving digital economy, the CPI will maintain the highest level of accuracy as an indicator of consumer price change.
One way to address the challenges of pricing in a digital economy is to update price collection methods to mirror the actual consumption patterns of Canadians, particularly with respect to the purchase of goods. While the CPI sample of goods does include online prices, they are typically included in the sample primarily for ease and efficiency of collection and encompass an extremely small proportion of collected prices. At the other extreme, several services, including airfares and traveller accommodation, are entirely priced online despite a sizeable proportion of transactions that continue to occur offline. To reflect the actual consumption patterns of Canadians, a greater variety of goods and services are being partially priced online. Areas such as clothing, small household appliances, sporting and recreational equipment and spectator entertainment (show or game tickets) are being explored.Note 10 Statistics Canada is currently making progress on this front through its efforts to incorporate web scraped prices into the CPI for clothing, footwear and related accessories.
Ideally, the proportion of the sample collected online would aim to mirror the actual consumption habits of Canadians as closely as possible, with the goal of measuring the movement of prices Canadians actually face. This would require expansion of the online sample to include a greater variety of outlets and products. Weighting the sample of a given commodity to reflect the actual consumption habits of Canadians with respect to method of purchase, however, would require the development of a data source from which to create expenditure weights at the commodity level, as this data is not currently available. At a broader scale, however, the proportion of e-commerce sales to in-store sales is currently collected as part of the Monthly Retail Trade Survey’s retail e-commerce sales data.Note 11 This data can provide insight into the evolving consumption patterns of Canadians and quantify the role of e-commerce in overall consumer expenditures in Canada. The integration of data from the Monthly Retail Trade Survey into the continual development of the CPI’s sample of outlets is an area of ongoing research at Statistics Canada.
It is not inherently problematic for online prices to exhibit a greater degree of volatility than their in-store counterparts since the prices collected do indeed represent a new market reality faced by consumers. Rather, challenges emerge in interpreting inflation dynamics based on a CPI that was designed to capture a monthly snapshot of prices, rather than prices that change as frequently as those in the online world. The standard pricing method for the CPI involves pricing a given item once a month, whether a price is collected in stores by interviewers or online. As the proportion of the CPI basket comprised of online prices continues to grow, the monthly CPI is capturing more and more price instances that may be anywhere in a rapidly changing cycle of highs and lows. Collecting prices more frequently over the course of the month would provide a more accurate assessment of current price levels and more insight into pure price change on a month-to-month basis. This approach is already being used in the Canadian CPI to measure prices for gasoline, another commodity where prices often fluctuate significantly within the pricing month.
Lastly, the CPI basket of goods and services will continue to evolve along with the digital economy and incorporate new goods and services as they become popular with consumers. The introduction of ride sharing services, online vacation property rental and audio streaming services to the 2017 CPI basket represents a significant step forward in this regard. As new goods and services become available, however, further additions will be necessary for the CPI basket to maintain relevance as a reflection of consumer spending in a digital economy.
Conclusion
Prices collected online vary from those collected in stores in a few key ways: there is greater variation in price movements and a higher frequency of price changes. These differences are more pronounced for outlets with no physical presence. Despite this diverging price behaviour, there is currently no consistent long-term impact on lower level price indexes and the quantifiable impact on the month-over-month headline CPI movement is minimal. Even so, the CPI is moving to adapt in an increasingly digital world to ensure it captures the prices faced by consumers and remains a robust indicator of inflation dynamics.
References
Bilokatch, V., Y. Gorodnichenko and O. Talavera (2010): “Are Airlines’ Price-Setting Strategies Different?” Journal of Air Transport Management, 16, 1-6.
Blaudow, C. and F. Burg (2018): “Dynamic Pricing as a Challenge for Consumer Price Statistics.” EURONA, 1, 16.
Cavallo, A. (2018): “More Amazon Effects: Online Competition and Pricing Behaviors.” Jackson Hole Economic Symposium Conference Proceedings (Federal Reserve Bank of Kansas City).
Ferreira, K. J., B.H.A. Lee and D. Simchi-Levin (2015): “Analytics for an Online Retailer: Demand Forecasting and Price Optimization.” Manufacturing & Service Operations Management, 18, 69-88.
Statistics Canada. 2019. “The Canadian Consumer Price Index Reference Paper.” Prices Analytical Series. Statistics Canada Catalogue no. 62-553-X.
Statistics Canada. Table 20-10-0072-01 Monthly Retail Trade Survey, Retail E-commerce sales, unadjusted (x 1,000).
Canadian Internet Registration Authority/The Strategic Counsel. 2019. Internet Factbook.
- Date modified: