
Prices Analytical Series
Shelter in the Canadian CPI: An overview

Archived Content
Information identified as archived is provided for reference, research or recordkeeping purposes. It is not subject to the Government of Canada Web Standards and has not been altered or updated since it was archived. Please "contact us" to request a format other than those available.
by Amadou Soumare
Shelter is the most important of the eight major components in the Consumer Price Index (CPI). As shown in Table 1, it represents more than a quarter of the total expenditures on goods and services that are in the scope of the index.
| Components | Relative share in the CPI basket of goods and services |
|---|---|
| percent | |
| Shelter | 26.8 |
| Rented accommodation | 6.4 |
| Rent | 6.2 |
| Tenants’ insurance premiums | 0.1 |
| Tenants’ maintenance, repairs and other expenses | 0.1 |
| Owned accommodation | 16.1 |
| Mortgage interest cost | 3.5 |
| Homeowners’ replacement cost | 4.8 |
| Property taxes and other special charges | 3.4 |
| Homeowners’ home and mortgage insurance | 1.3 |
| Homeowners’ maintenance and repairs | 1.4 |
| Other owned accommodation expenses | 1.6 |
| Water, fuel and electricity | 4.3 |
| Electricity | 2.4 |
| Water | 0.6 |
| Natural gas | 0.9 |
| Fuel oil and other fuels | 0.3 |
| Source: Statistics Canada, as calculated by the Consumer Prices Division for the CPI basket update based on the Survey of Household Spending (SHS) 2015. | |
The shelter index is a weighted average of sub-indexes representing price changes associated with shelter-related expenditure categories. These weights are based on the Survey of Household Spending (SHS), and, for each expenditure category, represent the share of total expenditures of goods and services typically purchased by Canadian households.
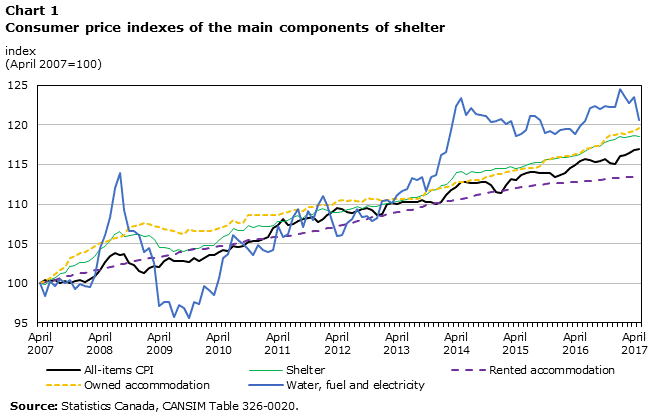
Data table for Chart 1
| All-items CPI | Shelter | Rented accommodation | Owned accommodation | Water, fuel and electricity | |
|---|---|---|---|---|---|
| index (April 2007=100) | |||||
| 2007 | |||||
| April | 100.0 | 100.0 | 100.0 | 100.0 | 100.0 |
| May | 100.4 | 99.8 | 100.1 | 100.3 | 98.4 |
| June | 100.3 | 100.5 | 100.3 | 100.7 | 100.2 |
| July | 100.4 | 100.7 | 100.4 | 101.1 | 99.7 |
| August | 100.1 | 101.2 | 100.7 | 101.6 | 100.5 |
| September | 100.3 | 101.4 | 100.9 | 102.0 | 100.0 |
| October | 100.0 | 102.2 | 100.9 | 103.1 | 100.4 |
| November | 100.3 | 102.2 | 101.1 | 103.5 | 99.2 |
| December | 100.4 | 102.6 | 101.2 | 103.8 | 99.9 |
| 2008 | |||||
| January | 100.2 | 102.6 | 101.3 | 103.9 | 99.7 |
| February | 100.5 | 102.9 | 101.5 | 104.3 | 99.5 |
| March | 100.9 | 103.4 | 101.6 | 104.7 | 101.0 |
| April | 101.7 | 104.3 | 101.7 | 105.1 | 104.4 |
| May | 102.7 | 104.6 | 101.9 | 105.3 | 106.0 |
| June | 103.4 | 105.2 | 102.0 | 105.5 | 108.3 |
| July | 103.8 | 106.1 | 102.2 | 105.8 | 112.0 |
| August | 103.6 | 106.5 | 102.4 | 105.9 | 113.9 |
| September | 103.7 | 105.9 | 102.5 | 106.1 | 109.2 |
| October | 102.6 | 106.0 | 102.7 | 107.0 | 106.6 |
| November | 102.2 | 106.2 | 102.8 | 107.2 | 106.7 |
| December | 101.5 | 106.2 | 102.9 | 107.4 | 106.1 |
| 2009 | |||||
| January | 101.3 | 105.9 | 103.0 | 107.5 | 103.9 |
| February | 102.0 | 106.0 | 103.1 | 107.5 | 104.4 |
| March | 102.2 | 105.5 | 103.2 | 107.2 | 102.5 |
| April | 102.1 | 104.5 | 103.3 | 107.0 | 97.1 |
| May | 102.8 | 104.5 | 103.4 | 106.8 | 97.6 |
| June | 103.1 | 104.4 | 103.5 | 106.7 | 97.6 |
| July | 102.8 | 104.0 | 103.6 | 106.6 | 95.7 |
| August | 102.8 | 104.2 | 103.9 | 106.4 | 97.3 |
| September | 102.8 | 104.0 | 104.0 | 106.2 | 96.9 |
| October | 102.7 | 104.3 | 104.2 | 106.9 | 95.6 |
| November | 103.2 | 104.4 | 104.3 | 106.5 | 97.6 |
| December | 102.9 | 104.4 | 104.4 | 106.5 | 97.4 |
| 2010 | |||||
| January | 103.1 | 104.8 | 104.4 | 106.5 | 99.6 |
| February | 103.6 | 104.8 | 104.5 | 106.5 | 99.1 |
| March | 103.6 | 104.7 | 104.5 | 106.7 | 98.5 |
| April | 103.9 | 105.3 | 104.6 | 107.0 | 100.6 |
| May | 104.2 | 105.9 | 104.6 | 107.1 | 103.1 |
| June | 104.1 | 106.1 | 104.7 | 107.3 | 103.7 |
| July | 104.7 | 107.0 | 104.9 | 108.0 | 106.1 |
| August | 104.6 | 106.7 | 105.1 | 107.6 | 105.4 |
| September | 104.7 | 106.6 | 105.2 | 107.6 | 105.0 |
| October | 105.2 | 107.2 | 105.4 | 108.7 | 104.3 |
| November | 105.3 | 107.1 | 105.5 | 108.6 | 103.6 |
| December | 105.3 | 107.2 | 105.6 | 108.6 | 104.9 |
| 2011 | |||||
| January | 105.6 | 107.1 | 105.6 | 108.7 | 104.2 |
| February | 105.8 | 107.1 | 105.7 | 108.7 | 103.9 |
| March | 107.0 | 107.2 | 105.8 | 108.6 | 104.2 |
| April | 107.3 | 107.7 | 105.9 | 108.6 | 107.3 |
| May | 108.1 | 107.7 | 106.0 | 108.9 | 105.9 |
| June | 107.3 | 107.9 | 106.0 | 109.0 | 106.3 |
| July | 107.5 | 108.3 | 106.1 | 109.2 | 108.3 |
| August | 107.8 | 108.6 | 106.3 | 109.2 | 109.4 |
| September | 108.1 | 108.2 | 106.3 | 109.2 | 107.1 |
| October | 108.2 | 108.9 | 106.4 | 109.6 | 109.1 |
| November | 108.3 | 108.7 | 106.5 | 109.7 | 108.0 |
| December | 107.7 | 109.1 | 106.6 | 109.8 | 109.9 |
| 2012 | |||||
| January | 108.2 | 109.4 | 106.7 | 109.9 | 111.0 |
| February | 108.6 | 109.2 | 106.9 | 109.9 | 109.9 |
| March | 109.1 | 109.0 | 107.0 | 109.9 | 107.8 |
| April | 109.5 | 109.0 | 107.2 | 110.4 | 106.0 |
| May | 109.4 | 109.0 | 107.3 | 110.5 | 106.1 |
| June | 109.0 | 109.3 | 107.5 | 110.4 | 107.6 |
| July | 108.9 | 109.5 | 107.6 | 110.5 | 108.1 |
| August | 109.1 | 109.6 | 107.9 | 110.3 | 109.3 |
| September | 109.3 | 109.5 | 108.0 | 110.3 | 108.3 |
| October | 109.5 | 109.8 | 108.1 | 110.8 | 108.5 |
| November | 109.2 | 109.7 | 108.3 | 110.7 | 107.9 |
| December | 108.6 | 109.7 | 108.4 | 110.6 | 108.2 |
| 2013 | |||||
| January | 108.7 | 110.0 | 108.5 | 110.4 | 110.3 |
| February | 109.9 | 110.1 | 108.7 | 110.5 | 110.6 |
| March | 110.1 | 110.2 | 108.8 | 110.6 | 110.1 |
| April | 109.9 | 110.3 | 109.0 | 110.6 | 111.2 |
| May | 110.2 | 110.4 | 109.0 | 110.6 | 111.6 |
| June | 110.2 | 110.6 | 109.2 | 110.8 | 111.9 |
| July | 110.3 | 110.8 | 109.3 | 110.7 | 113.2 |
| August | 110.3 | 110.8 | 109.6 | 110.7 | 113.0 |
| September | 110.5 | 111.0 | 109.7 | 110.9 | 113.5 |
| October | 110.2 | 111.2 | 109.8 | 111.5 | 111.7 |
| November | 110.2 | 111.7 | 110.0 | 111.8 | 113.5 |
| December | 109.9 | 111.8 | 110.1 | 111.9 | 113.6 |
| 2014 | |||||
| January | 110.3 | 112.3 | 110.1 | 112.0 | 116.2 |
| February | 111.2 | 112.5 | 110.3 | 112.1 | 116.5 |
| March | 111.8 | 113.1 | 110.4 | 112.2 | 119.3 |
| April | 112.2 | 113.9 | 110.6 | 112.7 | 122.3 |
| May | 112.7 | 114.1 | 110.6 | 112.7 | 123.3 |
| June | 112.8 | 113.8 | 110.8 | 112.8 | 121.2 |
| July | 112.6 | 114.1 | 110.9 | 113.0 | 122.2 |
| August | 112.6 | 113.9 | 111.1 | 113.0 | 121.4 |
| September | 112.7 | 114.0 | 111.3 | 113.0 | 121.3 |
| October | 112.8 | 114.3 | 111.4 | 113.4 | 121.1 |
| November | 112.4 | 114.3 | 111.6 | 113.6 | 120.4 |
| December | 111.6 | 114.5 | 111.6 | 113.7 | 120.5 |
| 2015 | |||||
| January | 111.4 | 114.5 | 111.6 | 113.8 | 120.8 |
| February | 112.4 | 114.5 | 111.7 | 114.0 | 120.0 |
| March | 113.2 | 114.7 | 111.9 | 114.2 | 120.4 |
| April | 113.1 | 114.5 | 112.0 | 114.3 | 118.6 |
| May | 113.7 | 114.6 | 112.1 | 114.4 | 118.8 |
| June | 114.0 | 114.9 | 112.1 | 114.6 | 119.3 |
| July | 114.1 | 115.1 | 112.2 | 114.5 | 121.1 |
| August | 114.1 | 115.2 | 112.4 | 114.6 | 121.1 |
| September | 113.9 | 115.2 | 112.4 | 114.8 | 120.6 |
| October | 114.0 | 115.6 | 112.5 | 115.6 | 119.0 |
| November | 113.9 | 115.7 | 112.6 | 115.7 | 119.2 |
| December | 113.4 | 115.7 | 112.6 | 115.9 | 118.9 |
| 2016 | |||||
| January | 113.6 | 115.8 | 112.6 | 115.9 | 119.3 |
| February | 113.9 | 115.9 | 112.7 | 116.0 | 119.5 |
| March | 114.6 | 116.0 | 112.8 | 116.1 | 119.4 |
| April | 115.0 | 116.1 | 112.8 | 116.4 | 118.9 |
| May | 115.4 | 116.3 | 112.8 | 116.5 | 119.8 |
| June | 115.7 | 116.7 | 112.9 | 117.0 | 120.4 |
| July | 115.5 | 117.0 | 112.9 | 117.0 | 122.1 |
| August | 115.3 | 117.2 | 113.1 | 117.3 | 122.4 |
| September | 115.4 | 117.2 | 113.1 | 117.4 | 122.0 |
| October | 115.7 | 117.8 | 113.2 | 118.2 | 122.3 |
| November | 115.2 | 118.1 | 113.3 | 118.7 | 122.2 |
| December | 115.1 | 118.2 | 113.3 | 118.7 | 122.2 |
| 2017 | |||||
| January | 116.0 | 118.6 | 113.3 | 118.9 | 124.5 |
| February | 116.2 | 118.4 | 113.4 | 118.8 | 123.5 |
| March | 116.4 | 118.5 | 113.4 | 119.1 | 122.8 |
| April | 116.8 | 118.7 | 113.4 | 119.3 | 123.5 |
| May | 116.9 | 118.5 | 113.5 | 119.6 | 120.6 |
| Source: Statistics Canada, CANSIM Table 326-0020. | |||||
Rented accommodation and owned accommodation are the most important components of the shelter index. They are also among the most discussed and debated sub-indexes of the CPI. Changes in the cost of rent in the CPI are often compared with other sources of rental data in various Canadian cities. The owned accommodation index is also often confronted with dwelling prices and mortgage interest rates, to assess the reliability of the CPI as an indicator of price changes in Canada.
This article will attempt to clarify concepts and practices related to the construction of the Canadian CPI shelter index and discuss precautions to be taken when making comparisons, particularly with respect to rental data, mortgage interest cost and homeowners’ replacement cost.
Rent index
The Canadian rent index is a matched model index. Every month, the rental prices paid by the households in the sample are compared with the rental prices they paid the previous month. This approach of following households from one month to the next enables the index to track the cost associated with housing services that remain constant over time. The data on rent are collected using a supplementary questionnaire included in the Labour Force Survey (LFS). Each month, the LFS contacts roughly 60,000 dwelling units to gather information on Canadian workforce. Approximately one-quarter of the selected households (approximately 14,000 units) rent their dwelling and can therefore be considered for the calculation of the CPI rent index. Subsidized dwellings and units used for business purposes are excluded from the rent sample. After taking into consideration all exclusions and non-responses, approximately 9,000 units remain (observations that the CPI can use) across Canada each month.
The CPI is designed to measure “pure” price change. Its purpose is to estimate changes over time in the cost of a fixed basket of goods and services whose characteristics are constant. When certain characteristics change, this is recorded as a change in quality. The “pure” price change corresponds to the remaining price change once the impact of quality changes on the observed prices has been eliminated.
To estimate “pure” price change, a description of the facilities and the key services provided by the landlord are collected along with the rental cost. If some aspect of the service or the amenities of a sample unit should change between two collection periods, an intervention is required to adjust what is included in the rent and to ensure comparability of the unit from one period to the next. For instance, if the landlord ceases to include heating in the rental price, the rent for the previous period is adjusted, assuming that everything else has remained the same, in order to reflect the fact that the tenant is now receiving fewer services than before in exchange for the rent payment. This procedure ensures comparison of similar services and compliance with CPI principles. Quality adjustment is essential to ensure that the price movement reported by the CPI is a “pure” price change, not due to a change in the level of services received by renters.
Changes in the rent CPI are often compared with average rent changes from other data sources. Such analyses are problematic, since the data used for the comparisons generally do not take into account quality changes in the stock of rental units. These changes, which often result from renovations or new units on the market, require adjustments to ensure that average rent changes reflect “pure” price movements.
Moreover, some comparison data correspond to advertised rental costs for vacant units. Research shows that the biggest rental price increases occur when a new tenant takes over a unit. Although rent may be freely negotiated between the landlord and a potential new tenant, this does not generally happen when a tenant renews its lease. Sitting tenants are usually protected by government regulations restricting the amount of rent increases. Which means that rental costs associated with advertised vacant units likely overestimate rental costs measured by the CPI. This is particularly true when units with higher rent increases tend to remain vacant for longer periods.
Owned accommodation in the Canadian CPI
Generally speaking, the cost of a housing service can be estimated by the rent charged to a tenant by the landlord. A change in the amount of rent paid, with the quality and quantity of the rental service remaining constant, would represent a price change.
However, a problem occurs when the landlord and tenant are one and the same. In this case, a housing service is used, but no rent is observed on the market. This makes the estimation of the expenditure weights and the price movements for owned accommodation one of the most difficult issues in consumer price index theory and practices.
There are many approaches to processing owned accommodation: payment, net acquisition, rental equivalence, user cost, and exclusion altogether. Depending on the main purpose of its CPI (indexation, deflation of expenditures or incomes, monitoring monetary policies), each statistical agency adopts a version of one of these approaches.
Conceptually, owned accommodation may be considered as an investment or as a consumption, or as a bit of both. In cases where it is considered to be a “pure” investment, any effects of price changes associated with the acquisition of a dwelling must be excluded from the CPI.
The “payment” approach is based on the assumption that the owned accommodation services correspond exactly to the value of total payments made by the homeowner such as mortgage payments and other operating expenses. Nearly all elements of the owned accommodation index in the official Canadian CPI represent monetary payments and would therefore be covered by this approach. These include mortgage interest costs, property taxes, homeowners’ insurance premiums, renovations and repairs, and other owned accommodation expenses. The only exception is the homeowners’ replacement cost, which represents essential expenditures to replace the loss of value due to normal depreciation of the dwelling. This component is imputed and does not represent an expenditure that is justified by any financial transaction. The “payment” approach is considered to be quite appropriate for a CPI that is primarily used for indexing monetary incomes.
The “net acquisition” approach consists of treating owner-occupied dwellings like all other durable goods in the CPI, which means attributing all dwelling purchase costs to the acquisition period, even if the useful life of the dwelling spans well beyond this period. For this option, net dwelling purchases in the reference year would be used as the expenditure weight for owned accommodation. Since it provides the possibility of instantly showing the impact of dwelling price changes on the CPI, the “net acquisition” approach has interesting characteristics for measuring price inflation and monitoring monetary policy. However, since it does not take into account the stream of services generated by the owned accommodation across time, it is less favoured for a CPI that is used primarily for indexation.
The “rental equivalence” approach estimates the cost of services generated by the use of an owner-occupied dwelling based on its rental value. Since this cost does not correspond to any financial transaction, it must be imputed using the rent paid by tenants for similar accommodations. The advantage of the “rental equivalence” approach is that services generated by owned accommodations are treated symmetrically in relation to rented accommodations. Given that it does not directly reflect changes in house prices on the CPI, it has limited usefulness for monitoring monetary policy. However, it is beneficial for a CPI that is primarily used for indexation.
The “user cost” approach is an estimate of the cost of the services provided by a housing unit based on the costs of owning and occupying a dwelling. It includes expenses in the form of payments, as well as imputed costs. For example, a landlord may incur interest costs during the period of occupancy (mortgage interest and/or opportunity cost associated with funds that are attached to the dwelling that could have otherwise earned interest), replacement costs and other operating costs such as renovations and repairs, property taxes and homeowners’ insurance premiums. The user cost also includes the anticipated capital gain, which is simply the expected change in the price of the dwelling over the observation period.
The owned accommodation index in the official Canadian CPI is based on a variant of the user cost concept. Its purpose is to measure changes in the cost of using a fixed stock of dwellings. It covers six essential components:
- Mortgage interest cost
- Replacement cost
- Property taxes
- Homeowners’ home and mortgage insurance
- Homeowners’ maintenance and repairs
- Other owned accommodation expenses
The basic principle is to treat homeowners as if they were renting their own dwelling. Any expenses that a landlord would normally incur are included (even imputed expenses such as the replacement cost). However, the capital gain and the opportunity cost associated with capital invested in the dwelling are excluded, since they are considered as investment rather than consumption.
The mortgage interest cost index estimates the impact of price changes on the amount of mortgage interest owed by the target population on its mortgage balance. It is the product of two components: a component estimating the impact of changing house prices and another measuring the impact of changes in interest rates. When house prices increase, the amount of the loan required to finance the purchase of a dwelling increases, which results in a corresponding increase in the interest cost, provided that the interest rate is constant. On the other hand, an increase in mortgage interest rates, mortgage balance remaining constant, also results in an increase in the interest amount owed.
The price associated with a mortgage balance is the average house price in the month of acquisition of the residence. The interest rate corresponds to the period when the loan was initiated or renegotiated. The interest owed on a stock of mortgages during the current month is therefore not only a function of house prices and interest rates in the current month, but also those for the previous months, aggregated according to the shares of new and existing mortgages.
Since the total value of houses purchased during a given period is always a small proportion of the total stock of dwellings, the total amount of mortgage interest owed each month continues to reflect the impact of past changes in house prices for a very long period. In reality, the house prices that enter into the estimation of the mortgage interest cost for each month represent the weighted average house price of the previous 25 years. The weights reflect the distribution of mortgage balances by mortgage vintage, such that older mortgages have a relatively lower weight. This is because newer mortgages generally have a higher principal owing than older mortgages. Past mortgage interest rates also continue to be reflected in the current month index, because new interest rates only affect the index through mortgages newly initiated or renegotiated. These are generally a rather small proportion of the stock of existing mortgages.
Since the Canadian owned accommodation index seeks specifically to reflect the cost of using an owner-occupied dwelling, the measurement includes the replacement or depreciation cost faced by the households who own their dwelling. Between 1949 and 1997, the depreciation rate used by Statistics Canada to estimate the replacement cost of an owner-occupied dwelling was 2% per year. In 1998, a study concluded that this rate was likely too high. Consequently, the depreciation rate was decreased to 1.5% per year.
Depreciation is not an actual payment, but rather a conceptual expense that must be imputed. It corresponds to the hypothetical amount required to replace the portion of the stock of owned accommodation used each year by the target population. It is derived from data extracted from the Survey of Household Spending. Respondents are asked how much they would expect to receive for their house if they were to sell it. This amount is multiplied by a ‘‘house/property’’ ratio to obtain an estimate of the value of the house, excluding the land, to which a depreciation rate of 1.5% is applied. For monthly price movements associated with replacement cost, a version of the New Housing Price Index (NHPI) which excludes price changes associated with the land is used.
The property tax index measures changes through time in the amount of taxes levied on a constant sample of dwellings in selected municipalities. This sample of property taxes paid, obtained from municipal offices, is used to obtain an estimate of the average property taxes by city. These average values are entered as prices in the current and previous periods’ unit value index calculation. Changes in property taxes are reflected once a year, in the October CPI.
The elementary indexes for homeowners’ maintenance and repairs, as well as other owned accommodation expenses, are estimated using the standard approach for calculating elementary price indexes.
The owned accommodation index is often the subject of discussion, as to whether it properly reflects the impact of changes in dwelling prices on the overall inflation level. More specifically, it is compared to data on dwelling prices or interest rates, sometimes arguing that housing inflation is under-estimated. However, it should be stated that the owned accommodation component of the official Canadian CPI was not specifically designed to be an indicator of housing prices inflation. There are several, sometimes competing uses of the CPI. As with other index components, the approach taken with respect to owned accommodation attempts to find a balance between the purposes for which it serves. The treatment of owned accommodation in the CPI serves well in providing an adequate indicator of price-induced changes in the purchasing power of the consumer dollar. In particular, it is meant to measure the impact of price changes on a selection of costs specific to homeowners.
As mentioned above, there is a general consensus that the acquisition approach is the most suitable for handling owned accommodation, when the primary use is tracking inflation in the housing market, since this approach makes it possible to automatically show the impact of changes in dwelling prices. On the other hand, an owned accommodation index like the one adopted by the Canadian CPI, based on the user cost approach does not seek to measure changes in dwelling prices. Its purpose is to determine changes in the cost of using a stock of dwellings. This makes it sensitive to past movements in housing prices, as well as imputed costs such as depreciation. Those wishing to use the CPI as an indicator of inflation in the housing market must be aware of the inherent limitations of such an approach, and should not expect it to produce an index that automatically tracks movements in dwelling prices.
Acknowledgements
The author would like to thank everyone who reviewed and contributed to this paper, particularly, Bradley Snider, Nathalie Brault, Dragos Ifrim, Richard Evans, Frederick Barzyk, Clement Yélou, Waruna Wimalaratne, Radu Chiru, Kyle de March, Elspeth Hazell, Christie Glover and Nathalie Bisson of the Consumer Prices Division (CPD).
- Date modified: