Statistics Canada
www.statcan.gc.ca
Common menu bar links

October 2007

Archived Content
Information identified as archived is provided for reference, research or recordkeeping purposes. It is not subject to the Government of Canada Web Standards and has not been altered or updated since it was archived. Please "contact us" to request a format other than those available.
Analysis
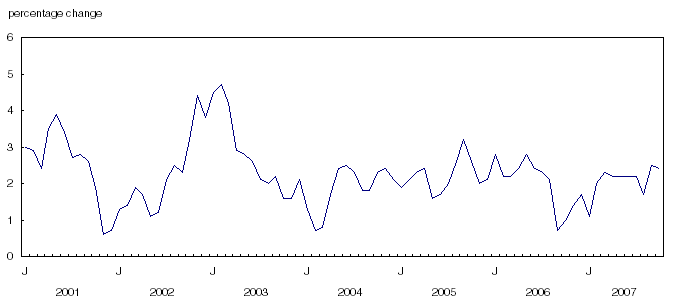
Consumer prices rose by 2.4% in October compared with the same month last year, a slightly slower rate of growth than the 2.5% posted in September.
Gasoline and the two main components of owned accommodation—mortgage interest cost and homeowners’ replacement cost—were the primary sources of October’s increase.
Excluding energy, the all-items index climbed 1.9% in the year to October 2007, a slowdown from the 2.1% growth recorded in September. Lower prices for the purchase and leasing of passenger vehicles were the main factor behind the slow down.
The Bank of Canada’s core index, used to monitor the inflation control target, increased by 1.8% between October 2006 and October 2007, a slowdown compared to the rate of 2.0% observed in September. This was the weakest growth of this index since June 2006. This slowdown was mainly the result of lower prices for the purchase and leasing of passenger vehicles.
On a month-to-month seasonally adjusted basis, consumer prices increased by 0.1% between September and October 2007 whereas the seasonally adjusted core index remained unchanged.
On a non-seasonally adjusted basis, consumer prices fell by 0.3% in October 2007 from the previous month, primarily the result of lower gasoline prices, while the core index was down 0.2%. Significant downward pressure on both indexes came from lower prices for traveller accommodation (-8.8%), passenger vehicles (-1.4%) and women’s clothing (-2.3%).
The all-items index excluding energy declined 0.1% between September and October following a 0.2% growth between August and September.
Gasoline drives growth in year-over-year consumer prices for a second straight month
The upward pressure on consumer prices between October 2006 and October 2007 was driven by gasoline, as it was in September.
In October 2007, the price at the pump rose 13.5% compared with the same month last year, a change due largely to a drop in last year’s gasoline prices.
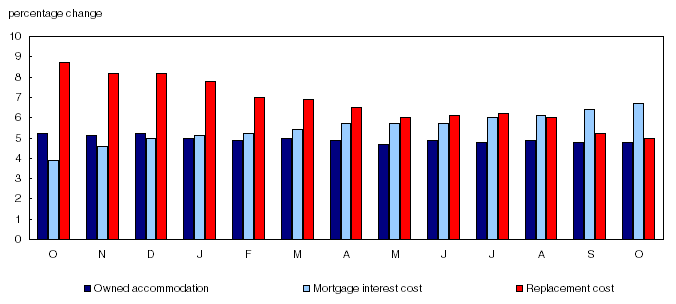
Upward pressure from the cost of owned accommodation (+4.8%) continued in October, due mainly to the growth in mortgage interest cost, homeowners’ replacement cost and property taxes.
Mortgage interest cost rose 6.7% in October compared with 6.4% in September. October’s growth was the highest since June 1991. This upturn is more a reflection of increases in amounts borrowed because of higher new housing prices than increases associated with the renewal of mortgage loans at higher rates.
The growth in homeowners’ replacement costs (+5.0%) has been slowing for several months and is now in line with the changes at the start of 2006. This slowdown follows the change in the evolution of new housing prices. Homeowners’ replacement cost represents the worn-out structural portion of housing and is estimated using new housing prices (excluding land).
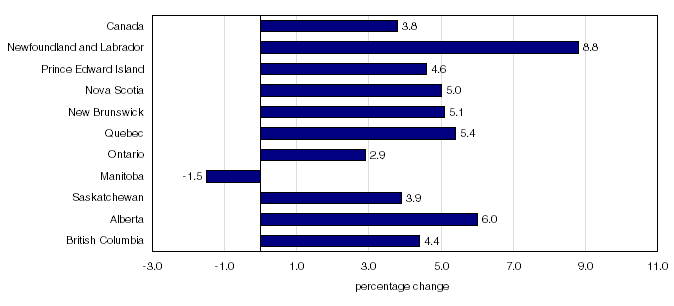
Property taxes were up 3.8% in October 2007 compared to October 2006. Property tax hikes were higher in Newfoundland and Labrador (+8.8%) and in Alberta (+6.0%). In both provinces, tax rates fell but a re-assessment of properties led to an increase in the amounts paid. The only province in which residents paid less in property tax was Manitoba (-1.5%). Properties were not assessed in this province in 2007 and the amounts paid out in property tax credits for education rose.
Canadians also had to pay 3.0% more for restaurant meals in October 2007 compared to the same month last year. Higher prices for dairy products and certain meats contributed to the increase, along with the cumulative impact of higher minimum wages in almost all provinces and territories during the 12-month period.
A 2.4% price decrease for the purchase and leasing price of passenger vehicles was the main factor in dampening the rise in consumer prices. This decline was due mainly to discounts given by manufacturers on 2007 models. This index continued the downward trend that began in July 2007.
Prices for fresh vegetables went down 14.6% in October. A year-over-year drop of this magnitude had not occurred since June 1996. It follows on the heels of the 9.2% drop recorded in September.
A 13.8% decline in prices for computer equipment and supplies also moderated the advance in the all-items index. However, this decline was weaker than decreases observed during the first eight months of 2007.
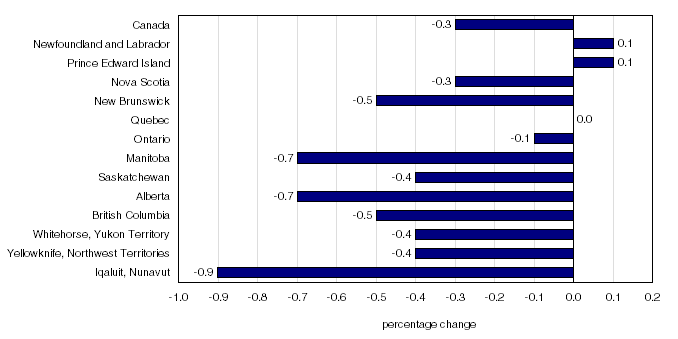
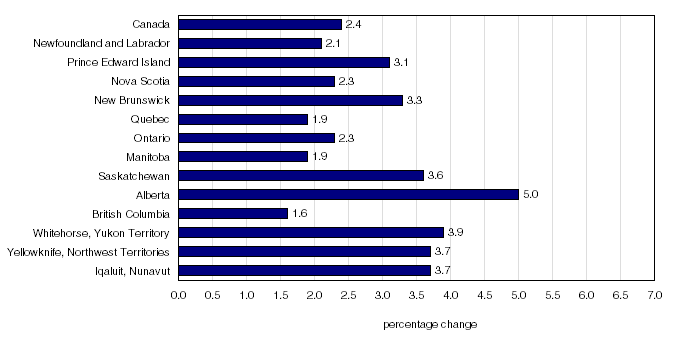
CPI growth faster in the Atlantic Provinces
Gasoline prices and mortgage interest cost were among the five main contributors to the rise in the all-items index in every province.
The 12-month change in the CPI accelerated in all Atlantic Provinces, where gasoline was among the main contributors to the acceleration.
The rate of growth in the CPI surpassed the national average in Prince Edward Island (+3.1%) and New Brunswick (+3.3%), along with Alberta (+5.0%) and Saskatchewan (+3.6%). CPI growth remained stable in Saskatchewan, but increased slightly in Alberta in response to a surge in natural gas prices and property taxes.
The upward movement of consumer prices slowed substantially in Manitoba (+1.9%), mainly because gasoline prices did not rise as much in October as in September and property taxes fell 1.5%.
Monthly change: Gasoline drags consumer prices down between September and October 2007
On a non-seasonally adjusted basis, consumer prices fell by 0.3% between September and October 2007, after posting growth of 0.2% in the previous month.
This turnaround stemmed mainly from changes in the variation in gasoline prices. On a monthly basis, gasoline prices fell 3.3% in October after a 0.8% rise between August and September.
The price of traveller accommodation also fell by 8.8% as the high season came to an end. This followed a comparable decline of 10.4% between September and October 2006.
A 2.3% decline in the price of women’s clothing also had a significant dampening effect on the all-items index. Lower prices stemmed from specials by several retailers.
The downward movement in these areas was partially offset by increases in other components, including property taxes, which were up 3.8%. Since the change in this component is calculated annually only, it has a significant impact on the monthly index.
A 0.8% gain in mortgage interest cost also played a large role, a pace unchanged from last month. The rise in new housing prices had a greater impact than the renewal of mortgage loans at higher interest rates in October.
The 3.3% increase in natural gas prices also moderated the drop in the all-items index.
Homeowners’ replacement costs fuel year-over-year growth in core index
The Bank of Canada’s core index rose 1.8% in October 2007 compared to October 2006, a downturn compared to the 2.0% growth in the month of September. This slowdown was mainly the result of lower prices for the purchase and leasing of passenger vehicles.
The core index is obtained by removing the effect of the changes in indirect taxes from the all-items CPI from which the eight most volatile components identified by the Bank of Canada have been excluded. These volatile components are fruit, fruit preparations and nuts; vegetables and vegetable preparations; mortgage interest cost; natural gas; heating oil and other fuels; gasoline; inter-city transportation; and tobacco products and smokers’ supplies.
On a non-seasonally adjusted basis, the core index decreased by 0.2% between September and October 2007, down from the 0.4% growth reported last month. Significant downward pressure came from lower prices for traveller accommodation (-8.8%), passenger vehicles (-1.4%) and women’s clothing (-2.3%).
The energy price index records its strongest growth since July 2006, driven by gasoline
The price index for energy products rose 8.6% between October 2006 and October 2007. This is the strongest growth in this index since July 2006 and was driven by the 13.5% jump in gasoline prices during this period. The 7.8% rise in natural gas prices as well as the 14.0% jump in prices for heating oil and other fuels also exerted upward pressure on this index. Higher prices for fuel, parts and supplies for recreational vehicles (+10.1%) and for electricity (+0.5%) also contributed, to a lesser degree, to the rise in this index.
On a non-seasonally adjusted basis, the energy index fell 1.5% between September and October 2007. This drop was mainly the result of the 3.3% decrease in gasoline prices and, to a lesser extent, the 1.0% decrease in prices for electricity. The drop in these components and others were only partially offset by higher prices for natural gas (+3.3%) and heating oil and other fuels (+1.6%).
The price of energy products drives growth in the goods index to its highest level since March 2007
Prices for consumer goods were up by 1.4% in October 2007 compared to the same month last year. Growth this significant has not been seen since March 2007.
Increases in October were due solely to higher prices for non-durable goods (+3.2%), which were mainly driven by higher gasoline prices (+13.5%). The annual growth in the price of non-durable goods is the largest since March 2007. It was partially offset by the slide in the prices of fresh vegetables (-14.6%). Lower prices for durable goods (-2.0%) only partially moderated the growth in prices of non-durable goods.
Drop in prices for purchase of passenger vehicles (-2.5%), computer equipment and supplies (-13.8%), and video equipment (-8.7%) applied strong downward pressure on the durable goods index.
Between September and October 2007, on a non-seasonally adjusted basis, the goods index shrank by 0.6%. The change was due to lower prices for non-durable goods (-0.7%) and durable goods (-1.3%). Semi-durable goods did not change during this period.
The slide in prices of non-durable goods came primarily as a result of a drop in gasoline prices (-3.3%) and, to a lesser degree, in the price of non-alcoholic beverages (-2.6%). The downturn in prices for durable goods was mainly driven by the decrease in prices for vehicle purchases (-1.5%).
The price of services rose 3.5% in October 2007 compared to October of last year. This increase was primarily due to the rise in mortgage interest cost (+6.7%) and homeowners’ replacement cost (+5.0%) during this period.
Between September and October, on a non-seasonally adjusted basis, the price of services rose only 0.2% compared to 0.3% between August and September. This slight slowdown stemmed mainly from the downturn in the price of traveller accommodation (-8.8%). Contributing the most to the monthly rise in price of services were property taxes (+3.8%) and mortgage interest cost (+0.8%).
Seasonally adjusted CPI increases by 0.1% between September and October
The all-items index increased 0.1% between September and October. The components that exerted upward pressure were shelter (+0.8%), clothing and footwear (+0.1%), and alcoholic beverages and tobacco products (+0.1%). Lower prices for transportation (-1.5%) and food (-0.3%) partially offset those upward pressures. The indexes of main components for household operations, furnishing and equipment, health and personal care, and recreation, education and reading remained unchanged between September and October.
The seasonally adjusted core index as defined by the Bank of Canada remained unchanged between September and October 2007.