Statistics Canada
www.statcan.gc.ca
Common menu bar links

September 2007

Archived Content
Information identified as archived is provided for reference, research or recordkeeping purposes. It is not subject to the Government of Canada Web Standards and has not been altered or updated since it was archived. Please "contact us" to request a format other than those available.
Analysis
In September 2007, consumers paid 2.5% more for goods and services included in the consumer price index (CPI) basket than they did in September 2006–well above the 1.7% rise posted in August. This is the highest year-over-year increase recorded since May 2006.
The 0.8 percentage point acceleration was due mainly to a rise in the price of gasoline, largely the result of higher gasoline prices in September 2007 compared to low levels in September 2006. The rise in gasoline prices was nationwide and was the primary cause for the increase of the 12-month CPI in most provinces.
In addition to gasoline prices, mortgage interest cost also pushed up the 12-month change in the CPI in September. These gains, however, were partially offset by lower prices for natural gas and computer equipment and supplies.
The year-over-year growth of the all-items index excluding energy subsided in September, advancing by 2.1%, down from the 2.3% annual rate of growth posted in the previous month. The drop in prices for computer equipment and supplies and for the purchase and leasing of passenger vehicles were the primary causes of the deceleration in the all-items index excluding energy.
The Bank of Canada’s core CPI rose by 2.0% between September 2006 and September 2007, a deceleration from the 2.2% recorded in August 2007. This was the lowest rate of growth in the core CPI since August 2006.
The price index for energy products accelerated by 6.1% in September 2007 compared with September 2006–a major turnaround from the 3.7% drop posted in August. On a monthly basis, the energy index slightly rose by 0.1% between August and September 2007.
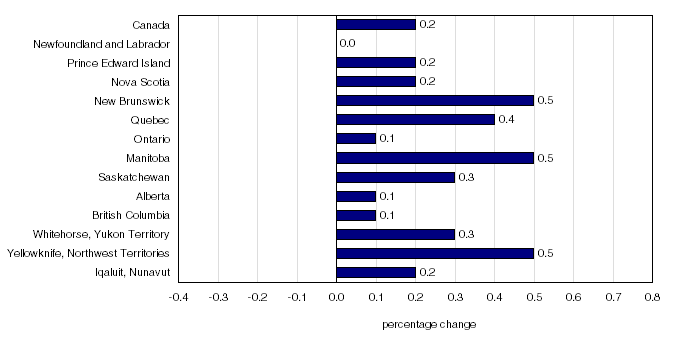
On a month-to-month basis, the all-items CPI rose by 0.2% between August and September 2007, after declining by 0.3% between July and August. This increase was due primarily to a rise in prices for women’s clothing, the purchasing and leasing of passenger vehicles and post-secondary education.
After adjustments for seasonal variations, the all-items CPI edged up by a robust 0.4% from August to September 2007, a significant advancement compared to the zero rate of growth posted in the previous month.
The CPI excluding energy advanced 0.2% between August and September 2007, after posting zero growth in the previous month. Between August and September 2007, the core index rose 0.4%, faster than the 0.1% rate of growth recorded in the previous month.
Twelve month change: Higher gasoline prices exerted strong upward pressure
The Consumer Price Index (CPI) rose 2.5% in September 2007 compared to the same month of the previous year–a sharp acceleration from the 1.7% growth posted in August 2006. This is the highest rate of growth posted since May 2006 and is well above the 1.7% average of the CPI over the 12 months before September 2007.
Gasoline prices were the main source behind the 2.5% climb in consumer prices between September 2006 and September 2007.
The year-over-year increase in gasoline prices (+12.7%) owed more to a sudden drop in last year’s prices than to any significant developments in the most recent month. Indeed, on a month-to-month basis, gasoline prices barely budged, rising by a mere 0.8% from August to September 2007.

In addition to gasoline, owned accommodation also pushed up the 12-month change in the CPI in September. Homeowner’s replacement cost, which represents the worn-out structural portion of housing, and mortgage interest cost, were the primary drivers of the increase in costs to Canadian homeowners.
Over time, mortgage interest cost has become an increasingly important driver of the overall change in owned accommodation. Between September 2006 and September 2007, mortgage interest cost rose by 6.4%, compared with 6.1% in August. This is the highest rate of growth recorded since June 1991.
Homeowners’ replacement costs were 5.2% higher in September 2007 than they were a year earlier. However, the contribution of this component to owned accommodation has been tapering off.
Overall, costs associated with owned accommodation increased by 4.8% in September 2007 compared with September 2006, close to the relatively constant trend of 5.0% realized over the preceding 12 months.

Housing costs also accelerated due to a 2.1% and 9.0% rise in the prices of electricity and water, respectively.
Food prices increased by 1.9% in September 2007 compared with the same month of the previous year, primarily the result of a 3.3% year-over-year rise in the price of food purchased from restaurants. This increase was partially offset by declines in the price of fresh vegetables and fresh fruit.
Despite these increases, consumers got some relief from a decline in natural gas prices. The price of natural gas contracted by 7.6% in September 2007 compared with September 2006, following a moderate increase of 0.6% in the previous month.
In addition to natural gas, year-over-year price declines for computer equipment and supplies, the purchasing and leasing of vehicles, fresh vegetables and fruit, women’s clothing and video equipment also moderated the rise in consumer prices in September.
Price declines for computer equipment and supplies (-13.9%) and video equipment (-9.7%) continued in September 2007 compared with September 2006. However, the ongoing contraction in the price of computer equipment and supplies has been slowing down.
For the third consecutive month, consumers continued to pay less for the purchasing and leasing of passenger vehicles. The 1.0% downturn in the price of vehicle purchases and leases in September 2007 compared with September 2006 marginally offset the upward movement in consumer prices.
Consumers were also able to take advantage of price decreases for fresh vegetables (-9.2%) and fruit (-4.2%) in September 2007, both of which contracted in price for the third consecutive month. Year-over-year price decreases were observed for all components of fresh vegetables (potatoes, tomatoes, lettuce and other fresh vegetables)–pushing fresh vegetable prices down to their lowest level since September 2004.
Price increases higher than national average in four provinces
On a year-over-year basis, consumer prices increased at a faster pace than the national average in only four provinces in September: New Brunswick (+2.9%), Manitoba (+2.8%), Saskatchewan (+3.8%) and Alberta (+4.6%).
Consumers in Newfoundland and Labrador (+1.3%), Quebec (+1.9%) and British Columbia (+1.9%) experienced the most modest increase in consumer prices in September.
Momentum of the year-over-year change in the CPI picked up in September 2007 compared with August 2007 for all provinces except Alberta. The 12-month CPI in Alberta slowed to 4.6% this month, down slightly from the 4.7% reported in August. This was the lowest level of growth in consumer prices in this province since the beginning of the year.
The primary cause for the fall in consumer prices in Alberta was the year-over-year drop in natural gas prices (-28.7%) and a deceleration in the cost of owned accommodation.
The year-over-year costs for owned accommodation slowed in Alberta to 12.0% in September, down from the 13.9% reported in August. Decelerations in the growth of mortgage interest and replacement costs were primarily responsible for the slowdown in owned accommodation.
Gasoline was the primary source of the rise in the 12-month CPI for most provinces. For the most part, double digit growth of gasoline prices occurred in all provinces in September 2007 compared with September 2006.
The rise in gasoline prices ranged from a hefty 18.4% in Alberta to a more moderate 3.2% in New Brunswick. British Columbia, Newfoundland and Labrador, Prince Edward Island and New Brunswick were the only provinces which did not witness a double digit growth in gasoline prices.
In New Brunswick, a 17.9% jump in the year-over-year price of electricity drove the growth of the CPI above the national level.
Much of the cross provincial variation in the 12-month CPI was due to differences in the change of costs for owned accommodation. Owned accommodation continued to be a principle source of growth in consumer prices in September due primarily to increases in homeowners’ replacement cost and mortgage interest cost.
In Saskatchewan, homeowners’ replacement costs shot up 44.8% between September 2006 and September 2007. This compares to increases of 13.0% observed for homeowners in Alberta, 8.3% in Manitoba and 7.6% in Nova Scotia. The year-over-year growth of homeowners’ replacement cost in all other provinces was below the national average (+5.2%).
Month-over-Month: Price of women’s clothing pushes monthly CPI ahead
From August 2007 to September 2007, consumer prices edged up by 0.2%. The price change in women’s clothing (+5.9%) was the primary driver of the month-over-month rise in the all-items CPI, caused by the arrival of the new women’s collections in retail outlets.
It was accompanied by a 1.1% price increase for the purchase and leasing of passenger vehicles. This was the result of a decrease in incentives offered by car manufacturers in September.
The costs of obtaining a post-secondary education also drove up consumer prices in September. Students paid 3.0% more for their tuition fees in 2007. Higher tuition fees in Ontario (+4.1%) explained most of the upward trend in this index.
Also exerting upward pressure, but to a lesser extent, were a 0.8% increase in mortgage interest cost, a 0.8% gain in gasoline prices and a 2.3% increase for child care.
These price increases were partially offset by declines for fresh vegetables (-8.9%), air transportation (-4.9%), fresh fruit (-6.4%) and natural gas (-2.3%). The decline in natural gas prices was largely due to a 14.2% monthly drop in the price for natural gas in Alberta.
The month-over-month price of vegetables contracted for the seventh consecutive month, following a surge in fresh vegetable prices in February 2007.
A substantial 15.7% decline in the price of potatoes between August and September, as a result of seasonal factors, was the primary cause for the month-over-month decline in vegetable prices.
The Bank of Canada’s core index increases 2.0%
The Bank of Canada's core index increased by 2.0% in September compared to the same month last year, a deceleration from the 2.2% posted in August. This was the lowest rate of growth in the core CPI since August 2006. In the 12-months leading up to September 2007, this price index realized an average growth rate of 2.3%.

Upward pressure on this index came primarily from homeowners' replacement cost and restaurant meals.
On a monthly basis, the core index rose by 0.4% in September, faster than the 0.1% rate of growth recorded in the previous month. Upward pressure came mainly from women’s clothing, the purchase and leasing of passenger vehicles and post-secondary education. If seasonal effects are removed, the core index posted a 0.1% increase between August and September 2007.
The core index is obtained by removing the effect of the changes in indirect taxes from the all-items CPI from which the eight most volatile components identified by the Bank of Canada have been excluded. These volatile components are fruit, fruit preparations and nuts; vegetables and vegetable preparations; mortgage interest cost; natural gas; heating oil and other fuels; gasoline; inter-city transportation; and tobacco products and smokers’ supplies.
Energy index posts its fastest growth since August 2006
The price index for energy products was up by 6.1% in September 2007 compared with September 2006–a major turnaround from the 3.7% drop posted in the previous month. This was the largest increase in this index since August 2006 and it was largely driven by the 12.7% jump in gasoline prices between September 2006 and September 2007.
During the same time period, prices for electricity (+2.1%), fuel, parts and supplies for recreational vehicles (+9.7%) and heating oil and other fuels (+2.1%) also exerted a strong upward pressure on this index. The 7.6% drop in natural gas prices during this period, however, slowed down the rise of the energy index.
The energy index slightly rose by 0.1% between August and September 2007. Upward pressure from gasoline prices (+0.8%) was almost entirely offset by significant downward pressure coming from the price of natural gas (-2.3%). Heating oil and other fuels (+0.8%) as well as fuel, parts and supplies for recreational vehicles (+0.8%) also pushed up the energy index, while a slight decrease in electricity prices (-0.1%) helped to move the index down.
On a year-over-year basis, lower prices for durable goods slightly offset upward pressures coming primarily from non-durable goods
In September 2007, the prices for goods were up by 1.3% compared to the same month last year, after declining by 0.4% in August. The upward pressure observed in September came only from the 2.9% price increase in non-durable goods. Prices for durable goods (-0.9%) and semi-durable goods (-0.6%) exerted a downward effect on this index.
The upward pressure on the non durable goods price index during this period came mainly from the 12.7% jump in gasoline prices. Lower prices for computer equipment and supplies (-13.9%) and the purchase of automotive vehicles (-1.0%) exerted downward pressure on the durable goods index, while women’s clothing (-3.4%) was the main source behind the decrease in the semi-durable goods index.
On a monthly basis, the goods index increased by a moderate 0.1%. The combined effects of the increase in prices for semi-durable goods (+1.9%) and durable goods (+0.3%) were only partially offset by the decrease in the non-durable goods (-0.4%).
Between August and September 2007, the increase in prices for semi-durable goods was largely accounted for by higher prices for women’s (+5.9%) and men’s (+0.6%) clothing. Higher prices for vehicle purchases (+1.2%) mainly pushed up the durable goods index, while lower prices for natural gas (-2.3%) exerted significant downward pressure on the non-durable goods index.
Prices for services rose by 3.6% in September 2007 compared with September 2006, a slight decrease from the previous 3.8% annual rate of growth posted in August. This increase was primarily driven by the rise in mortgage interest cost (+6.4%) and homeowners' replacement cost (+5.2%) over the last twelve months.
On a monthly basis, prices for services rose by 0.3% between August and September 2007, identical to the rate of growth posted between July and August. Upward pressure came mainly from tuition fees (+3.0%) and mortgage interest cost (+0.8) this month.
Seasonally adjusted CPI increases by a robust 0.4% between August and September
After adjustments for seasonal variations, the all-items CPI increased by a robust 0.4% between August and September 2007–up significantly from the zero rate of growth posted in August. The seasonally adjusted core index as defined by the Bank of Canada increased by 0.1% between August and September 2007, similar to the rate of growth posted in August.