Highlights
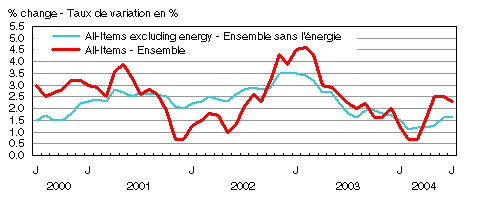
In July 2004, Canadian consumers paid 2.3% more than they did
in July 2003 for the goods and services included in the Consumer
Price Index (CPI) basket. However, the 12-month increase in the All-items
excluding energy index was identical to June’s at 1.6%.
Gasoline prices
were again by far the main contributor to the rise in the CPI. However,
the 12-month increase in gasoline prices slowed from
24.5% in June to 17.9% in July. This slowdown impacted the 12-month
change in the All-items index, which fell from 2.5% in June to 2.3%
in July.
The All-items index excluding the eight volatile components identified
by the Bank of Canada rose by 1.9% from July 2003 to July 2004.
This follows a 1.7% rise in June.
Between June and July, the CPI fell by 0.1% mainly as a result of the
3.5% decline in gasoline prices. Gasoline prices have fallen by 6.7%
in the last two months after rising 29.4% in the previous five months.
Percentage Change from the Same Month of the Previous Year, Canada
Adjustments to CPI basket weights effective this month
Statistics Canada has determined that the weights assigned to "mortgage
interest cost" were too high in the CPI basket update effective January
2003. The effect on the Canada All-items CPI has been very small, within
the rounding factor of the index.
Effective with this release, the weight for "mortgage interest cost"
has been reduced and as a result, the weights of all other commodities
have increased proportionally. The adjusted CPI basket weights are
in this publication, as well as in the Documentation section at /imdb-bmdi/2301-eng.htm.
For more information, contact Rebecca McDougall (1-866-230-2248; 613-951-9606;
fax: 613-951-1539), Prices Division.
Twelve-month percentage change in the CPI: +2.3%
Twelve-month percentage change in the CPI excluding energy: +1.6%
In July, the CPI registered a slightly smaller 12-month increase
than in the previous two months, increasing 2.3% compared to 2.5% in
May and June. While higher gasoline prices were by far the main contributor
to the 12-month increase in the CPI, upward pressure was also exerted
by homeowners’ replacement cost, cigarettes, homeowners’ insurance
premiums, tuition fees and restaurant meals.
Dampening these increases
were lower prices for fresh vegetables, computer equipment and supplies
and leasing of automotive vehicles.
Gasoline prices were up 17.9% from July 2003. Substantial price
increases were observed in all provinces, with the highest in Prince
Edward Island (+28.1%) and the lowest in Saskatchewan (+15.1%).
Homeowners’ replacement cost, which represents the worn out
structural portion of housing and is estimated using new housing prices
(excluding
land), rose 7.1% from July 2003. Favourable market conditions
and higher material and labour costs across Canada are the main factors
behind this increase.
Increases in tobacco taxes in the last 12 months explain most of the
7.5% rise in the price of cigarettes since July 2003.
Homeowners’ insurance premiums were up 13.3% on average.
The 8.1% increase in tuition fees continues to impact the 12-month
increase in the CPI, although they are collected only once a year,
in September.
Restaurant meal prices rose 2.6%. This increase combined with the
6.9% increase in meat prices contributed to push the food index upward
by 1.9% from July 2003. Increases in meat prices ranged from 1.9%
for “other poultry” to 10.8% for pork.
However, prices for
fresh vegetables dampened these increases, falling 11.7% from July 2003 to July 2004. This decline is due
mostly to better crops than last year in all categories of vegetables,
especially for lettuce (-24.7%) and “other fresh vegetables” (-11.5%).
Computer equipment and supplies prices fell 15.3% as prices for desktops
and laptops decreased.
Prices for the leasing of automotive vehicles fell 5.4% as a result
of financing incentives offered over the last 12 months.
Monthly percentage change in the CPI: -0.1%
Monthly percentage change
in the CPI excluding energy: +0.1%
The CPI fell 0.1% from June to July. Downward pressure came mostly
from lower prices for gasoline. Weaker prices for fresh vegetables
and women’s footwear also contributed to this decrease, although
to a lesser degree. Higher traveller accommodation prices exerted a
slight dampening effect on these downward pressures.
Gasoline prices fell for a second consecutive month after increasing
in the previous five months. Prices fell 3.5% in Canada from June to
July 2004, with all provinces and territories posting price decreases.
Prices fell the most in Alberta, declining 8.6%, while Ontario residents
experienced the smallest decrease at only 1.6%.
Consumers can now take
advantage of domestic produce and therefore experienced a 5.8% decline
in fresh vegetable prices in July 2004.
Lower prices for “other fresh vegetables”, tomatoes and
lettuce contributed to this decrease. Higher prices for new potatoes,
which are imported from the United States since new domestic crops
are not yet available, dampened these decreases.
Women’s footwear prices fell 5.7%, due mostly to end-of-season
specials.
In July, consumers paid 4.7% more for traveller accommodation than
in June. This follows a 6.0% rise in June. July’s increases ranged
from 0.4% for residents of Newfoundland and Labrador to 7.5% for Quebec
residents. These increases are again attributable to the peak tourist
season across the country.
The seasonally adjusted CPI remained steady from June to July 2004
After seasonal adjustment, the CPI remained unchanged from June to
July 2004.
Upward pressure was exerted by higher seasonally adjusted indexes
for shelter (+0.2%), health and personal care (+0.3%), food (+0.1%)
and alcoholic beverages and tobacco products (+0.1%).
Counterbalancing
these increases were lower seasonally adjusted indexes for transportation
(-0.6%), clothing and footwear (-1.6%), and household
operations and furnishings (-0.1%). There was no change in the
seasonally adjusted index for recreation, education and reading.
Special aggregates
All-items excluding the eight most volatile components (Bank of Canada definition)
The All-items index excluding the eight volatile components identified
by the Bank of Canada increased 1.9% from July 2003 to July 2004.
The main contributors to this increase were homeowners’ replacement
cost (+7.1%), homeowners’ insurance premiums (+13.3%), tuition
fees (+8.1%) and electricity (+4.6%).
From June to July 2004, the
All-items index excluding the eight volatile components identified
by the Bank of Canada registered an
increase of 0.2%. Price increases for traveller accommodation (+4.7%),
homeowners’ replacement cost (+0.7%) and electricity (+0.7%)
exerted upward pressure on the index, which was partially offset by
lower prices for clothing (-1.0%) and women’s footwear (-5.7%).
Energy
The energy index rose 10.7% from July 2003 to July 2004,
due mostly to gasoline prices, which rose 17.9% in this period. Higher
prices for electricity (+4.6%), fuel oil (+10.7%) and for fuel, parts
and supplies for recreational vehicles (+10.5%) also contributed to
the increase. However, natural gas prices fell 0.3% from 12 months
ago.
On a monthly basis, the energy index decreased 1.6%, forced down by
lower prices for gasoline (-3.5%), fuel, parts and supplies for recreational
vehicles (-1.8%) and natural gas (-0.2%). This decrease was dampened
by price increases in electricity (+0.7%).
Goods and services
Prices in the goods sector rose by 2.3% from July 2003 to July 2004,
down from the 2.7% advance registered in June. Gasoline prices were
again the main factor of July’s increase with a 12-month advance
of 17.9%, largely contributing to push the non-durable index up by
4.6%. However, durable goods prices fell on average 1.1%, with the
prices for computer equipment and supplies (-15.3%) being the main
contributor. The semi-durable goods index also exerted downward pressure,
falling 0.7%, mostly due to lower prices for women’s clothing
(-1.5%), toys, games and hobby supplies (-3.2%), athletic footwear
(-4.5%) and kitchen utensils (-10.0%). These decreases were partially
counterbalanced by higher prices for bedding and other household textiles
(+4.6%), newspapers (+3.3%) and magazines and periodicals (+5.1%).
The services index rose 2.4% from July of last year. Higher homeowners’ replacement
cost (+7.1%), homeowners’ insurance premiums (+13.3%) and tuition
fees (+8.1%) were the key factors in this increase. These effects were
somewhat offset by lower prices for leasing of automotive vehicles
(-5.4%) and traveller accommodation (-3.7%).
Decreases in the non-durable (-0.5%), semi-durable (-0.9%) and durable
(-0.1%) goods indexes led to a 0.4% decline in the goods index between
June and July 2004. Lower prices for gasoline, women’s footwear
and “other furnishings” were the main factors of the decrease
in, respectively, the non-durable, semi-durable and durable goods indexes.
From
June to July 2004, the cost of services increased 0.3% on
average. A large part of this increase came from higher traveller accommodation
prices and homeowners’ replacement costs.
|


