Highlights
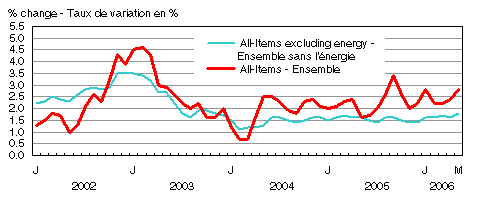
The Consumer Price Index (CPI) posted a 2.8% rise in May 2006 over the same month last year. This was a substantial increase over the 2.4% change observed between April 2005 and April 2006, the main reason being the sharper decline in gasoline prices between April and May of last year as compared to the decrease recorded this year.
Excluding energy prices, the 12-month change in the CPI increased from 1.6% in April to 1.8% in May.
The 12-month change in the All-items CPI excluding the eight volatile components identified by the Bank of Canada for the purposes of monetary policy climbed to 2.0% in May 2006, up from the 1.6% rise of the previous month. This was the strongest change in this index since the 2.2% increase recorded in December 2003.
In May 2006, the All-items index rose 0.5%, an increase identical to that observed in the two previous months. After slipping 0.1% in April, the All-items excluding energy index was up 0.5%, the strongest monthly increase since November 2004.
The same trend was displayed by the All-items index excluding the eight volatile components identified by the Bank of Canada. This index increased 0.5% in May, following a 0.1% drop the previous month.
Twelve-month percentage change in the CPI: +2.8%
Twelve-month percentage change in the CPI excluding energy: +1.8%
In May 2006, the CPI posted a 2.8% increase as compared to May 2005. The higher price of gasoline paid by consumers at the pump was the main source of this rise, followed by homeowners’ replacement cost and electricity prices. However, these rises were attenuated slightly by lower prices for computer equipment and supplies, and video equipment.
The 12-month change in the gasoline price index continued its upward trend, rising from 15.8% to 18.6%. The main reason is that gasoline prices declined sharply (-3.1%) in May 2005 but very little this year (-0.8%). Price increases of more than 17% were recorded in all provinces, with the most significant (+22.9%) occurring in Alberta. The higher price of crude oil on international markets over the past year explains this widespread increase in gasoline prices across Canada, contributing to the increase in the All-items CPI.
Homeowners’ replacement cost, which represents the worn out structural portion of housing and is estimated using new housing prices (excluding land), increased by 7.2% between May 2005 and May 2006. All provinces showed increases, with Alberta posting the highest (+29.8%), four times greater than for Canada as a whole. The rise in housing starts in that province exerted upward pressure on material and labour costs, thereby contributing to the increase in the CPI.
Electricity prices climbed 6.2% between May 2005 and May 2006. Ontario posted the strongest price increase (+10.3%), largely because of the rate increases approved recently by the Ontario Energy Board that took effect in May. These increases, added to the 4.3% rise recorded last April in Quebec, pushed up the national electricity index in the last year. Deregulation in the energy production sector in recent years has resulted in greater price volatility.
Percentage Change from the Same Month of the Previous Year, Canada
Mitigating the upward trend in the 12-month All-items index, the computer equipment and supplies index dropped 14.1%. Prices for video equipment, which were down 11.8%, also had a moderating effect on the rise in the CPI. The decreases in prices are the combined effect of a number of factors. Among others, the higher Canadian dollar made it possible to purchase imported products at a lower cost. Technological progress has also led to a reduction in manufacturing costs for these categories of products.
Impact on CPI of decrease in Goods and Services Tax
The Government of Canada recently announced that the rate in effect for the Goods and Services Tax (GST) will be reduced from 7% to 6% as of July 1, 2006. Since the price changes measured by the CPI take into account the value of the consumption taxes paid by Canadians, this 1% decrease will have an impact on the change in the CPI. A rough estimation of the impact of this decrease on the level of the CPI suggests a decrease in the order of 0.6%. This estimation is based on the assumption that the entire amount of the decrease will be transferred to consumers and that the industrial structure that underlies the way that prices are determined will remain the same. Since some products, such as many foods sold in supermarkets, are exempt from GST, the resulting decrease will necessarily be less than 1%.
Monthly percentage change in the CPI: +0.5%
Monthly percentage change in the CPI excluding energy: +0.5%
Between April and May 2006, the All-items index increased 0.5%. Upward pressure on the CPI came mainly from higher prices for traveller accommodation and electricity. However, this overall upward trend was partly mitigated by lower prices for gasoline, automotive vehicles and natural gas.
Prices for traveller accommodation were up 17.3%, many hotel operators having started to charge their summer rates. This seasonal pattern is usual, since each year this sector of the CPI posts increases in May. However, the fluctuation is greater this year due to very high occupancy rates posted in many canadian cities leading to price jumps.
Electricity prices climbed 3.9% between April and May 2006. The rise came mainly from the 11.0% increase recorded in Ontario as a result of the rate hike approved by the Ontario Energy Board that took effect in May.
Exerting downward pressure on the All-items index, gasoline prices slid 0.8% between April and May 2006. Prices at the pump nonetheless fluctuated differently across Canada. While Ontario (-3.3%) and Quebec (-2.7%) posted decreases, British Columbia (+5.2%) and Alberta (+2.8%) were the largest contributors to the upward effects.
Prices for the purchase and leasing of automotive vehicles fell by 0.5% in May, adding to the downward pressure on the CPI. Financial incentives offered by some automobile manufacturers pushed this index down.
The 0.8% drop in natural gas prices also brought down the All-items index. In Alberta, the 3.8% decrease in natural gas prices was the main contributor to this drop. In Quebec, the 2.4% increases recorded in the Montreal area nonetheless pushed the index up.
The seasonally adjusted CPI increases by 0.2% between April and May
After being adjusted for seasonal variations, the CPI increased by 0.2% between April and May 2006. Upward pressure came mainly from the shelter component (+0.7%) due to electricity rate hikes in Ontario, but also from the recreation, education and reading component (+0.5%) due to price increases observed in traveller accomodation.
The seasonally adjusted index was pushed down mainly by the indexes for alcoholic beverages and tobacco products (-0.4%) and for transportation (-0.1%).
The seasonally adjusted CPI excluding the eight volatile components identified by the Bank of Canada increased 0.4% between April and May 2006. This represents the biggest increase of this index since May 2003. Electricity prices had then greatly fluctuated due to a return provided to Ontario residents by the provincial government.
Special aggregates
The All-items index excluding the eight volatile components identified by the Bank of Canada
One of the elements used by the Bank of Canada to measure core inflation for the purposes of monetary policy is the CPI without the eight volatile components identified by the Bank. The 12-month increase in this index was 2.0% in May 2006. The major factors that contributed to this rise were homeowners’ replacement cost (+7.2%), the purchase and leasing of automotive vehicles (+2.2%), electricity prices (+6.2%), and restaurant meals (+3.0%). The increase was offset by lower prices for computer equipment and supplies (-14.1%), video equipment (-11.8%), and men’s clothing (-2.1%).
Between April and May 2006, the All-items index excluding the eight volatile components identified by the Bank of Canada was up 0.5%. This increase follows a 0.1% decrease observed the previous month. This represents the strongest increase in this index since November 2004. The main factors exerting upward pressure were traveller accommodation (+17.3%), electricity (+3.9%) and homeowners’ replacement cost (+1.0%). Factors that pushed down the index were the purchase and leasing of automotive vehicles (-0.5%), bread (-1.1%) and pork (-2.3%).
Energy
After rising 7.4% in March and 11.2% in April, the energy index continued its climb between May 2005 and May 2006 with a 14.1% increase.
Although all components contributed to the increase in the energy index, the gasoline index (+18.6%) was the main factor, followed by electricity (+6.2%), natural gas (+15.6%), fuel oil (+13.5%), and fuel, parts and supplies for recreational vehicles (+11.7%).
On a monthly basis, the energy index was up 0.6% between April and May 2006, primarily because of higher electricity prices (+3.9%), which offset the decrease in gasoline prices (-0.8%). The fuel oil index (+1.9%) pushed up the energy index, but the indexes for natural gas (-0.8%), and fuel, parts and supplies for recreational vehicles (-0.2%) brought it down.
Goods and services
The goods index rose 3.0% between May 2005 and May 2006. This increase can be attributed to the rise in prices for non-durable goods (+5.3%), with semi-durable goods (-1.0%), and durable goods (-0.1%) posting decreases.
In May, the upward trend in the non-durable goods index could be explained by higher prices for gasoline (+18.6%), electricity (+6.2%) and natural gas (+15.6%). These price increases were partly offset by lower prices for pork (-6.1%), fresh fruit (-1.8%), and ham and bacon (-5.2%).
The 1.0% decrease in the semi-durable goods index can largely by accounted for by lower prices for men’s clothing (-2.1%) and toys, games and hobby supplies (-4.1%). It was partly mitigated by higher prices for magazines and periodicals (+4.7%).
The durable goods index was down 0.1%, primarily as a result of lower prices for computer equipment and supplies (-14.1%) and video equipment (-11.8%). Higher prices for automotive vehicles (+2.3%) and wood furniture (+3.2%) counterbalanced the downward trend.
The services index in May 2006 was up 2.8% over May of last year. Increases in homeowners’ replacement cost (+7.2%), property taxes (+3.2%), and restaurant meals (+3.0%) accounted for most of this increase. Most of the downward pressure was created by lower costs for travel tours (-0.9%).
On a monthly basis, the goods index was up 0.3% between April and May, mainly owing to the upward trend in the non-durable goods index (+0.5%) as well as the index for semi-durable goods (+0.3%). The durable goods index posted a decrease (-0.1%).
Higher electricity prices (+3.9%) were the main contributor to the rise in the non-durable goods index, while higher prices for men’s clothing (+0.7%) accounted for most of the increase in the semi-durable goods index. The drop in purchase prices for automotive vehicles (-0.5%) partly explains the downward trend in the durable goods index.
Between April and May, the cost of services rose 0.6%. The increase comes mainly from higher prices for traveller accommodation (+17.3%) and homeowners’ replacement cost (+1.0%).
|


