
New findings on who controls Canadian corporations and how this has changed over the last 10 years
2007 to 2016

Archived Content
Information identified as archived is provided for reference, research or recordkeeping purposes. It is not subject to the Government of Canada Web Standards and has not been altered or updated since it was archived. Please "contact us" to request a format other than those available.
by Pamela Kinga Gill, Industrial Organization and Finance Division
This report is a special release intended to highlight new insights into the extent of foreign control in the Canadian corporate economy from 2007 to 2016. It illustrates changes in foreign control by macro‑region and country for financial and non‑financial industry groupings.
Introduction
Statistics Canada administers the Corporations Returns Act (CRA) which collects ownership information on corporations conducting business in Canada. Information is collected to better understand the extent to which foreign control is prevalent in Canada.
This report focuses on three key financial variables which are used to measure foreign control: total assets; operating revenues and operating profitsNote 1.
- Total assets are the sum of total of economic resources over which an enterprise exercises a certain control. Included are cash and deposits; accounts receivable and accrued revenue; inventories; investments and accounts with parents, subsidiaries and affiliates; portfolio investments; loans given to other enterprises; and capital assets.
- Asset‑based measures of foreign control provide a longer term perspective as assets are a stock item reflecting economic decisions and market conditions that evolve more slowly over time.
- Operating revenue include revenues from the sales of goods and services; rental and operating lease revenues; and revenues from commissions, franchise fees, and royalties. Revenue‑based measures represent a flow item and are closely tied to the business cycle.
- Revenues tend to reflect current business conditions, causing them to be more volatile than asset‑based measures.
- Operating profits are the differences between Operating Revenues and Operating Expenses.
- Profits are a measure of the financial health and well‑being of a corporation and can be used to assess its performance and sustainability.
The above financial statistics are compiled from enterprise‑level data and cover all incorporated businesses operating in Canada including federal and provincial government business enterprises, but exclude enterprises classified under the Management of Companies and Enterprises (NAICS 55), Religious Organizations (NAICS 8131), Political Organizations (NAICS 81394), Public Administration (NAICS 91), as well as Funds of Financial Vehicles (NAICS 526) groups.
The 'enterprise' is a statistical unit which can be a single corporation or a family of corporations under common ownership or control, for which consolidated financial statements are produced. For the purpose of this analysis 'enterprise' and 'corporation' are used interchangeably. The population being studied includes all foreign‑controlled corporations with operations in Canada.
Corporate control is defined as having the potential to affect the corporate strategic decision‑making process of the board of directors of a corporation. In most cases of foreign control, the country of control is the country of residence of the ultimate foreign controlling parent corporation, family, trust, estate or related group. A company whose voting rights are equally owned by Canadian‑controlled and foreign‑controlled corporations, is considered Canadian‑controlled. If two foreign‑controlled corporations jointly own an equal amount of the voting rights of a Canadian resident company, the country of control is assigned according to an order of precedence based on their aggregate level of foreign control in Canada. For example, the United States takes precedence over all other foreign countries because it has the highest level of aggregate foreign control in Canada.
Concepts and Methodology
Historically, foreign control was held by Canada’s largest trading partners: the United States, the European Union (including the United Kingdom, France, Germany and the Netherlands), and Japan. In 2016, this breakdown still represented 79.1% of total assets under foreign control in Canada. As such. For publication purposes all other countries were clustered into a single residual category. However, as a number of these countries are becoming important players in the Canadian economy, the current publication provides additional country‑level detail covering 90.6% of foreign controlled assets.
Data was compiled by geographic macro‑regions using the Standard Classification of Countries and Areas of Interest (SCCAI 2016) structure.
These macro‑regions are:
- Americas
- Europe
- Africa
- Asia
- Oceania
- Antarctica and Adjacent Islands
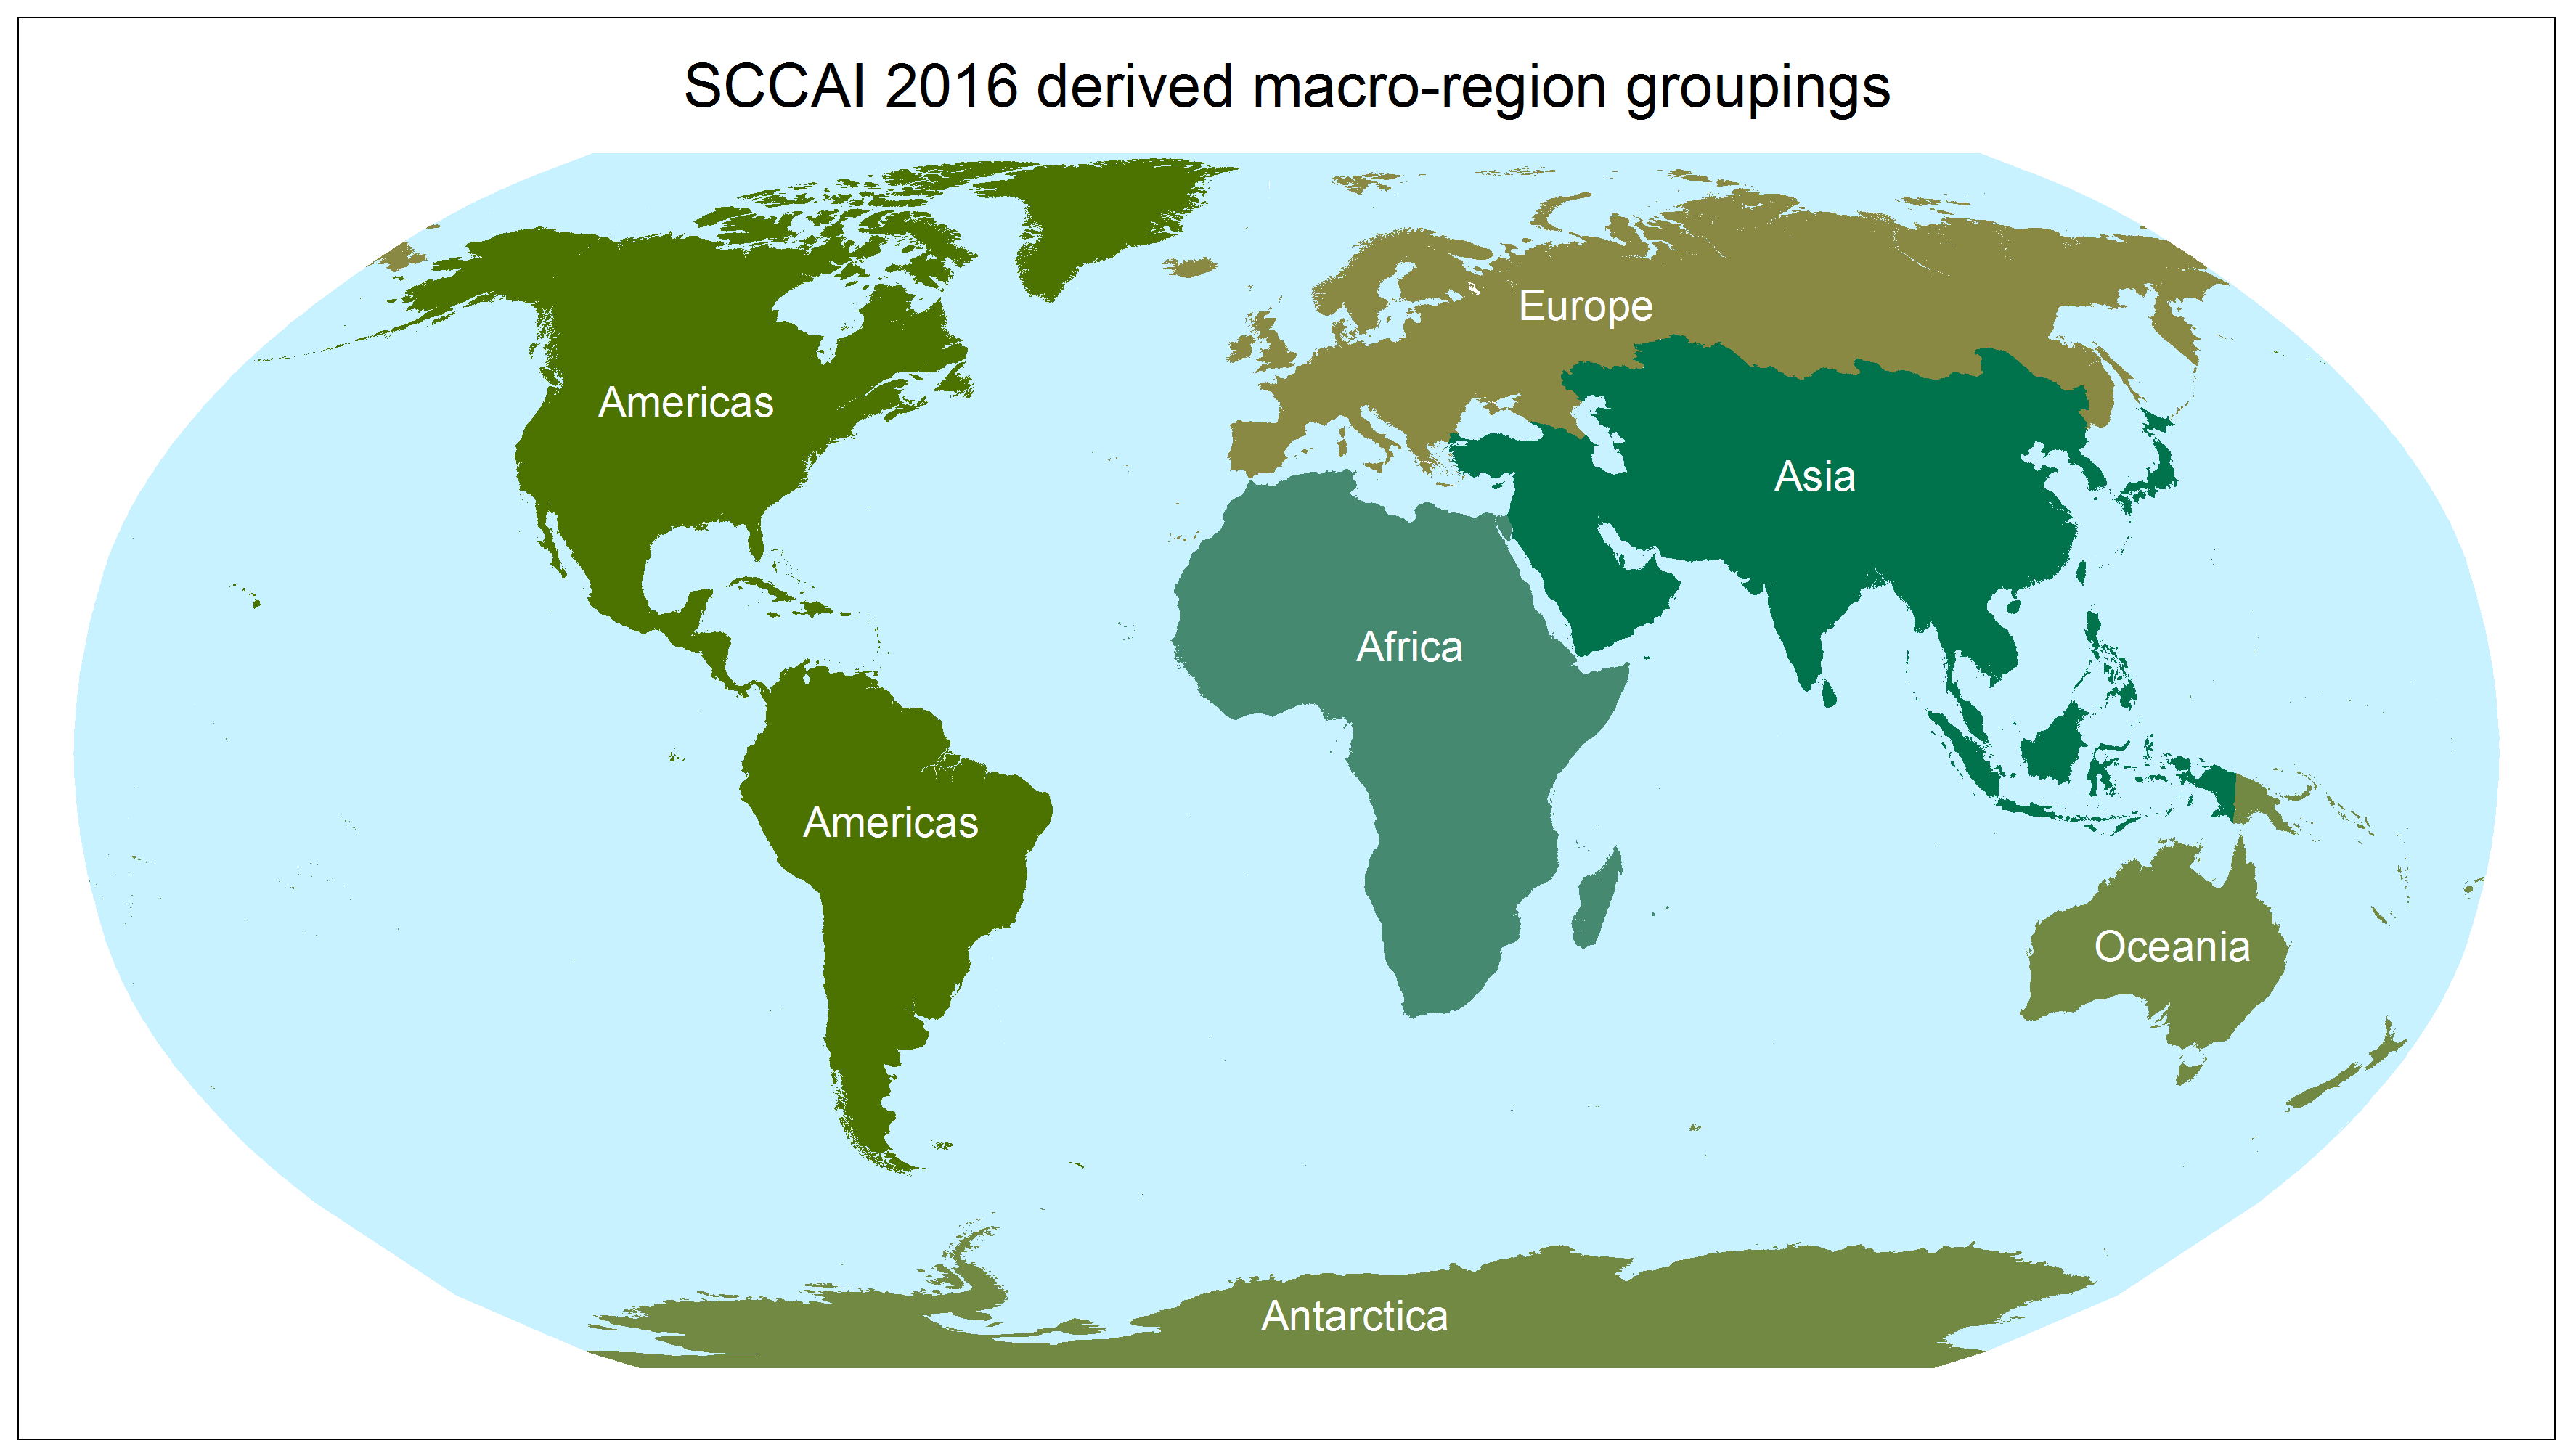
Description for Map 1
This is a map of the world using various shades of green to identify five macro-regions: the Americas, Africa, Europe, Asia, and Antarctica & Oceania. It is intended to give a visual demonstration of the regions used to highlight foreign control of Canadian corporations.
This paper groups the regions of Oceania with Antarctica and Adjacent Islands and labels it 'Oceania & Antarctica' in order to publish statistics without requiring additional suppressions necessary for safeguarding the confidentiality of data.
The residual 'other' category was further divided, creating five new residual categories, one for each macro‑region; for example these categories were labeled as 'Other – Asia' and 'Other – Europe', etc.
Where possible, country level data were taken out of their respective residual groupings and reported separately whenever foreign control surpassed a threshold level of ownership for consecutive years. The reported country data must also pass internal confidentiality requirements, otherwise the country is grouped within its macro‑region residual.
The end result is a dataset that gives users the ability to follow trends in corporate control across the macro‑regions, their respective residuals, and specific countries, over time.
Who controls Canadian corporations and how has this changed over 10 years?
This analysis measures foreign control in the Canadian corporate economy through three variables: assets, operating revenue, and operating profits, with a focus on assets. It expands on previous CRA reports by breaking down data by macro‑region, country, and financial and non‑financial industry groupings from 2007 to 2016. This analysis finds that the share of foreign control of Canadian corporations, operating or residing in Canada, has diminished over the time period. Also, the make‑up of foreign control as measured by assets, operating revenue, and operating profits, has changed over the last decade.
Foreign control in the Canadian economy is less prevalent today than it was ten years ago
Corporations, including the largest contributor to foreign control in Canada, the United States, have seen their share of total foreign‑controlled assets decline from 2007 to 2016. This is also true for the next largest contributor, the United Kingdom. In contrast, corporations from the Asia macro‑region have exhibited growth in their share of total foreign‑controlled assets; driven mainly by Japan, China, South Korea, and India.

Data table for Map 2
| 2016 | Percent | |||||
|---|---|---|---|---|---|---|
| USA | 52.0 | |||||
| United Kingdom | 10.7 | |||||
| Other - Europe | 5.1 | |||||
| Japan | 5.0 | |||||
| Germany | 4.4 | |||||
| Switzerland | 4.0 | |||||
| Other - Asia | 4.0 | |||||
| France | 3.8 | |||||
| Netherlands | 3.1 | |||||
| China | 2.0 | |||||
| Brazil | 1.5 | |||||
| Australia | 1.5 | |||||
| Italy | 0.9 | |||||
| India | 0.8 | |||||
| South Korea | 0.5 | |||||
| Other - Americas | 0.3 | |||||
| Mexico | 0.2 | |||||
| Africa | 0.1 | |||||
| Other - Oceania and Antarctica | 0.0 | |||||
| Source: Statistics Canada, table 33‑10‑0084‑01 | ||||||
While the total value of assets of corporations under foreign control in the Canadian economy has increased steadily from 2007 to 2016, the corresponding share of total assets under foreign control has declined. This indicates a diminishing presence of foreign‑control in Canadian corporations. Levels in chart 1 are not adjusted for inflation.
Data table for Chart 1
| Total assets | Operating revenue | Operating profit | Share of assets under foreign control | Share of operating revenue under foreign control | Share of operating profit under foreign control | |
|---|---|---|---|---|---|---|
| CAD (millions) | percent | |||||
| 2007 | 1,384,897 | 935,981 | 80,244 | 21.57 | 29.57 | 26.49 |
| 2008 | 1,496,443 | 998,885 | 77,694 | 20.59 | 30.07 | 24.91 |
| 2009 | 1,447,677 | 867,944 | 47,276 | 19.73 | 28.77 | 20.24 |
| 2010 | 1,524,120 | 933,284 | 66,621 | 19.19 | 29.12 | 22.26 |
| 2011 | 1,694,591 | 1,003,394 | 78,875 | 18.87 | 28.97 | 22.92 |
| 2012 | 1,775,829 | 1,069,894 | 71,133 | 18.54 | 29.95 | 20.65 |
| 2013 | 1,854,475 | 1,075,323 | 72,702 | 18.29 | 29.10 | 20.07 |
| 2014 | 1,949,247 | 1,117,806 | 76,171 | 18.04 | 28.66 | 20.01 |
| 2015 | 1,963,137 | 1,073,396 | 59,974 | 16.90 | 27.79 | 16.91 |
| 2016 | 1,988,266 | 1,092,942 | 64,877 | 16.25 | 27.84 | 17.31 |
| Source: Statistics Canada, table 33‑10‑0084‑01 | ||||||
Domestically-controlled corporations are growing at a faster rate
When indexed using 2007 as the base year (unadjusted for inflation), assets of Canadian‑controlled corporations grew in value by 103.6%, operating revenues by 27.1% and operating profits by 39.2%. Meanwhile, the value of assets and operating revenue of foreign‑controlled enterprises rose by 43.6% and 16.8%, respectively, with a decline in operating profits of 19.2%.
Data table for Chart 2
| Canadian assets | Foreign assets | Canadian operating revenue | Foreign operating revenue | Canadian operating profit | Foreign operating profit | |
|---|---|---|---|---|---|---|
| index, 2007 = 100 | ||||||
| 2007 | 100 | 100 | 100 | 100 | 100 | 100 |
| 2008 | 115 | 108 | 104 | 107 | 105 | 97 |
| 2009 | 117 | 105 | 96 | 93 | 84 | 59 |
| 2010 | 127 | 110 | 102 | 100 | 104 | 83 |
| 2011 | 145 | 122 | 110 | 107 | 119 | 98 |
| 2012 | 155 | 128 | 112 | 114 | 123 | 89 |
| 2013 | 165 | 134 | 118 | 115 | 130 | 91 |
| 2014 | 176 | 141 | 125 | 119 | 137 | 95 |
| 2015 | 192 | 142 | 125 | 115 | 132 | 75 |
| 2016 | 204 | 144 | 127 | 117 | 139 | 81 |
| Source: Statistics Canada, table 33‑10‑0084‑01 | ||||||
Assets of foreign-controlled corporations are concentrated in the non-financial industry grouping
Foreign‑controlled corporations are more prevalent in the non‑financial grouping than in the financial grouping. In contrast, Canadian‑controlled corporations are more evenly divided between the two industry groupings. A majority of the activity in the financial grouping is represented by enterprises operating in the depository and credit intermediation industry, which consists mostly of banks. This is a heavily regulated industry in Canada and helps to explain why foreign‑controlled corporations have not exceeded a 40.0% share in the financial industries over the time period studied
Data table for Chart 3
| Financial | Non-Financial | |
|---|---|---|
| percent | ||
| 2007 | 36.762 | 63.238 |
| 2008 | 36.147 | 63.853 |
| 2009 | 35.299 | 64.701 |
| 2010 | 35.167 | 64.833 |
| 2011 | 36.773 | 63.227 |
| 2012 | 36.723 | 63.277 |
| 2013 | 36.751 | 63.249 |
| 2014 | 36.888 | 63.112 |
| 2015 | 33.279 | 66.721 |
| 2016 | 33.255 | 66.745 |
| Source: Statistics Canada, table 33‑10‑0084‑01 | ||
How has the share of assets of foreign‑controlled corporations evolved?
Shares of foreign-controlled assets by macro-region have shifted over time
Of the foreign‑controlled corporations in Canada, most are controlled by countries found in the following three macro regions: the Americas, Europe and Asia. When combined, the remaining macro‑regions of Africa and Oceania & Antarctica do not exceed 2.0% of the foreign controlled total in any given year and are therefore largely omitted from further analysis in this report.
Data table for Chart 4
| Americas | Europe | Asia | |
|---|---|---|---|
| percent | |||
| 2007 | 57.49 | 34.12 | 7.64 |
| 2008 | 55.39 | 35.55 | 8.05 |
| 2009 | 53.84 | 36.40 | 8.79 |
| 2010 | 54.17 | 35.92 | 8.89 |
| 2011 | 51.26 | 36.96 | 10.46 |
| 2012 | 51.57 | 36.12 | 10.82 |
| 2013 | 51.83 | 35.07 | 11.66 |
| 2014 | 52.36 | 34.22 | 12.11 |
| 2015 | 54.13 | 31.87 | 12.70 |
| 2016 | 54.08 | 32.00 | 12.32 |
| Source: Statistics Canada, table 33‑10‑0084‑01 | |||
Foreign‑controlled corporations from the Americas macro‑region dominate, but have seen their share fall over the time period. While the share of European‑controlled corporations has remained relatively stable from 2007 to 2016, Asian‑controlled corporations’ share has increased steadily.
Nominal values of assets have increased across most macro-regions
With the exception of Africa, foreign‑controlled corporations from other macro‑regions have demonstrated growth in their nominal value of assets between 2007 and 2016.
Data table for Chart 5
| Americas | Europe | Asia | Oceania & Antarctica | Africa | |
|---|---|---|---|---|---|
| CAD (millions) | |||||
| 2007 | 796,159 | 472,517 | 105,748 | 7,768 | 2,651 |
| 2016 | 1,075,190 | 636,193 | 244,945 | 30,192 | 1,746 |
| Source: Statistics Canada, table 33‑10‑0084‑01 | |||||
The breakdown by industry groupings, between 2007 and 2016, shows the difference in composition across the macro‑regions. For example, European‑controlled corporations own more assets in the financial grouping than those controlled by the Americas or Asia.
Data table for Chart 6
| Financial | Non-Financial | |
|---|---|---|
| percent | ||
| Americas | ||
| 2007 | 31.34 | 68.66 |
| 2016 | 29.76 | 70.24 |
| Asia | ||
| 2007 | 27.70 | 72.30 |
| 2016 | 28.15 | 71.85 |
| Europe | ||
| 2007 | 48.61 | 51.39 |
| 2016 | 40.59 | 59.41 |
| Source: Statistics Canada, table 33‑10‑0084‑01 | ||
Corporations controlled by the Americas macro region own the largest share of foreign assets
In 2007, the Americas accounted for 57.5% of total assets held by foreign‑controlled corporations in Canada with this figure falling slightly to 54.1% ten years later. The Americas' dominance in foreign control of Canadian corporations is indicative of the strong economic relations between Canada and its neighbours south of the border, in particular the United States - Canada's largest trading partner.
Data table for Chart 7.1
| Americas | |
|---|---|
| percent | |
| 2007 | 57.49 |
| 2008 | 55.39 |
| 2009 | 53.84 |
| 2010 | 54.17 |
| 2011 | 51.26 |
| 2012 | 51.57 |
| 2013 | 51.83 |
| 2014 | 52.36 |
| 2015 | 54.13 |
| 2016 | 54.08 |
| Source: Statistics Canada, table 33‑10‑0084‑01 | |
Country‑level detail shows that corporations controlled by the United States account for 96.2% of assets held within the Americas macro‑region in 2016, down slightly from 96.6% in 2007. In contrast, corporations controlled by Brazil and Mexico have increased their shares of assets within this macro‑region from 2007 to 2016.
Data table for Chart 7.2
| 2007 | 2016 | |
|---|---|---|
| percent | ||
| Mexico | 0.1 | 0.4 |
| Brazil | 2.5 | 2.8 |
| Other - Americas | 0.8 | 0.6 |
| Source: Statistics Canada, table 33‑10‑0084‑01 | ||
The United States‑controlled corporations reduced their share of assets owned in the financial grouping from 2007 to 2016 by 1.6%, while corporations from the remaining countries in the region have kept their aggregate shares virtually unchanged. For the purposes of the following graph, the countries of Mexico and Brazil have been combined with the residual to form the grouping 'Rest of Americas'.
Data table for Chart 7.3
| Financial | Non-Financial | |
|---|---|---|
| percent | ||
| United States | ||
| 2007 | 32.05 | 67.95 |
| 2016 | 30.48 | 69.52 |
| Rest of Americas | ||
| 2007 | 11.11 | 88.89 |
| 2016 | 11.11 | 88.89 |
| Source: Statistics Canada, table 33‑10‑0084‑01 | ||
European-controlled corporations' share has remained largely unchanged
In 2007, corporations controlled by countries within Europe accounted for 34.1% of all foreign assets in Corporations in Canada with a peak of 37.0% in 2011, steadily declining to 32.0% in 2016. The macro‑region's share of foreign control of Canadian corporations is tied to a history of strong economic relations between Canada and Europe.
Data table for Chart 8.1
| Europe | |
|---|---|
| percent | |
| 2007 | 34.12 |
| 2008 | 35.55 |
| 2009 | 36.40 |
| 2010 | 35.92 |
| 2011 | 36.96 |
| 2012 | 36.12 |
| 2013 | 35.07 |
| 2014 | 34.22 |
| 2015 | 31.87 |
| 2016 | 32.00 |
| Source: Statistics Canada, table 33‑10‑0084‑01 | |
Country‑level detail from Europe includes corporations controlled from the United Kingdom, Germany, Switzerland, France, the Netherlands, and Italy, in descending order of ownership of assets for 2016. New countries from Europe are emerging as stakeholders in the Canadian corporate economy as observed by the macro‑region’s residual grouping which has climbed to become the second largest European influence for 2016, going from 9.4% of the macro‑region in 2007 up to 15.9% in 2016.
British‑controlled enterprises account for the largest share of assets in the Europe macro‑region over the time period. Enterprises from the remaining European countries grew their respective shares of assets with the exception of the Netherlands which saw their share of this macro‑region decrease by 7.9% over the time period. Swiss‑controlled corporations were the only ones to remain relatively unchanged from 2007 to 2016.
Data table for Chart 8.2
| 2007 | 2016 | |
|---|---|---|
| percent | ||
| United Kingdom | 39.2 | 33.4 |
| France | 10.8 | 11.8 |
| Germany | 9.8 | 13.9 |
| Italy | 1.6 | 2.9 |
| Netherlands | 17.6 | 9.7 |
| Switzerland | 11.6 | 12.4 |
| Other Europe | 9.4 | 15.9 |
| Source: Statistics Canada, table 33‑10‑0084‑01 | ||
A breakdown of ownership of assets across industry grouping between between 2007 and 2016 shows how some countries have changed their composition between the financial and non‑financial industry groupings. Of the countries presented in the chart below, the United Kingdom and the residual category do not vary significantly from 2007 and 2016. This is not the case for the remaining countries which show some change in the composition between assets held in the financial and non‑financial groupings.
Data table for Chart 8.3
| Financial | Non-Financial | |
|---|---|---|
| percent | ||
| United Kingdom | ||
| 2007 | 56.18 | 43.82 |
| 2016 | 59.73 | 40.27 |
| France | ||
| 2007 | 51.37 | 48.63 |
| 2016 | 36.54 | 63.46 |
| Germany | ||
| 2007 | 58.75 | 41.25 |
| 2016 | 49.03 | 50.97 |
| Netherlands | ||
| 2007 | 59.08 | 40.92 |
| 2016 | 21.19 | 78.81 |
| Switzerland | ||
| 2007 | 32.14 | 67.86 |
| 2016 | 45.88 | 54.12 |
| Rest of Europe | ||
| 2007 | 10.40 | 89.60 |
| 2016 | 9.45 | 90.55 |
| Source: Statistics Canada, table 33‑10‑0084‑01 | ||
Asian-controlled enterprises are increasing their share of assets controlled in Canada
In 2007, enterprises controlled by the Asia macro‑region accounted for 7.6% of total assets under foreign control, with this figure increasing to 12.3% ten years later.
Data table for Chart 9.1
| Asia | |
|---|---|
| percent | |
| 2007 | 7.64 |
| 2008 | 8.05 |
| 2009 | 8.79 |
| 2010 | 8.89 |
| 2011 | 10.46 |
| 2012 | 10.82 |
| 2013 | 11.66 |
| 2014 | 12.11 |
| 2015 | 12.70 |
| 2016 | 12.32 |
| Source: Statistics Canada, table 33‑10‑0084‑01 | |
Country‑level detail from Asia includes corporations controlled in Japan, China, India, and South Korea, in descending order of ownership of foreign‑controlled assets for 2016. The macro‑region's residual is also significant and is only second in influence to Japan in 2016.
Japanese corporations are the largest contributor to foreign control but have lost share within their macro‑region to Chinese, Indian and South Korean corporations which have all been increasing their foothold in the Canadian corporate economy.
Data table for Chart 9.2
| 2007 | 2016 | |
|---|---|---|
| percent | ||
| China | 0.7 | 16.2 |
| South Korea | 1.5 | 4.2 |
| Japan | 49.9 | 40.7 |
| India | 6.0 | 6.8 |
| Other - Asia | 41.9 | 32.1 |
| Source: Statistics Canada, table 33‑10‑0084‑01 | ||
A breakdown of assets in Asian‑controlled corporations by industry grouping shows those under Chinese control are concentrated in the non‑financial grouping as opposed to Japan and India which are almost evenly divided between the financial and non‑financial grouping. South Korean corporations have increased their stake in the financial grouping from 2012 to 2016. The chart below selects 2012 as a starting point given the confidentiality and suppression of data for the macro‑region prior to this year.
Data table for Chart 9.3
| Financial | Non-Financial | |
|---|---|---|
| percent | ||
| China | ||
| 2012 | 24.02 | 75.98 |
| 2016 | 15.34 | 84.66 |
| South Korea | ||
| 2012 | 6.71 | 93.29 |
| 2016 | 32.92 | 67.08 |
| Japan | ||
| 2012 | 45.72 | 54.28 |
| 2016 | 45.26 | 54.74 |
| India | ||
| 2012 | 55.98 | 44.02 |
| 2016 | 49.19 | 50.81 |
| Other - Asia | ||
| 2012 | 6.37 | 93.63 |
| 2016 | 7.78 | 92.22 |
| Source: Statistics Canada, table 33‑10‑0084‑01 | ||
Conclusion
From 2007 to 2016, foreign‑control in the Canadian economy expanded, as measured by the nominal increase in foreign‑controlled assets which reached almost two trillion dollars in 2016. However, the share of foreign control in Canadian corporations has diminished over the last ten years indicating that growth in foreign‑controlled assets is outmatched by growth in Canadian‑controlled assets in corporations conducting business in Canada.
The main finding in this report is in the changing trends of foreign control: while the share of foreign‑owned assets in the Americas and Europe macro‑regions fell from 2007 to 2016, Asia saw its relative share increase. This upward trend is the result of countries within Asia, such as China, India, Japan and South Korea, taking a more active presence in Canadian corporations since 2007.
This report also highlights the prevalence of foreign control in Canada's non‑financial industry grouping from 2007 to 2016.
While the United States and the United Kingdom remain the top two ranking sources of corporate influence among all foreign countries, their shares of control have fallen over the ten year period.
- Date modified: