
Housing Statistics in Canada
Housing Experiences in Canada: Inuit in 2016
by Zachary Thurston and Jeff Randle
Skip to text
Text begins
The Housing Experiences in Canada series of fact sheets highlight the diversity of housing situations experienced by different groups of people living across Canada.
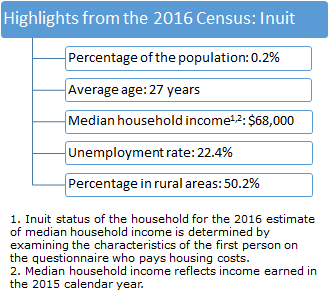
This fact sheet focuses on the Inuit population living in private dwellings. The statistics below are derived from the 2016 Census. For the purposes of this analysis, Inuit were identified based on responses to the Indigenous identity questions on the long-form questionnaire.Note 1Only individuals who reported a single Indigenous identity of Inuit are included in the analysis.Note 2Since this fact sheet focuses on Inuit in private dwellings, those living in collective dwellings are not included in the data.Note 3 More fact sheets are available on the Housing Experiences in Canada issue page.
The National Housing Strategy Act (2019) declared that “the right to adequate housing is a fundamental human right affirmed in international law.” This right is reaffirmed in the United Nations Declaration on the Rights of Indigenous Peoples (UNDRIP) as an important element of the right to life and dignity for Indigenous peoples. The UNDRIPrecognizes the important connections between the right to housing and the right to self-determination, rights related to lands, resources and territories, social and economic rights, and rights related to non-discrimination. The declaration also underscores the importance of Indigenous peoples’ right to development, including the right to determine their own housing institutions, programs and policies.
Adequate housing is understood in international law as housing that provides secure tenure; is affordable; is habitable; provides access to basic infrastructure; is located close to employment, services and amenities; is accessible for people of all abilities; and is culturally appropriate.
This fact sheet focuses on the experience of Inuit living in private dwellings using the following indicators collected and produced by Statistics Canada: tenure status of household, shelter costs, housing affordability and suitability, condition of dwelling, core housing need, and household living arrangements. While these indicators together do not perfectly measure adequate housing as defined in international law, or Indigenous people’s understanding of adequate housing, they are nevertheless useful proxies for understanding the housing experiences of people living in Canada.
To highlight housing need differences faced by those who chose to live either in or outside the Inuit Nunangat region, the fact sheet will incorporate a distinction between these two regions. Inuit Nunangat, which is located along Canada’s northern coastline and stretches inland in the Northwest Territories, Nunavut, northern Quebec, and northern Newfoundland and Labrador.Note 4 Inuit Nunangat is recognized as a distinct geographic, cultural and political region.Note 5
Tenure status of household

The tenure status of a household refers to whether the household owns or rents its private
According to the 2016 Census, the majority of Inuit lived in Inuit Nunangat. Of the 65,020 Inuit, 47,330 (72.8%) lived in Inuit Nunangat and 17,690 (27.2%) lived outside Inuit Nunangat.
Of the 47,330 Inuit living in Inuit Nunangat, 19.1% lived in a private dwelling owned by a member of their household in 2016. This was less than one-third of the share of the total population (71.6%) who lived in owner-occupied dwellings.Note 7 Inuit living outside Inuit Nunangat (55.1%) lived in owner-occupied dwellings at a rate of 15 percentage points lower than the total population.Of the 38,315 Inuit living in Inuit Nunangat in rented dwellings, 32,400 (68.5%) lived in subsidized housing and 5,910 (12.5%) did not live in subsidized housing. Inuit living in Inuit Nunangat were over 20 times more likely to live in subsidized rented dwellings than the total population (3.3%). Inuit living outside Inuit Nunangat (9.4%) also lived in subsidized housing more often than the total population.
| Inuit | Total population | |||||
|---|---|---|---|---|---|---|
| Living in Inuit Nunangat | Living outside Inuit Nunangat | |||||
| count | percent | count | percent | count | percent | |
| Total, tenure status | 47,330 | 100.0 | 17,690 | 100.0 | 34,460,065 | 100.0 |
| Owner | 9,020 | 19.1 | 9,755 | 55.1 | 24,683,880 | 71.6 |
| With a mortgage | 4,905 | 10.4 | 7,440 | 42.1 | 16,670,675 | 48.4 |
| Without a mortgage | 4,115 | 8.7 | 2,315 | 13.1 | 8,013,205 | 23.3 |
| Renter | 38,315 | 81.0 | 7,730 | 43.7 | 9,164,150 | 26.6 |
| Subsidized housing | 32,400 | 68.5 | 1,670 | 9.4 | 1,135,275 | 3.3 |
| Not subsidized housing | 5,910 | 12.5 | 6,060 | 34.3 | 8,028,875 | 23.3 |
|
Note: Figures may not add up to 100% because of rounding Source: 2016 Census of Population |
||||||
Housing challenges in Inuit Nunangat
Because of the harsh climate and remoteness of many communities in Inuit Nunangat, building costs for housing far exceed those in major cities across Canada.Note 8Limited transportation infrastructure means that building materials must often be shipped over long distances using marine or air services. Adding to the complexity is a short building season that limits the time frame for construction projects to take place. This, combined with increased costs for maintenance and operation, means that owning or renting a home would not be possible for many Inuit without significant subsidies.
To make housing more accessible, housing authorities in Inuit Nunangat provide subsidized housing to those in need. In some cases, provincial and local housing authorities operate alongside each other, and in others, local housing authorities operate as part of the territorial housing corporation.Note 9 For example, in Nunavut the local housing authorities are part of the Nunavut housing corporation. Housing authorities may offer different rent programs depending on the needs of the community, including income-tested rent and lease-to-own agreements.
The provision of public housing is reflected in high rates of subsidized housing, low median shelter costs among renters, and low rates of unaffordable housing in Inuit Nunangat.
A recent initiative to improve housing conditions is the Inuit Nunangat Housing Strategy (2019), a Inuit-specific strategy co-developed by Inuit and the federal government through the Inuit-Crown Partnership Committee. Its goal is to bring housing conditions in Inuit Nunangat in line with housing conditions in the rest of Canada. To do this, the strategy focuses on a number of priority areas, including reducing overcrowding and reliance on social housing while increasing affordable housing options and improving housing quality.
Shelter costs

Shelter costs refer to the monthly dwelling-related expenses paid by households, including mortgage or rent. For owner-occupied dwellings, shelter costs include, where applicable, mortgage payments, property taxes and condominium fees, along with the costs of electricity, heat, water and other municipal services. For renter households, shelter costs include, where applicable, rent and the costs of electricity, heat, water and other municipal services.
In Canada, the median shelter cost paid by Inuit households living in Inuit Nunangat was $396 in 2016.Note 10This was mainly driven by the high proportion of subsidized renter households, and was under half the median shelter cost of $1,020 for all households across Canada. Inuit households outside Inuit Nunangat ($970) had similar median shelter costs as all households.
The median shelter cost paid by renter households was lower for Inuit living in Inuit Nunangat ($288) when compared with those living outside the region ($870) and the total population ($910). Inuit households in Inuit Nunangat in rented dwellings with a subsidy ($236) also had lower median monthly shelter costs than all households in rented dwellings with a subsidy ($524).Note 11Median shelter costs for Inuit households in Inuit Nunangat in rented dwellings without a subsidy ($670) were about two-thirds of the shelter costs for all households ($960).
Differences in the median shelter costs between owner-occupied Inuit households and all households were driven mainly by the differences in the share of households that had or did not have a mortgage. The median shelter costs of owners with a mortgage were similar across groups, as were the median shelter costs of owners without a mortgage.
While the rents paid in Inuit Nunangat are comparatively lower than outside the region, this can largely be explained by the administration of housing subsidies. According to the Isolated Posts and Government Housing Directive, which inflates the salaries of government employees who work in remote areas to account for the cost of living, nearly all of the isolated posts in Nunavut have a cost of living index of 10 or greater, many with a maximum index of 16.Note 12 After household size is adjusted for, the income levels and the high cost of living for Inuit living in Inuit Nunangat make saving a challenge for those who may hope to one day own their home.
| Inuit households in Inuit Nunangat | Inuit households outside Inuit Nunangat | All households | ||||
|---|---|---|---|---|---|---|
| Shelter costsTable 2 Note 1 | Adjusted total incomeTable 2 Note 2 | Shelter costsTable 2 Note 1 | Adjusted total incomeTable 2 Note 2 | Shelter costsTable 2 Note 1 | Adjusted total incomeTable 2 Note 2 | |
| median (dollars) | ||||||
| Total, tenure status | 396 | 37,200 | 970 | 40,000 | 1,020 | 48,000 |
| Owner | 880 | 66,000 | 1,210 | 65,000 | 1,130 | 57,200 |
| With a mortgage | 1,640 | 77,000 | 1,560 | 70,500 | 1,620 | 60,000 |
| Without a mortgage | 592 | 56,800 | 416 | 46,000 | 540 | 51,600 |
| Renter | 288 | 33,200 | 870 | 25,800 | 910 | 30,600 |
| Subsidized housing | 236 | 31,000 | 420 | 14,500 | 524 | 18,600 |
| Not subsidized housing | 670 | 48,800 | 980 | 31,000 | 960 | 33,600 |
|
||||||
Housing affordability

Housing affordability is derived using the shelter-cost-to-income ratio, which refers to the proportion of average total income households spend on shelter costs. A household is said to have affordable housing if it spends less than 30% of its total income on shelter costs.Note 13
According to the 2016 Census, 1,410 Inuit living in Inuit Nunangat (3.0%) lived in households that spent more than 30% of their total household income on shelter, again owing to the high proportion of subsidized renter households. This was lower than the rate observed in the total population (20.0%). Inuit living outside Inuit Nunangat (21.8%) experienced unaffordable housing at a slightly higher rate than the total population.
Inuit owners (5.0%) and renters (2.5%) alike, when living in Inuit Nunangat, saw lower rates of unaffordable housing compared with their counterparts living elsewhere in the country. Inuit living in owner-occupied dwellings outside Inuit Nunangat also had marginally lower rates of unaffordable housing when compared with the total population.
For those living in owner-occupied dwellings, the rate of unaffordable housing differed depending on the presence of a mortgage. Inuit living in Inuit Nunangat with a mortgage (7.1%) lived in unaffordable housing at a lower rate than the total population with a mortgage (19.6%). Among Inuit living in Inuit Nunangat in dwellings without a mortgage, 2.4% were living in unaffordable housing, compared with 4.4% of the total population.
The difference in housing affordability rates between Inuit living in Inuit Nunangat and the total population is largely because of the particularly low shelter costs in the region, where subsidized rental units represent a large majority of the housing stock. For example, the Public Housing Program in Nunavut is an income-tested rental program that provides subsidized housing to tenants based on their income and ability to pay rent.Note 14This form of subsidy is designed such that tenant households will not spend more than 30% of their income on rent, contributing to the low rates of unaffordable housing.
| Inuit | Total population | |||||
|---|---|---|---|---|---|---|
| Living in Inuit Nunangat | Living outside Inuit Nunangat | |||||
| count | percent | count | percent | count | percent | |
| Total, shelter-cost-to-income ratioTable 3 Note 1 | 47,310 | 100.0 | 17,380 | 100.0 | 33,642,820 | 100.0 |
| Spending more than 30% of income on shelter costs | 1,410 | 3.0 | 3,785 | 21.8 | 6,742,050 | 20.0 |
| Owner | 450 | 5.0 | 1,155 | 11.9 | 3,605,535 | 14.7 |
| With a mortgage | 350 | 7.1 | 1,075 | 14.5 | 3,257,230 | 19.6 |
| Without a mortgage | 100 | 2.4 | 80 | 3.5 | 348,300 | 4.4 |
| Renter | 965 | 2.5 | 2,635 | 34.3 | 3,136,520 | 34.5 |
| Subsidized housing | 565 | 1.7 | 465 | 28.0 | 361,270 | 32.3 |
| Not subsidized housing | 400 | 6.8 | 2,170 | 36.0 | 2,775,245 | 34.8 |
|
||||||
Housing suitability

Housing suitability refers to whether a private household is living in suitable accommodations according to the National Occupancy Standard (NOS), that is, whether the dwelling has enough bedrooms for the size and composition of the household. The indicator assesses the required number of bedrooms for a household based on the age and sex of household members, and the relationships between them.
According to the 2016 Census, 24,495 Inuit living in Inuit Nunangat (51.8%) lived in unsuitable housing, meaning that there were not enough bedrooms in the dwelling to meet the needs of their household, according to the National Occupancy Standard. This was higher than the 8.9% of the total population who lived in unsuitable housing. Inuit living outside Inuit Nunangat (10.9%) also lived in unsuitable housing at a higher rate than the total population.
Inuit living in Inuit Nunangat in owner-occupied dwellings (33.8%) were more likely to be in unsuitable housing than the total population in owner-occupied dwellings (5.4%). This difference was also reflected in rented dwellings, where the share of Inuit living in Inuit Nunangat in rented dwellings (56.0%) that were unsuitable was higher than the share for the total population (17.8%).
When owner-occupied dwellings are differentiated by the presence of a mortgage, Inuit living in Inuit Nunangat experienced higher rates of unsuitable housing compared with the total population with and without a mortgage.
Inuit living in renter households in Inuit Nunangat with (56.8%) and without (51.4%) a subsidy had higher rates of unsuitable housing than the total population. The rate of unsuitable housing was 19.2% for the total population in households with a subsidy, and 17.6% for those without one.
Contrary to the housing suitability rates seen in Inuit Nunangat, Inuit living outside Inuit Nunangat experienced similar levels when compared with the total population.
| Inuit | Total population | |||||
|---|---|---|---|---|---|---|
| Living in Inuit Nunangat | Living outside Inuit Nunangat | |||||
| count | percent | count | percent | count | percent | |
| Total, housing suitability | 47,330 | 100.0 | 17,690 | 100.0 | 34,460,065 | 100.0 |
| Not suitable | 24,495 | 51.8 | 1,930 | 10.9 | 3,081,315 | 8.9 |
| Owner | 3,045 | 33.8 | 570 | 5.8 | 1,335,345 | 5.4 |
| With a mortgage | 1,710 | 34.9 | 425 | 5.7 | 1,062,985 | 6.4 |
| Without a mortgage | 1,335 | 32.4 | 145 | 6.3 | 272,365 | 3.4 |
| Renter | 21,450 | 56.0 | 1,305 | 16.9 | 1,631,845 | 17.8 |
| Subsidized housing | 18,410 | 56.8 | 255 | 15.3 | 218,130 | 19.2 |
| Not subsidized housing | 3,040 | 51.4 | 1,055 | 17.4 | 1,413,720 | 17.6 |
| Source: 2016 Census of Population | ||||||
Condition of dwelling

Data on condition of dwelling are used to provide some insight into whether housing is habitable. Dwellings are classified into three groups by condition: needing regular maintenance only, needing minor repairs and needing major repairs. Dwellings in need of major repairs are considered to be inadequate housing. Examples of dwellings in need of major repairs include homes with defective plumbing or electrical wiring, and housing needing structural repairs to walls, floors, or ceilings.
The percentage of Inuit living in dwellings in need of major repairs was more than double for those living in Inuit Nunangat (31.5%) than Inuit living outside the region (12.2%). This could be owing to the harsher climate and the challenges of providing resources and supplies that are more readily available in urban areas compared with more remote areas. Conversely, the percentage of the total population who lived in dwellings in need of major repairs was much smaller (6.7%).
Inuit living in Inuit Nunangat in owner-occupied (31.5%) and rented (31.5%) dwellings also lived in dwellings in need of major repairs at a higher rate. Within the total population in owner-occupied dwellings, 5.5% of individuals lived in dwellings in need of major repairs. This was the case for 8.8% of the total population in rented dwellings. Inuit living outside Inuit Nunangat in owner-occupied (9.2%) and renter (15.1%) households also lived in dwellings in need of major repairs at a higher rate than the total population.
Inuit owners and renters living in Inuit Nunangat, regardless of the presence of a mortgage or a subsidy, experienced higher rates of living in dwellings in need of major repairs. This indicates a particularly acute need for maintaining the existing housing stock in the region.
| Inuit | Total population | |||||
|---|---|---|---|---|---|---|
| Living in Inuit Nunangat | Living outside Inuit Nunangat | |||||
| count | percent | count | percent | count | percent | |
| Total, dwelling condition | 47,330 | 100.0 | 17,690 | 100.0 | 34,460,065 | 100.0 |
| Dwelling in need of major repairs | 14,900 | 31.5 | 2,150 | 12.2 | 2,298,760 | 6.7 |
| Owner | 2,840 | 31.5 | 895 | 9.2 | 1,351,740 | 5.5 |
| With a mortgage | 1,450 | 29.6 | 665 | 8.9 | 956,105 | 5.7 |
| Without a mortgage | 1,390 | 33.8 | 230 | 9.9 | 395,640 | 4.9 |
| Renter | 12,060 | 31.5 | 1,165 | 15.1 | 807,125 | 8.8 |
| Subsidized housing | 10,375 | 32.0 | 305 | 18.3 | 131,670 | 11.6 |
| Not subsidized housing | 1,685 | 28.5 | 860 | 14.2 | 675,460 | 8.4 |
| Source: 2016 Census of Population | ||||||
Core housing need
Core housing need touches on several elements of the right to adequate housing. It considers whether the affordability, suitability, and condition of dwelling needs of the household are being met and if not, whether affordable rental housing is available that meets all these needs. A household is said to be in core housing need if their dwelling falls below at least one of the affordability, suitability, or condition of dwelling standards, and would have to spend 30% or more of their total before-tax income to pay the median rent of alternative local housing that is acceptable (meets all three housing standards).
According to the 2016 Census, despite the high proportion of subsidized housing, 48.3% of Inuit living in Inuit Nunangat were living in households in core housing need. This is nearly five times higher than the total population (10.6%) living in core housing need. Inuit living outside Inuit Nunangat (16.1%) also experienced core housing need at a higher rate than the total population.
Inuit living in Inuit Nunangat in owner-occupied dwellings (22.4%) were in core housing need at a higher rate than the total population in owner-occupied dwellings (5.4%). For renter households, Inuit living in Inuit Nunangat (54.4%) experienced a higher rate of core housing need than the total population (25.3%). A difference in core housing need rates also existed for Inuit living outside Inuit Nunangat in both owner-occupied (5.1%) and renter (30.1%) households.
The incidence of core housing need among those in owner-occupied dwellings with a mortgage was again higher for Inuit living in Inuit Nunangat (20.5%) compared with the total population (6.0%). For Inuit living in Inuit Nunangat without a mortgage (24.7%), the rate of core housing need was also higher than that of the total population without a mortgage (4.3%).
Inuit living in Inuit Nunangat in renter households with (56.3%) and without (44.0%) a subsidy experienced higher rates of core housing need than the total population. For the total population, 39.9% of individuals in renter households with a subsidy lived in core housing need and 23.2% of individuals in households without a subsidy lived in core housing need. The rate of core housing need for Inuit living outside Inuit Nunangat in renter households without a subsidy (27.8%) was also higher than that for the total population.
| Inuit | Total population | |||||
|---|---|---|---|---|---|---|
| Living in Inuit Nunangat | Living outside Inuit Nunangat | |||||
| count | percent | count | percent | count | percent | |
| Total, core housing needTable 6 Note 1 | 47,125 | 100.0 | 16,935 | 100.0 | 32,803,125 | 100.0 |
| In core housing need | 22,765 | 48.3 | 2,720 | 16.1 | 3,492,080 | 10.6 |
| Owner | 2,010 | 22.4 | 490 | 5.1 | 1,307,620 | 5.4 |
| With a mortgage | 995 | 20.5 | 355 | 4.9 | 971,150 | 6.0 |
| Without a mortgage | 1,015 | 24.7 | 145 | 6.4 | 336,470 | 4.3 |
| Renter | 20,755 | 54.4 | 2,225 | 30.1 | 2,184,455 | 25.3 |
| Subsidized housing | 18,175 | 56.3 | 620 | 38.6 | 433,190 | 39.9 |
| Not subsidized housing | 2,580 | 44.0 | 1,610 | 27.8 | 1,751,265 | 23.2 |
|
||||||
According to the 2016 Census, 66.7% of the total population who was in core housing need was below the threshold of affordability only, living in a dwelling with enough bedrooms and that was not in need of major repairs. Conversely, 97.1% of Inuit who were living in Inuit Nunangat and in core housing need were living in dwellings without enough bedrooms or that were in need of major repairs. Despite rarely spending more than 30% of their household income on housing, Inuit in Inuit Nunangat were still often unable to afford the market rent for housing that met their needs.
| Inuit | Total population | |||||
|---|---|---|---|---|---|---|
| Living in Inuit Nunangat | Living outside Inuit Nunangat | |||||
| count | percent | count | percent | count | percent | |
| Total, in core housing needTable 7 Note 1 | 22,765 | 100.0 | 2,720 | 100.0 | 3,492,075 | 100.0 |
| Below one standard | 15,880 | 69.8 | 2,040 | 75.0 | 2,767,620 | 79.3 |
| Below affordability only | 670 | 2.9 | 1,560 | 57.4 | 2,328,625 | 66.7 |
| Below suitability only | 11,235 | 49.4 | 255 | 9.4 | 289,685 | 8.3 |
| Dwelling in need of major repairs only | 3,975 | 17.5 | 215 | 7.9 | 149,315 | 4.3 |
| Below two standards | 6,790 | 29.8 | 615 | 22.6 | 679,675 | 19.5 |
| Below affordability and suitability | 225 | 1.0 | 240 | 8.8 | 395,750 | 11.3 |
| Below affordability and dwelling in need of major repairs | 185 | 0.8 | 310 | 11.4 | 235,335 | 6.7 |
| Below suitability and dwelling in need of major repairs | 6,385 | 28.0 | 60 | 2.2 | 48,590 | 1.4 |
| Below all three standards | 85 | 0.4 | 70 | 2.6 | 44,785 | 1.3 |
|
||||||
Housing experiences of Inuit men and women
In 1995, the Government of Canada committed to using Gender-based Analysis Plus (GBA Plus) to advance gender equality in Canada, as part of the ratification of the United Nations’ Beijing Platform for Action.
Gender equality is enshrined in the Canadian Charter of Rights and Freedoms, which is part of the Constitution of Canada. Gender equality means that diverse groups of women, men and gender-diverse people are able to participate fully in all spheres of Canadian life, contributing to an inclusive and democratic society.
GBA Plus is an analytical process used to assess how diverse groups of women, men and gender-diverse people may experience policies, programs and initiatives. The “plus” in GBA Plus is not just about differences between people on the basis of gender. Everyone has multiple characteristics that intersect and contribute to who they are. GBA Plus considers many other identity factors, such as race, ethnicity, immigrant status, religion, age, presence of a mental or physical disability, and how the interaction between these factors influences the way people experience government policies and initiatives.
The data presented here highlight the differences in housing experiences for Inuit men and women. Compared with Inuit men living outside Inuit Nunangat, Inuit women living outside Inuit Nunangat were less likely to live in an owner-occupied dwelling and more likely to live in unaffordable housing and be in core housing need.
| Inuit men | Inuit women | Inuit men | Inuit women | |
|---|---|---|---|---|
| Living in Inuit Nunangat | Living outside Inuit Nunangat | |||
| percent | ||||
| In an owner-occupied dwelling | 18.9 | 19.2 | 57.3 | 53.3 |
| In a household spending 30% or more of income on shelter costsTable 8 Note 1 | 3.1 | 2.9 | 20.2 | 23.2 |
| In unsuitable housing | 51.2 | 52.3 | 11.2 | 10.7 |
| In a dwelling requiring major repairs | 31.9 | 31.0 | 11.6 | 12.6 |
| In core housing needTable 8 Note 2 | 48.2 | 48.2 | 14.9 | 17.1 |
|
||||
More information on GBA Plus can be found at the Government of Canada’s Status of Women web page.
More information on the housing experiences of other subpopulations, broken down by age and gender groups, immigrant status, population groups designated as visible minorities, Indigenous populations, and other groups can be found in the additional fact sheets on the Housing Experiences in Canada issue page. Additional data products that focus more on an intersectional GBA Plus analysis of housing experiences will also be released through the Housing Experiences in Canada issue page as they become available.
Household living arrangements

Household living arrangements refer to whether a person lives with another person or people, and, if so, whether they are related to that person or those people. Households can be further differentiated based on whether they are census family households or non-census-family households. Census family households contain at least one census family.Note 15 Non-census-family households are either one person living alone or a group of two or more people who live together but do not constitute a census family (for example, roommates).
According to the 2016 Census, 71.0% of Inuit living in Inuit Nunangat lived as part of a one-census-family household. This was below the rate for the total population (79.6%). Inuit living in Inuit Nunangat in one-census-family households were more likely to live in a one-couple family with children (50.7%) than one without children (3.9%). For the total population, 45.7% of individuals lived in a one-census-family household with children and 22.5% lived in one without children. Inuit living in Inuit Nunangat (16.4%) were more likely to live in a one-parent family household than the total population (11.3%).
Living in a multiple-census-family household was more common for Inuit living in Inuit Nunangat, where 23.6% of individuals lived in multiple-census-family households, compared with 5.1% of the total population. Inuit living outside Inuit Nunangat lived in multiple-census-family households at a similar rate as the total population (5.1%). The greater proportion of multiple-census-family households is partly attributable to multigenerational households.Note 16 Cultural preferences may contribute to the higher rate of multigenerational households, but the situation could also be exacerbated by housing supply shortages in remote areas that put pressure on families who wish to remain in the same region to combine households.
Living in a non-census-family household was less common for Inuit living in Inuit Nunangat (5.5%) than the total population (15.4%). This is because a small proportion of Inuit living in Inuit Nunangat lived alone (3.4%). By comparison, 11.5% of the total population in private households in Canada lived alone.
| Inuit | Total population | |||||
|---|---|---|---|---|---|---|
| Living in Inuit Nunangat | Living outside Inuit Nunangat | |||||
| count | percent | count | percent | count | percent | |
| Total, household type | 47,330 | 100.0 | 17,690 | 100.0 | 34,460,065 | 100.0 |
| One-census-family householdTable 9 Note 1 | 33,585 | 71.0 | 14,150 | 80.0 | 27,414,900 | 79.6 |
| Couple family without children | 1,825 | 3.9 | 2,815 | 15.9 | 7,761,355 | 22.5 |
| Couple family with children | 24,000 | 50.7 | 7,925 | 44.8 | 15,754,465 | 45.7 |
| One parent family | 7,760 | 16.4 | 3,410 | 19.3 | 3,899,085 | 11.3 |
| Multiple-census-family householdTable 9 Note 1 | 11,155 | 23.6 | 905 | 5.1 | 1,746,110 | 5.1 |
| Non-census-family household | 2,595 | 5.5 | 2,640 | 14.9 | 5,299,050 | 15.4 |
| One-person household | 1,625 | 3.4 | 1,705 | 9.6 | 3,967,770 | 11.5 |
| Two- or more person household | 970 | 2.0 | 935 | 5.3 | 1,331,280 | 3.9 |
Source: 2016 Census of Population |
||||||
About the data
The estimates presented in this fact sheet are from the 2016 Census of Population. For detailed information on any of the indicators in this fact sheet, please refer to the Census of Population main page.
The Census of Population data on housing are collected on the long-form questionnaire, which draws its sample from a frame of private dwellings across Canada. Because the survey sample is drawn from private households, individuals in the following situations are not included in the data:
- official representatives of foreign countries living in Canada and their families
- members of religious and other communal colonies
- members of the Canadian Armed Forces living on military bases
- people living in seniors’ residences
- people living full time in institutions (e.g., inmates of penal institutions, and chronic care patients living in hospitals and nursing homes)
- people living in other types of collective dwellings (e.g., shelters, campgrounds and hotels).
Because of data limitations, not all aspects of Inuit’s housing experience could be covered. These aspects include, but are not limited to, homelessness, migration to and from Inuit Nunangat to visit relatives and ancestors, the costs associated with maintaining one’s dwelling, mould, the housing supply and changes in the stock over time, systemic barriers to access, sense of belonging, and proximity to health and social services.
For housing statistics on non-Status and Status First Nations people and Métis, please see the Housing Experiences in Canada issue page.
- Date modified: