
Housing Statistics in Canada
Housing Experiences in Canada: Non-Status First Nations people in 2016
by Jeff Randle and Zachary Thurston
Skip to text
Text begins
The Housing Experiences in Canada series of fact sheets highlights the diversity of housing situations experienced by different groups of people living across Canada.
Description for Figure 1
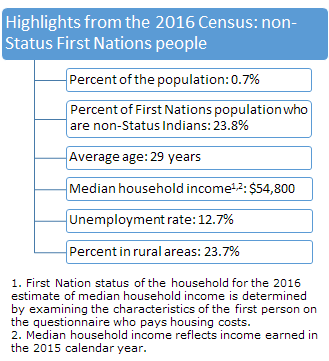
Highlights from the 2016 Census: non-Status First Nations population
This fact sheet focuses on non-Status First Nations people living in private dwellings.Note 1 The statistics below are derived from the 2016 Census. For the purposes of this analysis, non-Status First Nations people were identified based on responses to the Indigenous identity questions on the long-form questionnaire.Note 2 Only individuals who reported a single Indigenous identity of First Nations are included in the analysis.Note 3 Since this fact sheet focuses on non-Status First Nations people living in private dwellings, those living in collective dwellings such as shelters are not included in the data.Note 4 More fact sheets are available on the Housing Experiences in Canada issue page.
The National Housing Strategy Act (2019) declared that “the right to adequate housing is a fundamental human right affirmed in international law.” This right is reaffirmed in the United Nations Declaration on the Rights of Indigenous Peoples (UNDRIP) as an important element of the right to life and dignity for Indigenous peoples. The UNDRIP recognizes the important connections between the right to housing and the right to self-determination, rights related to lands, resources and territories, social and economic rights, and rights related to non-discrimination. The declaration also underscores the importance of Indigenous peoples’ right to development, including the right to determine their own housing institutions, programs and policies.
Adequate housing is understood in international law as housing that provides secure tenure; is affordable; is habitable; provides access to basic infrastructure; is located close to employment, services and amenities; is accessible for people of all abilities; and is culturally appropriate.
This fact sheet focuses on the experience of non-Status First Nations people living in private dwellings using the following indicators collected and produced by Statistics Canada: tenure status of household, dwelling suitability, condition of dwelling, shelter costs, housing affordability, core housing need, and household living arrangements. While these indicators together do not perfectly measure adequate housing as defined in international law, or Indigenous people’s understanding of adequate housing, they are nevertheless useful proxies for understanding the housing experiences of people living in Canada.
Since First Nations people live both on and off reserves, the fact sheet will incorporate a distinction between these regions to highlight housing need differences. To provide additional insight, we also make a distinction later between urban and rural areas to discuss differences in housing need between people living in urban and rural areas. These differences for non-Status First Nations people are contrasted against the total population to examine whether living in rural areas impacts the housing experience of non-Status First Nations people in a similar way.
Tenure status of household

The tenure status of a household refers to whether the household owns or rents its private dwelling.Note 5 Homeownership is an important aspect of Canadian society and can affect outcomes for many housing indicators. For this reason, owner and renter households are often considered separately in housing analyses. In many cases, researchers further examine whether households in owner-occupied dwellings have mortgages on their dwellings and whether renter households pay subsidized rent.
According to the 2016 Census, the majority of non-Status First Nations people lived off reserve. Of the 232,380 non-Status First Nations people in Canada, 227,335 (97.8%) lived off reserve and 5,045 (2.2%) lived on reserve.Note 6
The 227,335 non-Status First Nations people living off reserve can be divided into the 126,030 (55.4%) who lived in a private dwelling owned by a member of their household and the 101,235 (44.5%) who lived in rented dwellings. The share of this group living in owner-occupied dwellings was more than 15 percentage points smaller than the share of the total population (71.6%).Note 7
Of the non-Status First Nations people living off reserve who owned their homes, or lived with someone who owned their home, 97,800 (43.0%) lived in a dwelling with a mortgage, while the remaining 27,215 (12.0%) lived in a dwelling without a mortgage. Non-Status First Nations people living off reserve were about half as likely to live in owner-occupied dwellings without a mortgage as the total population (23.3%).
The non-Status First Nations people living off reserve in rented dwellings can be further divided into the 19,440 (8.6%) living in subsidized housing and the 81,695 (35.9%) not living in subsidized housing. Non-Status First Nations people living off reserve were more likely to live in rented dwellings than the total population (26.6%), and also lived in subsidized rented dwellings at a greater rate than the total population (3.3%).
For the 5,045 non-Status First Nations people living on-reserve, band housing was the most prevalent tenure category with 54.9% of individuals living in band housing.Note 8
| Non-Status First Nations people | Total population | |||||
|---|---|---|---|---|---|---|
| Living on reserve | Living off reserve | |||||
| count | percent | count | percent | count | percent | |
| Total, tenure status | 5,045 | 100.0 | 227,335 | 100.0 | 34,460,065 | 100.0 |
| Owner | 1,425 | 28.2 | 126,030 | 55.4 | 24,683,880 | 71.6 |
| With a mortgage | 560 | 11.1 | 97,800 | 43.0 | 16,670,675 | 48.4 |
| Without a mortgage | 860 | 17.0 | 27,215 | 12.0 | 8,013,205 | 23.3 |
| Renter | 855 | 16.9 | 101,235 | 44.5 | 9,164,150 | 26.6 |
| Subsidized housing | 185 | 3.7 | 19,440 | 8.6 | 1,135,275 | 3.3 |
| Not subsidized housing | 670 | 13.3 | 81,695 | 35.9 | 8,028,875 | 23.3 |
| Band housing | 2,770 | 54.9 | 0 | 0.0 | 220,375 | 0.6 |
|
Note: Figures may not add up to 100% because of rounding Source: 2016 Census of Population |
||||||
Housing suitability

Housing suitability refers to whether a private household is living in suitable accommodations according to the National Occupancy Standard (NOS), that is, whether the dwelling has enough bedrooms for the size and composition of the household. The indicator assesses the required number of bedrooms for a household based on the age and sex of household members, and the relationships between them.
According to the 2016 Census, non-Status First Nations people living off reserve experienced a higher rate of unsuitable housing than the total population, meaning that there were not enough bedrooms in the dwelling to meet the needs of their household, according to the National Occupancy Standard. Of non-Status First Nations people living off reserve, 11.3% lived in unsuitable housing, compared with 8.9% of the total population.
The rate of unsuitable housing was lowest among individuals who lived in dwellings owned by a member of the household and varied little between non-Status First Nations people living off reserve and the total population.
However, the rates among renters were often about three times higher when compared with those among owners. Non-Status First Nations people living off reserve in renter households experienced an unsuitable housing rate of 17.5%, while the rate was 6.4% for Non-Status First Nations people living off reserve in owner-occupied households.
Of non-Status First Nations people living on reserve, 35.9% lived in unsuitable housing. This rate was almost four times higher than the 8.9% of the total population living in unsuitable housing. This difference was even more pronounced for non-Status First Nations people living in band housing, where 45.8% of individuals lived in unsuitable housing in 2016.
| Non-Status First Nations people | Total population | |||||
|---|---|---|---|---|---|---|
| Living on reserve | Living off reserve | |||||
| count | percent | count | percent | count | percent | |
| Total, housing suitability | 5,045 | 100.0 | 227,335 | 100.0 | 34,460,065 | 100.0 |
| Not suitable | 1,810 | 35.9 | 25,735 | 11.3 | 3,081,315 | 8.9 |
| Owner | 300 | 21.1 | 8,010 | 6.4 | 1,335,345 | 5.4 |
| With a mortgage | 75 | 13.4 | 6,380 | 6.5 | 1,062,985 | 6.4 |
| Without a mortgage | 220 | 25.6 | 1,520 | 5.6 | 272,365 | 3.4 |
| Renter | 240 | 28.1 | 17,695 | 17.5 | 1,631,845 | 17.8 |
| Subsidized housing | 80 | 43.2 | 3,040 | 15.6 | 218,130 | 19.2 |
| Not subsidized housing | 160 | 23.9 | 14,615 | 17.9 | 1,413,720 | 17.6 |
| Band housing | 1,270 | 45.8 | 0 | 0.0 | 93,815 | 42.6 |
| Source: 2016 Census of Population | ||||||
Condition of dwelling

Data on condition of dwelling are used to provide some insight into whether housing is habitable. Dwellings are classified into three groups by condition: needing regular maintenance only, needing minor repairs and needing major repairs. Dwellings in need of major repairs are considered to be inadequate housing. Examples of dwellings in need of major repairs include homes with defective plumbing or electrical wiring, and housing needing structural repairs to walls, floors, or ceilings.
According to the 2016 Census, non-Status First Nations people living off reserve were about twice as likely to live in dwellings in need of major repairs as the total population. Of non-Status First Nations people living off reserve, 13.1% lived in dwellings in need of major repairs compared with 6.7% of the total population
Non-Status First Nations people living off reserve in owner-occupied dwellings (10.6%) lived in dwellings in need of major repairs at a rate nearly twice that of the total population in owner-occupied dwellings (5.5%), regardless of the presence of a mortgage. This difference was also present among those in renter households, where non-Status First Nations people living off reserve (16.1%) were more likely to live in a dwelling in need of major repairs than the total population (8.8%).
Among non-Status First Nations people living off reserve in renter households with a subsidy, 18.3% were in dwellings in need of major repairs compared with 11.6% of the total population. Non-Status First Nations people living off reserve in renter households without a subsidy (15.6%) lived in dwellings requiring major repairs at a higher rate than the total population without a subsidy (8.4%).
Of all non-Status First Nations people living on reserve, 39.7% lived in private dwellings that were in need of major repairs. This was more than five times higher than the 6.7% of the total population who lived in dwellings in need of major repairs. Non-Status First Nations people living on reserve in band housing lived in dwellings of need of major repairs at an even higher rate (47.7%), indicating a substantial need for the maintenance of housing infrastructure on reserves.
| Non-Status First Nations people | Total population | |||||
|---|---|---|---|---|---|---|
| Living on reserve | Living off reserve | |||||
| count | percent | count | percent | count | percent | |
| Total, dwelling condition | 5,045 | 100.0 | 227,335 | 100.0 | 34,460,065 | 100.0 |
| Dwelling in need of major repairs | 2,005 | 39.7 | 29,705 | 13.1 | 2,298,760 | 6.7 |
| Owner | 445 | 31.2 | 13,345 | 10.6 | 1,351,740 | 5.5 |
| With a mortgage | 115 | 20.5 | 10,215 | 10.4 | 956,105 | 5.7 |
| Without a mortgage | 330 | 38.4 | 2,960 | 10.9 | 395,640 | 4.9 |
| Renter | 240 | 28.1 | 16,335 | 16.1 | 807,125 | 8.8 |
| Subsidized housing | 60 | 32.4 | 3,565 | 18.3 | 131,670 | 11.6 |
| Not subsidized housing | 185 | 27.6 | 12,725 | 15.6 | 675,460 | 8.4 |
| Band housing | 1,320 | 47.7 | 0 | 0.0 | 108,165 | 49.1 |
| Source: 2016 Census of Population | ||||||
Shelter costs

Shelter costs refer to the monthly dwelling-related expenses paid by households, including mortgage or rent. For owner-occupied dwellings, shelter costs include, where applicable, mortgage payments, property taxes and condominium fees, along with the costs of electricity, heat, water and other municipal services. For renter households, shelter costs include, where applicable, rent and the costs of electricity, heat, water and other municipal services. For the 2016 Census, shelter costs were not disseminated for band housing, dwellings on reserves, and dwellings that are part of an agricultural operation operated by a member of the household.Note 9
In Canada, the median shelter cost paid by non-Status First Nations off-reserve households was $980 in 2016.Note 10 This was similar to the median shelter cost of $1,020 for all private households.
Non-Status First Nations off-reserve households in owner-occupied dwellings had slightly higher median shelter costs than all households in owner-occupied dwellings, while costs were comparable for renters. The median shelter cost paid by non-Status First Nations off-reserve households in owner-occupied dwellings was $1,210, compared with $1,130 for all households. For non-Status First Nations off-reserve households in rented dwellings, the median shelter cost was $880 compared with $910 for all households.
The median shelter cost paid by households in owner-occupied dwellings is typically larger when there is a mortgage, which can represent a large portion of monthly shelter costs. Non-Status First Nations off-reserve households with a mortgage on their dwelling ($1,500) paid slightly less per month in median shelter costs than all households in owner-occupied dwellings with a mortgage ($1,620). Median shelter costs for non-Status First Nations off-reserve households in owner-occupied dwellings without a mortgage ($472) were also slightly lower than those of all households ($540).
The median shelter cost paid by renter households is usually lower for subsidized renter households.Note 11Non-Status First Nations off-reserve households in rented dwellings with a subsidy ($488) had median monthly shelter costs similar to those of all households in rented dwellings with a subsidy ($524). Median shelter costs for non-Status First Nations off-reserve households in rented dwellings without a subsidy ($940) were also comparable to all households in rented dwellings without a subsidy ($960).
| Non-Status First Nations off-reserve households | All households | |
|---|---|---|
| median (dollars) | ||
| Total, shelter costsTable 4 Note 1 | 980 | 1,020 |
| Owner | 1,210 | 1,130 |
| With a mortgage | 1,500 | 1,620 |
| Without a mortgage | 472 | 540 |
| Renter | 880 | 910 |
| Subsidized housing | 488 | 524 |
| Not subsidized housing | 940 | 960 |
|
||
Housing affordability
Housing affordability is derived using the shelter-cost-to-income ratio, which refers to the proportion of average total income that households spend on shelter costs. A household is said to live in affordable housing if it spends less than 30% of its total income on shelter costs.Note 12 For the 2016 Census, the shelter-cost-to-income ratio was not available for band housing, dwellings on reserves, and dwellings that are part of an agricultural operation operated by a member of the household.
According to the 2016 Census, 57,650 non-Status First Nations people living off reserve (25.5%) lived in households that spent more than 30% of their total household income on shelter compared with 20.0% of the total population.
Non-Status First Nations people living off reserve in owner-occupied dwellings (14.2%) experienced unaffordable housing at a rate similar to that of the total population in owner-occupied dwellings (14.7%). This was different for non-Status First Nations people living off reserve in rented dwellings (39.5%), where the rate of unaffordable housing was higher than for the total population (34.5%).
For those living in owner-occupied dwellings, the rate of unaffordable housing differed depending on the presence of a mortgage. In fact, non-Status First Nations people living off-reserve in households with a mortgage (16.8%) were less likely to be in unaffordable housing than the total population (19.6%), while the rates were comparable for those without a mortgage.
The rate of unaffordable housing was similar for non-Status First Nations people living off reserve in renter households with a subsidy (32.8%) compared with the total population with a subsidy (32.3%), and higher for those without a subsidy (41.1% compared with 34.8% for the total population).
| Non-Status First Nations people living off reserve | Total population | |||
|---|---|---|---|---|
| count | percent | count | percent | |
| Total, shelter-cost-to-income ratioTable 5 Note 1 | 225,910 | 100.0 | 33,642,820 | 100.0 |
| Spending more than 30% of income on shelter costs | 57,650 | 25.5 | 6,742,050 | 20.0 |
| Owner | 17,795 | 14.2 | 3,605,535 | 14.7 |
| With a mortgage | 16,380 | 16.8 | 3,257,230 | 19.6 |
| Without a mortgage | 1,415 | 5.2 | 348,300 | 4.4 |
| Renter | 39,855 | 39.5 | 3,136,520 | 34.5 |
| Subsidized housing | 6,360 | 32.8 | 361,270 | 32.3 |
| Not subsidized housing | 33,495 | 41.1 | 2,775,245 | 34.8 |
|
||||
Core housing need
Core housing need touches on several elements of the right to adequate housing. It considers whether the affordability, suitability, and condition of dwelling needs of the household are being met and if not, whether affordable rental housing is available that meets all these needs. A household is said to be in core housing need if their dwelling falls below at least one of the affordability, suitability, or condition of dwelling standards, and would have to spend 30% or more of their total before-tax income to pay the median rent of alternative local housing that is acceptable (meets all three housing standards). Core housing need is not available for band housing or households living on reserves.
According to the 2016 Census, 19.1% of non-Status First Nations people living off reserve were living in households in core housing need. This is almost twice as high as the 10.6% of the total population that were in core housing need.
Non-Status First Nations people living off reserve in owner-occupied dwellings (6.6%) were in core housing need at a slightly higher rate than the total population in owner-occupied dwellings (5.4%), regardless of the presence of a mortgage. This was different for renter households, where the rate of core housing need was higher for non-Status First Nations people living off reserve. The proportion of non-Status First Nations people living off reserve in rented dwellings in core housing need was 35.1%, while for the total population in rented dwellings (25.3%), the rate was nearly 10 percentage points lower.
The incidence of core housing need varied for renters and depended on whether there was a subsidy. Non-Status First Nations people living off reserve in renter households with (44.6%) and without (32.8%) a subsidy were more likely to be in core housing need than the total population in renter households with (39.9%) and without (23.2%) a subsidy.
| Non-Status First Nations people living off reserve | Total population | |||
|---|---|---|---|---|
| count | percent | count | percent | |
| Total, core housing needTable 6 Note 1 | 220,430 | 100.0 | 32,803,125 | 100.0 |
| In core housing need | 42,205 | 19.1 | 3,492,080 | 10.6 |
| Owner | 8,075 | 6.6 | 1,307,620 | 5.4 |
| With a mortgage | 6,155 | 6.4 | 971,150 | 6.0 |
| Without a mortgage | 1,920 | 7.1 | 336,470 | 4.3 |
| Renter | 34,130 | 35.1 | 2,184,455 | 25.3 |
| Subsidized housing | 8,400 | 44.6 | 433,190 | 39.9 |
| Not subsidized housing | 25,730 | 32.8 | 1,751,265 | 23.2 |
|
||||
Household living arrangements
Household living arrangements refer to whether a person lives with another person or people, and, if so, whether they are related to that person or those people. Households can be further differentiated based on whether they are census family households or non-census-family households. Census family households contain at least one census family.Note 13 Non-census-family households are either one person living alone or a group of two or more people who live together but do not constitute a census family (for example, roommates).
According to the 2016 Census, about 68.7% of non-Status First Nations people living off reserve lived as part of a one-census-family household. This was below the rate for the total population (79.6%). Non-Status First Nations people living off reserve in one-census-family households were more likely to live in a couple family with children (38.2%) than in one without children (13.6%). The same was true for the total population, where 45.7% of individuals lived in a one-census-family household with children and 22.4% lived in one without children. Non-Status First Nations people living off reserve (16.9%) were more likely to live in a one-parent-family household than the total population (11.3%).
Living in a multiple-census-family household was much more common for non-Status First Nations people living off reserve (17.2%) than the total population (5.1%). The same was true for non-Status First Nations people living on reserve, where 40.5% of individuals lived as part of a multiple-census-family household. The greater proportion of multiple-census-family households is partly attributable to multigenerational households.Note 14 Cultural preferences may contribute to the observed higher rate of multigenerational households, but the situation may also be exacerbated by housing supply shortages in remote areas that put pressure on families who wish to remain in the same region to combine households.
Living in a non-census-family household was slightly less common for non-Status First Nations people living off reserve (14.2%) compared the total population (15.4%). This is because a smaller proportion of non-Status First Nations people living off reserve lived alone (9.5%). By comparison, 11.5% of the total population in private households in Canada lived alone.
Non-Status First Nations people living on reserve lived in one-census-family households (54.6%) at a much lower rate than the total population. Of these Non-Status First Nations people living on reserve in one-census-family households, 36.2% lived in couple families with children, 5.4% lived in couple families without children and 13.1% lived in one-parent families.
Non-census-family households were also much less common among non-Status First Nations people living on reserve (4.9%) compared with the total population (15.4%). A contributing factor to this difference is that a smaller percentage of non-Status First Nations people living on reserve lived alone (2.6%) compared with the total population.
| Non-Status First Nations people | Total population | |||||
|---|---|---|---|---|---|---|
| Living on reserve | Living off reserve | |||||
| count | percent | count | percent | count | percent | |
| Total, household type | 5,045 | 100.0 | 227,335 | 100.0 | 34,460,065 | 100.0 |
| One-census-family householdTable 7 Note 1 | 2,755 | 54.6 | 156,150 | 68.7 | 27,414,900 | 79.6 |
| Couple family without children | 270 | 5.4 | 30,910 | 13.6 | 7,761,355 | 22.5 |
| Couple family with children | 1,825 | 36.2 | 86,755 | 38.2 | 15,754,465 | 45.7 |
| One parent family | 660 | 13.1 | 38,485 | 16.9 | 3,899,085 | 11.3 |
| Multiple-census-family householdTable 7 Note 1 | 2,045 | 40.5 | 39,020 | 17.2 | 1,746,110 | 5.1 |
| Non-census-family household | 245 | 4.9 | 32,170 | 14.2 | 5,299,050 | 15.4 |
| One-person household | 130 | 2.6 | 21,495 | 9.5 | 3,967,770 | 11.5 |
| Two- or more person household | 115 | 2.3 | 10,670 | 4.7 | 1,331,280 | 3.9 |
Source: 2016 Census of Population |
||||||
Housing experiences of non-Status First Nations men and women
In 1995, the Government of Canada committed to using Gender-based Analysis Plus (GBA Plus) to advance gender equality in Canada, as part of the ratification of the United Nations’ Beijing Platform for Action.
Gender equality is enshrined in the Canadian Charter of Rights and Freedoms, which is part of the Constitution of Canada. Gender equality means that diverse groups of women, men and gender-diverse people are able to participate fully in all spheres of Canadian life, contributing to an inclusive and democratic society.
GBA Plus is an analytical process used to assess how diverse groups of women, men and gender-diverse people may experience policies, programs and initiatives. The “plus” in GBA Plus is not just about differences between people on the basis of gender. Everyone has multiple characteristics that intersect and contribute to who they are. GBA Plus considers many other identity factors, such as race, ethnicity, immigrant status, religion, age, presence of a mental or physical disability, and how the interaction between these factors influences the way people experience government policies and initiatives.
The data presented here highlight differences in housing experiences for non-Status First Nations men and women living on- and off-reserve. Compared to non-Status First Nations men living off reserve, non-Status First Nations women living off reserve were less likely to live in owner-occupied dwellings, more likely to live in unaffordable housing, and more likely to be in core housing need.
| Non-Status First Nations men | Non-Status First Nations women | Non-Status First Nations men | Non-Status First Nations women | |
|---|---|---|---|---|
| Living on reserve | Living off reserve | |||
| percent | ||||
| In an owner-occupied dwelling | 26.6 | 29.8 | 56.1 | 54.8 |
| In unsuitable housing | 35.3 | 36.5 | 11.5 | 11.1 |
| In a dwelling requiring major repairs | 40.3 | 39.4 | 13.3 | 12.9 |
| In a household spending 30% or more of income on shelter costsTable 8 Note 1 | Note ...: not applicable | Note ...: not applicable | 24.6 | 26.4 |
| In core housing needTable 8 Note 2 | Note ...: not applicable | Note ...: not applicable | 18.2 | 20.1 |
... not applicable
|
||||
More information on GBA Plus can be found at the Government of Canada’s Status of Women web page.
More information on the housing experiences of other subpopulations, broken down by age and gender groups, immigrant status, population groups designated as visible minorities, Indigenous populations, and other groups can be found in the additional fact sheets on the Housing Experiences in Canada issue page. Additional data products that focus more on an intersectional GBA Plus analysis of housing experiences will also be released through the Housing Experiences in Canada issue page as they become available.
Housing experiences of non-Status First Nations people living in urban and rural areas
In Canada, living in an urban or rural area can have a profound impact on one’s housing experience.Note 15 Typically, in an urban setting, individuals face higher shelter costs to be closer to employment and other basic social services such as childcare, education, and healthcare. As a result, individuals may be forced to rent rather than own, or live in dwellings that are less affordable or have less space.
The data presented in this section highlight differences in housing experiences for non-Status First Nations people living in urban and rural areas and how these differences compare with the total population living in those areas. Of the 232,380 non-Status First Nations people living in private dwellings in Canada, 177,335 (76.3%) lived in urban areas and 55,045 (23.7%) lived in rural areas.
Non-Status First Nations people lived in owner-occupied dwellings at a higher rate in rural areas (71.9%) than urban areas (49.0%), but these rates were lower when compared with the total population, where individuals living in rural areas (79.1%) also lived in owner-occupied at a higher rate than those in urban areas (69.9%).
Housing affordability challenges were greater in urban areas compared with rural areas for both non-Status First Nations people and the total population. However, the rates of unaffordable housing were also higher for non-Status First Nations people by about 5 to 6 percentage points.
The percentage of people living in dwellings in need of major repairs was higher for those living in rural areas compared with those in urban areas. This could be because of the challenges of providing resources and supplies that are more readily available in urban areas than in remote areas. Non-Status First Nations people were about twice as likely to live in a dwelling in need of major repairs when compared with the total population in urban areas.
| Non-Status First Nations People (urban) | Non-Status First Nations People (rural) | Total population (urban) | Total population (rural) | |
|---|---|---|---|---|
| percent | ||||
| Share of population living in urban or rural area | 76.3 | 23.7 | 81.3 | 18.7 |
| In an owner-occupied dwelling | 49.0 | 71.9 | 69.9 | 79.1 |
| In unsuitable housing | 12.2 | 10.8 | 9.6 | 6.1 |
| Owners | 6.2 | 7.2 | 5.8 | 3.9 |
| Renters | 17.9 | 15.0 | 18.4 | 11.9 |
| In a dwelling requiring major repairs | 12.8 | 16.3 | 5.9 | 10.0 |
| Owners | 9.4 | 13.8 | 4.8 | 8.1 |
| Renters | 16.1 | 17.4 | 8.4 | 13.1 |
| In a household spending 30% or more of income on shelter costsTable 9 Note 1 | 27.7 | 17.7 | 21.5 | 12.8 |
| Owners | 14.6 | 13.4 | 15.6 | 11.0 |
| Renters | 40.4 | 32.4 | 35.3 | 24.8 |
| In core housing needTable 9 Note 2 | 20.8 | 13.3 | 11.4 | 7.1 |
| Owners | 5.7 | 8.4 | 5.5 | 5.1 |
| Renters | 35.7 | 30.2 | 25.7 | 21.0 |
|
||||
About the data
The estimates presented in this fact sheet are from the 2016 Census of Population. For detailed information on any of the indicators in this fact sheet, please refer to the Census of Population main page.
The Census of Population data on housing are collected on the long-form questionnaire, which draws its sample from a frame of private dwellings across Canada. Since the survey sample is drawn from private households, individuals in the following situations are not included in the data:
- official representatives of foreign countries living in Canada, and their families
- members of religious and other communal colonies
- members of the Canadian Armed Forces living on military bases
- people living in seniors’ residences
- people living full time in institutions (e.g., inmates of penal institutions, and chronic care patients living in hospitals and nursing homes)
- people living in other types of collective dwellings (e.g., shelters, campgrounds and hotels).
Because of data limitations, not all aspects of non-Status First Nations people’s housing experiences could be covered. These aspects include, but are not limited to, homelessness, migration to and from reserves to visit relatives and ancestors, the costs associated with maintaining one’s dwelling, mould, the housing supply and changes in the stock over time, systemic barriers to access, sense of belonging, and proximity to health and social services. For additional data on these topics, please see the First Nations Information Governance Centre’s First Nations Data Centre.
For housing statistics on Status First Nations people, Métis and Inuit, please see the Housing Experiences in Canada issue page.
- Date modified: