
Housing Statistics in Canada
Housing Experiences in Canada: Persons with disabilities
by Jeff Randle and Zachary Thurston
Skip to text
Text begins
The Housing Experiences in Canada series of fact sheets highlights the diversity of housing situations experienced by different groups of people living across Canada.
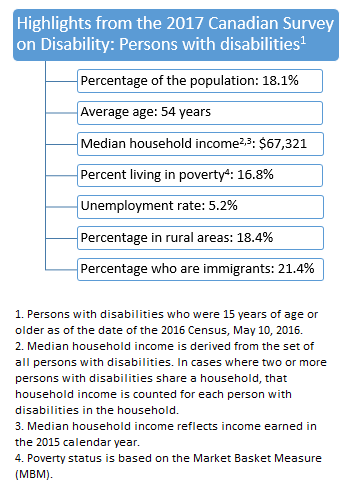
Description for Figure 1
Highlights from the 2017 Canadian Survey on Disability: Persons with disabilitiesNote 1
This fact sheet focuses on persons with disabilities living in private dwellings. Statistics below are derived from the 2017 Canadian Survey on Disability (CSD). The 2017 CSD identifies persons with disabilities based on responses to the disability screening questions in the survey.Note 1Note 2 Since this fact sheet focuses on persons with disabilities in private dwellings, those living in collective dwellings such as hospitals and nursing homes are not included in the data.Note 3 More fact sheets are available on the Housing Experiences in Canada issue page.
The National Housing Strategy Act (2019) declared that “the right to adequate housing is a fundamental human right affirmed in international law.” Adequate housing is understood in international law as housing that provides secure tenure; is affordable; is habitable; provides access to basic infrastructure; is located close to employment, services and amenities; is accessible for persons of all abilities; and is culturally appropriate.
The United Nations Convention on the Rights of Persons with Disabilities (CRPD) also includes specific rights related to housing for persons with disabilities. For instance, the CRPD requires states to provide an adequate standard of living for persons with disabilities and their families, including the right to adequate and accessible housing and to the continuous improvement of living conditions.
This fact sheet focuses on the experience of persons with disabilities living in private dwellings using the following indicators collected and produced by Statistics Canada: tenure status of household, shelter costs, housing affordability and suitability, condition of dwelling, core housing need, and household living arrangements.
To provide a deeper understanding of the housing experience of persons with disabilities, these indicators were linked to the 2017 CSD from the 2016 Census of Population. As a result, the data presented in this fact sheet represent the housing experience of persons with disabilities on May 10, 2016. While these indicators together do not perfectly measure adequate housing as defined in international law, they are nevertheless useful proxies for understanding the housing experiences of people living in Canada.
Tenure status of household

The tenure status of a household refers to whether the household owns or rents its private dwelling.Note 4 Homeownership is an important aspect of Canadian society and can affect outcomes for many housing indicators. For this reason, owner and renter households are often considered separately in housing analyses. In many cases, researchers further examine whether households in owner-occupied dwellings have mortgages on their dwellings and whether renter households pay subsidized rent.
According to the 2017 CSD, 67.4% of the 6,246,640 persons with disabilities lived in a private dwelling owned by a member of their household in 2016. This was smaller than the share of the total population (71.9%) living in owner-occupied dwellings.
The 4,212,450 persons with disabilities who owned their homes or lived with someone who owned their home can be further divided into 2,344,090 (37.5%) who lived in a dwelling with a mortgage, and the remaining 1,802,520 (28.9%) who lived in a dwelling without a mortgage.
Persons with disabilities were more likely to live in an owner-occupied dwelling without a mortgage than the total population (26.3%). This could be, in part, because of the increased prevalence of disability with age, and the positive correlation between age and homeownership in Canada. Among working-age adults aged 25 to 64 years, 20% had a disability; for seniors aged 65 years and older, this figure was almost double, at 38%.Note 5
The remaining 2,033,010 persons with disabilities lived in rented dwellings. These individuals can be further divided into 340,330 (5.4%) living in subsidized housing and 1,689,730 (27.1%) not living in subsidized housing. Persons with disabilities were more likely to live in rented dwellings (32.5%) than the total population (26.4%), and they were also more likely to live in subsidized rented dwellings (5.4%) than the total population (3.0%).
| Persons with disabilitiesTable 1 Note 1 | Total populationTable 1 Note 1 Table 1 Note 2 | |||
|---|---|---|---|---|
| count | percent | count | percent | |
| Total, tenure status | 6,246,640 | 100.0 | 28,643,015 | 100.0 |
| Owner | 4,212,450 | 67.4 | 20,607,185 | 71.9 |
| With a mortgage | 2,344,090 | 37.5 | 13,062,030 | 45.6 |
| Without a mortgage | 1,802,520 | 28.9 | 7,545,155 | 26.3 |
| Renter | 2,033,010 | 32.5 | 7,566,300 | 26.4 |
| Subsidized housing | 340,330 | 5.4 | 869,930 | 3.0 |
| Not subsidized housing | 1,689,730 | 27.1 | 6,696,370 | 23.4 |
Sources: 2017 Canadian Survey on Disablity and 2016 Census of Population |
||||
Housing accessibility
The United Nations Convention on the Rights of Persons with Disabilities (CRPD) also requires states to recognize the equal right of all persons with disabilities to live independently and in the community, with choices equal to others, including by ensuring that persons with disabilities have the opportunity to choose their place of residence and where and with whom they live, and have access to community support services. Canada agreed to follow the CRPD in 2010 and has a duty to fulfill these rights.
An important factor of living independently in the community for persons with disabilities is the accessibility of the dwelling they live in. An accessible dwelling provides persons with disabilities the tools they need to move freely in their home, including persons with physical disabilities. Of the 55.8% of persons with disabilities who have physical disabilities, 44.9% required at least one type of aid, assistive device or accessibility feature within their home.Note 6 Examples of these aids, assistive devices and features include access ramps, walk-in baths or showers, lift devices or elevators, lowered counters, and automatic doors.
Over 1 in 10 (13.0%) of those with physical disabilities indicated there were aids and assistive devices that they needed, but did not have. This indicates that there is still much work to do in Canada to ensure that persons with physical disabilities are able to live independently in their communities.
Shelter costs

Shelter costs refer to the monthly dwelling-related expenses paid by households, including mortgage or rent. For owner-occupied dwellings, shelter costs include, where applicable, mortgage payments, property taxes and condominium fees, along with the costs of electricity, heat, water and other municipal services. For renter households, shelter costs include, where applicable, rent and the costs of electricity, heat, water and other municipal services.Note 7
In Canada, the median shelter cost paid by persons with disabilities was $970 in 2016.Note 8 This was similar to the median shelter cost of $1,020 for all private households.
Persons with disabilities in owner-occupied and rented dwellings also had similar median shelter costs when compared with their counterparts in the total population with the same tenure status.
The median shelter costs paid by households in owner-occupied dwellings are typically larger when there is a mortgage on the dwelling, because a mortgage can represent a large portion of monthly shelter costs. Still, regardless of whether there was a mortgage on the dwelling or not, there were no significant differences between the shelter costs paid by persons with disabilities and the total population.
The same was true for renters, where there was no discernible difference between the median amount paid by persons with disabilities and the total population.
| Persons with disabilitiesTable 2 Note 1 | All householdsTable 2 Note 2 | |
|---|---|---|
| median (dollars) | ||
| Total, shelter costsTable 2 Note 3 | 970 | 1,020 |
| Owner | 1,030 | 1,130 |
| With a mortgage | 1,570 | 1,620 |
| Without a mortgage | 540 | 540 |
| Renter | 910 | 910 |
| Subsidized housing | 510 | 520 |
| Not subsidized housing | 980 | 960 |
|
||
Housing affordability

Housing affordability is derived using the shelter cost-to-income ratio, which refers to the proportion of average total income households spend on shelter costs. A household is said to have affordable housing if it spends less than 30% of its total income on shelter costs.Note 9
According to the 2017 CSD, 1,544,600 persons with disabilities (25.0%) lived in households that spent more than 30% of their total household income on shelter. This was higher than the 19.7% of the total population, despite persons with disabilities having similar or lower median shelter costs. Persons with disabilities also tended to have higher rates of poverty, which may have contributed to the relatively higher rates of unaffordable housing.Note 10
Persons with disabilities in owner-occupied dwellings (15.6%) were slightly more likely to be in unaffordable housing than the total population in owner-occupied dwellings (14.2%). This difference was even greater for persons with disabilities in rented dwellings, where 44.4% of individuals were estimated to live in unaffordable housing compared with 34.6% of the total population.
For persons with disabilities in owner-occupied dwellings, the difference in the rate of unaffordable housing compared with the total population differed depending on the presence of a mortgage. Persons with disabilities in households with a mortgage (21.8%) were slightly more likely to be in unaffordable housing than the total population with a mortgage (19.8%). For persons with disabilities in households without a mortgage (7.4%), the proportion of individuals living in unaffordable housing was higher than for the total population (4.4%).
The rate of unaffordable housing was higher for persons with disabilities in renter households with a subsidy (41.4% compared with 34.9% for the total population) and without a subsidy (45.0% compared with 34.5% for the total population).
| Persons with disabilitiesTable 3 Note 1 | Total populationTable 3 Note 1 Table 3 Note 2 | |||
|---|---|---|---|---|
| count | percent | count | percent | |
| Total, shelter-cost-to-income ratioTable 3 Note 3 | 6,169,340 | 100.0 | 28,013,165 | 100.0 |
| Spending more than 30% of income on shelter costs | 1,544,600 | 25.0 | 5,505,845 | 19.7 |
| Owner | 644,670 | 15.6 | 2,906,115 | 14.2 |
| With a mortgage | 511,810 | 21.8 | 2,574,030 | 19.8 |
| Without a mortgage | 132,870 | 7.4 | 332,090 | 4.4 |
| Renter | 899,930 | 44.4 | 2,599,730 | 34.6 |
| Subsidized housing | 140,860 | 41.4 | 300,220 | 34.9 |
| Not subsidized housing | 759,070 | 45.0 | 2,299,515 | 34.5 |
|
||||
Housing suitability

Housing suitability refers to whether a private household is living in suitable accommodations according to the National Occupancy Standard (NOS), that is, whether the dwelling has enough bedrooms for the size and composition of the household. The indicator assesses the required number of bedrooms for a household based on the age and sex of household members, and the relationships between them.
According to the 2017 CSD, 368,720 persons with disabilities (5.9%) were in unsuitable housing, meaning that there were not enough bedrooms in the dwelling to meet the needs of their household, according to the NOS. This is lower than the 7.9% of the total population living in unsuitable housing, and is partly because of the relatively larger share of persons with disabilities living in one-person households and couple families without children (see Table 8).
Persons with disabilities in owner-occupied and rented dwellings were also less likely to be in unsuitable housing than the total population. More specifically, 3.7% of persons with disabilities in owner-occupied dwellings were estimated to live in unsuitable housing, and 10.4% of persons with disabilities in rented dwellings. For the total population, 5.0% of individuals in owner-occupied dwellings were estimated to live in unsuitable housing, and 15.3% of individuals in rented dwellings.
When owner-occupied dwellings are differentiated by the presence of a mortgage, persons with disabilities living in dwellings with (5.0%) and without (1.9%) a mortgage experienced unsuitable housing at a lower rate than the total population in dwellings with (6.1%) and without (2.9%) a mortgage.
Persons with disabilities in renter households with and without a subsidy had lower rates of unsuitable housing than the total population. There was an 8.9 percentage point difference in the unsuitable housing rate between persons with disabilities (7.2%) and the total population (16.1%) living in subsidized housing and a 4.1 percentage point difference in the unsuitable housing rate between persons with disabilities (11.1%) and the total population (15.2%) living in non-subsidized housing.
| Persons with disabilitiesTable 4 Note 1 | Total populationTable 4 Note 1 Table 4 Note 2 | |||
|---|---|---|---|---|
| count | percent | count | percent | |
| Total, housing suitability | 6,246,640 | 100.0 | 28,643,015 | 100.0 |
| Not suitable | 368,720 | 5.9 | 2,249,695 | 7.9 |
| Owner | 156,960 | 3.7 | 1,025,080 | 5.0 |
| With a mortgage | 116,710 | 5.0 | 802,760 | 6.1 |
| Without a mortgage | 34,720 | 1.9 | 222,325 | 2.9 |
| Renter | 211,710 | 10.4 | 1,155,000 | 15.3 |
| Subsidized housing | 24,530 | 7.2 | 139,790 | 16.1 |
| Not subsidized housing | 187,190 | 11.1 | 1,015,210 | 15.2 |
|
||||
Condition of dwelling

Data on the condition of the dwelling are used to provide some insight into whether housing is habitable. Dwellings are classified into three groups by condition: needing regular maintenance only, needing minor repairs and needing major repairs. Dwellings in need of major repairs are considered to be inadequate housing. Examples of dwellings in need of major repairs include homes with defective plumbing or electrical wiring, and housing needing structural repairs to walls, floors or ceilings.
According to the 2017 CSD, 9.9% of all persons with disabilities lived in private dwellings that were in need of major repairs. This is higher than the 6.4% of the total population that reported living in dwellings in need of major repairs.
Persons with disabilities in owner-occupied dwellings (9.1%) also lived in dwellings in need of major repairs at a higher rate than the total population (5.4%). This was true for renter households as well, where persons with disabilities (11.5%) were more likely to live in a dwelling in need of major repairs than the total population (8.4%).
When individuals in owner-occupied dwellings with a mortgage are compared, 10.4% of persons with disabilities lived in dwellings requiring major repairs compared with 5.8% of the total population. For persons with disabilities in owner-occupied dwellings without a mortgage, 7.3% were estimated to live in dwellings requiring major repairs compared with 4.8% of the total population.
Among persons with disabilities in renter households, 12.5% of those in subsidized housing were in dwellings in need of major repairs and 11.2% of those not living in subsidized housing. This was higher than the proportion of the total renter population with (10.7%) and without (8.1%) a subsidy living in dwellings in need of major repairs.
| Persons with disabilitiesTable 5 Note 1 | Total populationTable 5 Note 1 Table 5 Note 2 | |||
|---|---|---|---|---|
| count | percent | count | percent | |
| Total, dwelling condition | 6,246,640 | 100.0 | 28,643,015 | 100.0 |
| Dwelling in need of major repairs | 616,020 | 9.9 | 1,847,285 | 6.4 |
| Owner | 383,040 | 9.1 | 1,116,900 | 5.4 |
| With a mortgage | 243,660 | 10.4 | 753,670 | 5.8 |
| Without a mortgage | 132,320 | 7.3 | 363,230 | 4.8 |
| Renter | 232,940 | 11.5 | 633,850 | 8.4 |
| Subsidized housing | 42,510 | 12.5 | 93,325 | 10.7 |
| Not subsidized housing | 190,010 | 11.2 | 540,530 | 8.1 |
|
||||
Core housing need

Core housing need touches on several elements of the right to adequate housing. It considers whether the needs of the household in terms of affordability, suitability and the condition of the dwelling are being met and, if not, whether affordable rental housing is available that meets all these needs. A household is said to be in core housing need if its dwelling falls below at least one of the standards for affordability, suitability or the condition of the dwelling, and would have to spend 30% or more of its total before-tax income to pay the median rent of alternative local housing that is acceptable (meets all three housing standards).
According to the 2017 CSD, 15.9% of persons with disabilities were living in households in core housing need. This is higher than the 10.1% of the total population in core housing need.
Persons with disabilities in owner-occupied dwellings (7.4%) were in core housing need at a higher rate than the total population in owner-occupied dwellings (5.2%). For renter households, the rate of core housing need was also higher for persons with disabilities. The proportion of persons with disabilities in rented dwellings in core housing need was 33.6%, while for the total population in rented dwellings, the rate was 23.8%.
The incidence of core housing need was higher for persons with disabilities in owner-occupied dwellings with and without a mortgage compared with the total population. Among persons with disabilities in owner-occupied dwellings with a mortgage, 7.6% were in core housing need compared with 5.8% of the total population. For persons with disabilities in owner-occupied dwellings without a mortgage, 7.2% were in core housing need compared with 4.2% of the total population.
Similarly, the incidence of core housing need varied for renters, depending on whether there was a rent subsidy. Persons with disabilities in renter households with a subsidy (44.5%) were more likely to be in core housing need than the total population with a subsidy (39.6%). The same was true for persons with disabilities in renter households without a subsidy (31.4%), where the rate of core housing need was higher than that of the total population without a subsidy (21.7%).
| Persons with disabilitiesTable 6 Note 1 | Total populationTable 6 Note 1 Table 6 Note 2 | |||
|---|---|---|---|---|
| count | percent | count | percent | |
| Total, core housing needTable 6 Note 3 | 6,024,260 | 100.0 | 27,307,135 | 100.0 |
| In core housing need | 956,480 | 15.9 | 2,750,815 | 10.1 |
| Owner | 302,870 | 7.4 | 1,055,315 | 5.2 |
| With a mortgage | 174,690 | 7.6 | 742,795 | 5.8 |
| Without a mortgage | 128,180 | 7.2 | 312,520 | 4.2 |
| Renter | 653,610 | 33.6 | 1,695,505 | 23.8 |
| Subsidized housing | 146,370 | 44.5 | 329,660 | 39.6 |
| Not subsidized housing | 507,240 | 31.4 | 1,365,840 | 21.7 |
|
||||
Housing experiences of men and women with disabilities
In 1995, the Government of Canada committed to using Gender-based Analysis Plus (GBA Plus) to advance gender equality in Canada, as part of the ratification of the United Nations’ Beijing Platform for Action.
Gender equality is enshrined in the Canadian Charter of Rights and Freedoms, which is part of the Constitution of Canada. Gender equality means that diverse groups of women, men and gender-diverse people are able to participate fully in all spheres of Canadian life, contributing to an inclusive and democratic society.
GBA Plus is an analytical process used to assess how diverse groups of women, men and gender-diverse people may experience policies, programs and initiatives. The “plus” in GBA Plus is not just about differences between people on the basis of gender. Everyone has multiple characteristics that intersect and contribute to who they are. GBA Plus considers many other identity factors, such as race, ethnicity, immigrant status, religion, age, presence of a mental or physical disability, and how the interaction between these factors influences the way people experience government policies and initiatives.
The data presented here highlight differences in housing experiences for men and women with disabilities. Compared with men with disabilities, women with disabilities were more likely to live in owner-occupied dwellings, and less likely to live in unaffordable housing and be in core housing need.
| Men with disabilitiesTable 7 Note 1 | Women with disabilitiesTable 7 Note 1 | |
|---|---|---|
| percent | ||
| In an owner-occupied dwelling | 65.7 | 69.6 |
| In a household spending 30% or more of income on shelter costsTable 7 Note 2 | 27.3 | 21.5 |
| In unsuitable housing | 6.5 | 5.1 |
| In a dwelling requiring major repairs | 10.1 | 9.5 |
| In core housing needTable 7 Note 3 | 16.7 | 13.6 |
|
||
More information on GBA Plus can be found at the Government of Canada’s Status of Women web page.
More information on the housing experiences of other subpopulations, broken down by age and gender groups, immigrant status, population groups designated as visible minorities, Indigenous populations, and other groups can be found in the additional fact sheets on the Housing Experiences in Canada issue page. Additional data products that focus more on an intersectional GBA Plus analysis of housing experiences will also be released through the Housing Experiences in Canada issue page as they become available.
Household living arrangements

Household living arrangements refer to whether a person lives with another person or other people, and, if so, whether they are related to that person or those people. Households can be further differentiated based on whether they are census family households or non-census-family households. Census family households contain at least one census family.Note 11 Non-census-family households are either one person living alone or a group of two or more people who live together but do not constitute a census family (for example, roommates).
According to the 2017 CSD, 71.1% of persons with disabilities lived as part of a one-census-family household. This was below the rate for the total population (76.8%). Persons with disabilities in one-census-family households were more likely to live in a couple family without children (31.3%) than with children (28.2%). The opposite was true for the total population, where 39.5% of individuals lived in a couple family household with children and 27.1% lived in a couple family household without children. Persons with disabilities (11.6%) lived in a one-parent family household at a higher rate than the total population (10.2%).
Living in a non-census-family household was more common for persons with disabilities (25.3%) than the total population (18.5%). This is because a large proportion of persons with disabilities lived alone (20.6%). By comparison, 13.9% of the total population in private households in Canada lived alone.
| Persons with disabilitiesTable 8 Note 1 | Total populationTable 8 Note 1 Table 8 Note 2 | |||
|---|---|---|---|---|
| count | percent | count | percent | |
| Total, household type | 6,246,640 | 100.0 | 28,643,015 | 100.0 |
| One-census-family householdTable 8 Note 3 | 4,439,520 | 71.1 | 21,986,570 | 76.8 |
| Couple family without children | 1,952,760 | 31.3 | 7,752,085 | 27.1 |
| Couple family with children | 1,763,040 | 28.2 | 11,319,220 | 39.5 |
| One parent family | 723,720 | 11.6 | 2,915,265 | 10.2 |
| Multiple-census-family householdTable 8 Note 3 | 227,430 | 3.6 | 1,364,755 | 4.8 |
| Non-census-family household | 1,578,740 | 25.3 | 5,291,690 | 18.5 |
| One-person household | 1,283,940 | 20.6 | 3,967,765 | 13.9 |
| Two- or more person household | 294,800 | 4.7 | 1,323,925 | 4.6 |
Sources: 2017 Canadian Survey on Disablity and 2016 Census of Population |
||||
Housing experiences for persons with disabilities by disability type
Persons with disabilities in Canada are diverse. There are several different types of disabilities, ranging from disabilities that are cognitive in nature to pain-related disabilities, which may be experienced differently by each individual. To gain a further understanding of the housing experiences of persons with disabilities, this section breaks down the housing indicators by type of disability.
Among persons with disabilities, persons with mental health-related and cognitive disabilities were least likely to live in an owner-occupied dwelling, had the highest rates of unaffordable housing, lived in dwellings in need of major repairs more often and were more likely to be in core housing need. In terms of owner-occupied dwellings, 58.3% of persons with mental health-related disabilities and 60.0% of persons with cognitive disabilities lived in owner-occupied dwellings. Rates were higher for those with sensory (69.3%), physical (66.3%) and pain-related (67.4%) disabilities.
For persons with mental health-related and cognitive disabilities, higher rates of unaffordable housing and dwellings requiring major repairs were coupled with a higher rate of core housing need. More specifically, 21.2% of persons with mental health-related disabilities and 20.8% of those with cognitive disabilities lived in core housing need. Rates were lower for those with sensory (16.8%), physical (18.1%) and pain-related (17.0%) disabilities.
| Disability typeTable 9 Note 1 Table 9 Note 2 | |||||
|---|---|---|---|---|---|
| Mental health-related | Cognitive | Physical | Pain-related | Sensory | |
| percent | |||||
| In an owner-occupied dwelling | 58.3 | 60.0 | 66.3 | 67.4 | 69.3 |
| In a household spending 30% or more of income on shelter costsTable 9 Note 3 | 30.8 | 30.4 | 26.9 | 25.8 | 25.1 |
| In unsuitable housing | 6.9 | 7.1 | 6.1 | 6.1 | 6.8 |
| In a dwelling requiring major repairs | 12.0 | 12.3 | 10.3 | 10.6 | 9.3 |
| In core housing needTable 9 Note 4 | 21.2 | 20.8 | 18.1 | 17.0 | 16.8 |
Source: 2017 Canadian Survey on Disability |
|||||
About the data
While the severity of disabilities is not discussed here, it is important to remember that severity is a major factor to consider when looking at the lives of persons with disabilities. Those with more severe disabilities often have lower rates of employment, lower income even when employed full year and full time, and a greater likelihood of living in poverty regardless of age.Note 12
The estimates presented in this fact sheet are from the 2017 Canadian Survey on Disability (CSD) and 2016 Census of Population. For detailed information on any of the indicators in this fact sheet, please refer to the following links.
The 2017 CSD is a national survey of Canadians aged 15 and older whose everyday activities are limited because of a long-term condition or health-related problem. The survey was based on a sample of persons who reported having a long-term condition or difficulty on the activities of daily living question from the 2016 Census long-form questionnaire. All persons who reported having difficulty “sometimes,” “often” or “always” to one of the activities of daily living questions on the 2016 Census long-form questionnaire were included in the sample frame from which the survey sample was drawn.
Since the long-form questionnaire for the 2016 Census did not sample from the institutionalized population and those living in other collective dwellings, the CSD covers only persons living in private dwellings in Canada. As a result, individuals living in the following forms of housing are excluded from the data:
- people living on reserves and in other Indigenous settlements
- official representatives of foreign countries living in Canada, and their families
- members of religious and other communal colonies
- members of the Canadian Armed Forces living on military bases
- people living in seniors’ residences
- people living full time in institutions (e.g., inmates of penal institutions, and chronic care patients living in hospitals and nursing homes)
- people living in other types of collective dwellings (e.g., shelters, campgrounds and hotels).
Respondent data from the 2016 Census were linked to the 2017 CSD. Approximately 300 census variables covering 15 distinct subject-matter areas were selected and linked to the final CSD file for 2017, both for persons with disabilities and for persons without disabilities. These subject-matter areas included sociocultural variables, family and household living arrangements, core housing need, education, employment, and income. It is important to note that these census variables refer to each respondent’s situation on the day of the 2016 Census, that is, as of May 10, 2016, or, in the case of income, the calendar year preceding the census. For more information on the 2017 CSD, please see detailed information for 2017.
- Date modified: