
Housing Statistics in Canada
Residential property ownership: Real estate holdings by multiple-property owners

Archived Content
Information identified as archived is provided for reference, research or recordkeeping purposes. It is not subject to the Government of Canada Web Standards and has not been altered or updated since it was archived. Please "contact us" to request a format other than those available.
by Ellen Bekkering, Jean-Philippe Deschamps-Laporte and Marina Smailes
Investment, Science and Technology Division
Skip to text
Text begins
This article provides information on multiple-property owners in the provinces of British Columbia, Ontario and Nova Scotia whose usual residence is in one of these provinces. This analysis investigates the characteristics of these property owners and their properties. It is based on data from the Canadian Housing Statistics Program for reference year 2018.
Introduction
Homeownership is one of the most significant investments made by Canadians. Previous Statistics Canada studies (Hou 2010; Statistics Canada 2019) have analyzed the profile of single-property owners, but less is known about the characteristics of multiple-property owners.
This article focuses on a subset of multiple-property owners whose usual place of residence is in Nova Scotia, Ontario or British Columbia, and excludes owners who are non-residents of Canada, residents of other provinces and non-individual residential property owners.Note The subset accounts for the majority of multiple-property owners in Ontario (90.0%), British Columbia (81.7%) and Nova Scotia (74.4%), the provinces for which data are currently available. Properties that were not owner-occupied were used to generate income or capital gains (in the case of rental properties and properties bought with the intention of reselling), or for personal use on an occasional basis (e.g., cottages or cabins). Overall, around 1.2 million multiple-property owners were in scope for this article, and they accounted for around 2.1 million properties in the three selected provinces.
This analysis finds that multiple-property owners were concentrated in Toronto and Vancouver, most frequently resided in single-detached houses, and most often owned only one other property in addition to their usual place of residence.
Most multiple-property owners live in Toronto and Vancouver
One of the objectives of the Canadian Housing Statistics Program (CHSP) is to provide information on the demand for housing to better understand the factors driving residential property values across the country. Previous CHSP releases have established that demand by non-residents tends to be concentrated in certain property markets and types (Gellatly and Morissette 2017). This article goes further by providing information about the source of local housing demand, in particular for owners who own more than one property.
Table 1 shows that, in absolute numbers, most multiple-property owners in Ontario and British Columbia lived in Toronto and Vancouver. The distribution of single-property owners, multiple-property owners and the provincial population was similar in those provinces.
| Geographic region | Multiple-property owners | Distribution of multiple-property owners in the province | Distribution of single-property owners in the province |
|---|---|---|---|
| number | percentTable 1 Note 1 | ||
| British Columbia | 268,660 | Note ...: not applicable | Note ...: not applicable |
| Abbotsford–Mission | 8,355 | 3.1 | 4.0 |
| Kelowna | 11,365 | 4.2 | 4.7 |
| Vancouver | 143,910 | 53.6 | 51.3 |
| Victoria | 21,030 | 7.8 | 8.6 |
| Outside CMAs | 84,000 | 31.3 | 31.4 |
| Ontario | 835,175 | Note ...: not applicable | Note ...: not applicable |
| Hamilton | 37,980 | 4.5 | 6.0 |
| Kingston | 11,545 | 1.4 | 1.2 |
| London | 24,195 | 2.9 | 3.8 |
| Ottawa–Gatineau (Ontario part) | 57,770 | 6.9 | 7.7 |
| Toronto | 359,475 | 43.0 | 40.4 |
| St. Catharines–Niagara | 21,810 | 2.6 | 3.5 |
| All other CMAs combined | 134,825 | 16.1 | 17.7 |
| Outside CMAs | 187,570 | 22.5 | 19.7 |
| Nova Scotia | 82,660 | Note ...: not applicable | Note ...: not applicable |
| Halifax | 29,100 | 35.2 | 45.2 |
| Outside CMA | 53,560 | 64.8 | 54.8 |
... not applicable
|
|||
While the highest concentration of multiple-property owners, by far, is in the largest British Columbia and Ontario CMAs, it varies in other geographic areas. In British Columbia, the proportion of multiple-property owners out of all owners who resided in each CMA was fairly consistent, ranging from 15.8% in Vancouver to 12.2% in Abbotsford–Mission. In Ontario, there was a much larger range across the CMAs, going from a high of 21.1% in Thunder Bay to a low of 11.2% in Brantford.
Within the Vancouver and Toronto CMAs, the share of multiple-property owners out of all owners did not reflect the population distribution. In the Vancouver CMA, the proportion of multiple-property owners was highest in the smaller Anmore census subdivision (CSD) (31.0%) and in West Vancouver (27.3%). Similarly, in the Toronto CMA, the highest shares of multiple-property owners were in the King CSD (25.4%) and Richmond Hill CSD (21.0%).
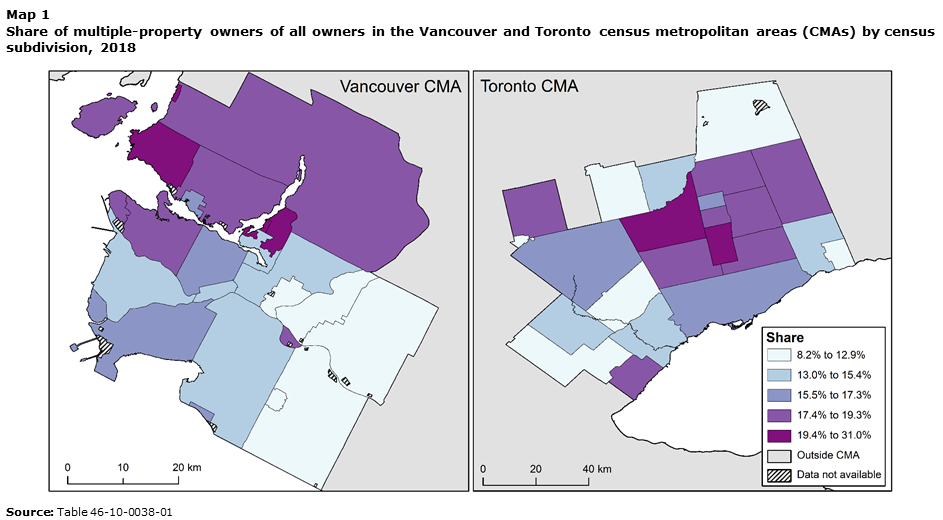
Map description
This figure displays two maps with a shared legend. On the left side is a map of the Vancouver CMA and on the right side is a map of the Toronto CMA. The census subdivisions (CSDs) within each respective CMA are coloured from light blue to dark purple to show the share of multiple-property owners in each CSD, with dark purple showing the highest share of multiple-property owners. Category 1 is coloured light blue and represents a share between 8.2% and 12.9%. Category 2 is coloured medium blue and represents a share between 13.0% and 15.4%. Category 3 is coloured indigo and represents a share between 15.5% and 17.3%. Category 4 is coloured medium purple and represents a share between 17.4% and 19.3%. Category 5 is coloured dark purple and represents a share between 19.4% and 31.0%.Category 6 is coloured pale grey and is used for areas outside of the CMA boundary. Finally, Category 7 is diagonal black stripes over a light grey background, which shows areas where data is not available (within the CMA boundary).
| Census subdivision | |
|---|---|
| percent | |
| Vancouver CMA | |
| Anmore | 31.0 |
| West Vancouver | 27.3 |
| Lions Bay | 25.6 |
| Belcarra | 24.0 |
| Vancouver | 19.3 |
| North Vancouver, district municipality | 19.3 |
| Metro Vancouver A | 18.6 |
| Bowen Island | 18.4 |
| White Rock | 17.3 |
| Burnaby | 16.6 |
| Delta | 16.1 |
| North Vancouver, city | 15.9 |
| Coquitlam | 15.4 |
| Port Moody | 14.8 |
| Surrey | 14.2 |
| Richmond | 14.0 |
| New Westminster | 13.0 |
| Langley, district municipality | 12.9 |
| Port Coquitlam | 11.5 |
| Maple Ridge | 11.0 |
| Pitt Meadows | 10.2 |
| Langley, city | 8.2 |
| Barnston Island 3 | Note ...: not applicable |
| Burrard Inlet 3 | Note ...: not applicable |
| Capilano 5 | Note ...: not applicable |
| Coquitlam 1 | Note ...: not applicable |
| Coquitlam 2 | Note ...: not applicable |
| Katzie 1 | Note ...: not applicable |
| Katzie 2 | Note ...: not applicable |
| Langley 5 | Note ...: not applicable |
| Matsqui 4 | Note ...: not applicable |
| McMillan Island 6 | Note ...: not applicable |
| Mission 1 | Note ...: not applicable |
| Musqueam 2 | Note ...: not applicable |
| Musqueam 4 | Note ...: not applicable |
| Semiahmoo | Note ...: not applicable |
| Seymour Creek 2 | Note ...: not applicable |
| Tsawwassen | Note ...: not applicable |
| Whonnock 1 | Note ...: not applicable |
| Toronto CMA | |
| King | 25.4 |
| Richmond Hill | 21.0 |
| Aurora | 19.3 |
| Uxbridge | 19.0 |
| East Gwillimbury | 18.9 |
| Oakville | 18.3 |
| Markham | 18.2 |
| Mono | 18.2 |
| Whitchurch-Stouffville | 17.8 |
| Vaughan | 17.6 |
| Caledon | 17.2 |
| Toronto | 16.4 |
| Newmarket | 15.5 |
| Mississauga | 15.0 |
| Pickering | 14.3 |
| Bradford West Gwillimbury | 13.8 |
| Halton Hills | 13.0 |
| Georgina | 12.9 |
| Milton | 12.9 |
| New Tecumseth | 12.0 |
| Brampton | 11.9 |
| Ajax | 11.8 |
| Orangeville | 9.0 |
| Chippewas of Georgina Island First Nation | Note ...: not applicable |
| ... not applicable | |
Multiple-property owners share demographic characteristics with single-property owners
In British Columbia and Ontario, while residential property owners tended to be older than people who did not own properties, the age difference between multiple-property and single-property owners was minimal. The median age of multiple-property owners in Ontario (56) and British Columbia (57) was only two years higher than that of single-property owners (54 and 55, respectively). The gap in median age between multiple-property and single-property owners in Nova Scotia was slightly larger, at four years.
Previously released data showed that residential property ownership, in general, tended to be evenly distributed between men and women. This was also the case for the multiple-property ownership.
Most multiple-property owners own two single-detached houses
In the three selected provinces, the majority of multiple-property owners owned two properties. Just over three-quarters of multiple-property owners in British Columbia (76.7%) and Ontario (76.0%) owned two properties, as did 70.2% of multiple-property owners in Nova Scotia.

Data table for Chart 1
| Two properties | Three properties | Four or more properties | |
|---|---|---|---|
| percent | |||
| British Columbia | 76.7 | 15.9 | 7.4 |
| Ontario | 76.0 | 15.9 | 8.1 |
| Nova Scotia | 70.2 | 18.6 | 11.2 |
|
Source: Table 46-10-0038-01 |
|||
Chart 2 shows that, among those who owned two properties and who lived in the provinces’ major CMAs, the most common combination of property types was two single-detached houses. This occurred regardless of where the second property was located in the province, or whether it was owned for rental or recreational purposes, or was vacant.

Data table for Chart 2
| Vancouver | Toronto | Halifax | |
|---|---|---|---|
| percent | |||
| Two single-detached houses | 17.9 | 36.6 | 45.8 |
| Single-detached house and condominium apartment | 15.6 | 16.4 | 3.6 |
| Two condominium apartments | 8.9 | 4.6 | 0.9 |
| Single-detached house and vacant land | 3.0 | 4.7 | 26.1 |
|
|||
The Halifax CMA stands out as having the largest proportion of owners whose two properties were both single-detached houses (45.8%). Because Nova Scotia had comparatively fewer condominium apartments than Ontario and British Columbia, multiple-property combinations containing condominiums were far less common.
The prevalence of the combination of single-detached houses and vacant land properties in Halifax is also notable. In Halifax, this grouping was about nine times more common than in Vancouver, and six times higher than in Toronto. The higher propensity for owners of two properties to own vacant land in Nova Scotia can be explained by the availability of vacant land, as expressed by the relatively larger stock of vacant land and the lower median assessment value of that type of property compared with British Columbia and Ontario.
Most multiple-property owners reside in single-detached houses
The majority of multiple-property owners tended to live in single-detached houses. In Nova Scotia, the vast majority (91.4%) of multiple-property owners occupied a single-detached house, compared with 82.6% in Ontario and 58.1% in British Columbia.
Chart 3 shows that the property type of a multiple-property owner’s usual residence varied across the CMAs. Multiple-property owners in Vancouver and Victoria were the least likely to reside in a single-detached house compared with multiple-property owners in the other CMAs.

Data table for Chart 3
| CMA | Single-detached house | Condominium apartment | Properties with multiple residential units |
|---|---|---|---|
| percent | |||
| Vancouver | 51.8 | 15.9 | 20.4 |
| Victoria | 59.1 | 8.0 | 20.3 |
| Toronto | 73.9 | 9.8 | 0.6 |
| Ottawa–Gatineau (Ontario part) | 78.2 | 4.9 | 1.6 |
| Kitchener–Cambridge–Waterloo | 86.8 | 2.5 | 1.7 |
| Halifax | 85.9 | 4.5 | 4.8 |
| Source: Table 46-10-0038-01 | |||
Nearly half of multiple-property owners own all of their properties within the same area in the Toronto and Vancouver CSDs
Although the CHSP has not yet developed indicators to determine whether a property that is not owner-occupied is rented, vacant or used for recreational purposes, comparing the relative location of the properties with an owner’s usual residence can provide some information about the property’s potential usage. In that context, the data show that most owners lived in the same CSD as their other owned properties in the Toronto and Vancouver CSDs. This means that those owners may be more likely to use their other properties for rental purposes, assuming that owners are more likely to have recreational properties outside the area where they live. The data show that nearly half of multiple-property owners who lived in the Vancouver CSD (44.8%), Surrey CSD (45.8%), Richmond CSD (44.2%) and Toronto CSD (46.8%) also owned properties within the same CSD.
Multiple-property owners have higher-valued usual residences
In all three of the selected provinces, multiple-property owners occupied properties that had higher valuations than those occupied by single-property owners. Table 2 provides the median assessment value of an owner’s usual residence by the number of properties they owned in selected CMAs. It shows that the more properties owned, the higher the median assessment value of the owner’s usual residence. Both in absolute and in relative terms, the value difference of single-property and multiple-property owners’ usual residences is greatest in the Vancouver CMA and lowest in the Halifax CMA. Owners of four or more properties in the Vancouver CMA occupied properties that were valued at $634,000 (67.7%) more than those occupied by single-property owners, compared with a difference of $56,000 (22.9%) in Halifax.
| Census metropolitan area | Single-property owners | Two-property owners | Three-property owners | Four-property or more owners |
|---|---|---|---|---|
| dollars | ||||
| Vancouver | 936,000 | 1,220,000 | 1,410,000 | 1,570,000 |
| Victoria | 680,000 | 794,000 | 870,000 | 969,000 |
| Toronto | 610,000 | 736,000 | 821,000 | 900,000 |
| Ottawa–Gatineau (Ontario part) | 379,000 | 430,000 | 459,000 | 493,000 |
| Kitchener–Cambridge–Waterloo | 339,000 | 395,000 | 427,000 | 456,000 |
| London | 256,000 | 297,000 | 324,000 | 346,000 |
| Halifax | 245,000 | 261,000 | 277,000 | 301,000 |
| Source: Table 46-10-0038-01 | ||||
Multiple-property owners with the highest-value holdings live in Toronto and Vancouver
Comparing the distribution of the total assessment value of properties by the number of properties owned provides information about an owner’s overall holdings.
Multiple-property owners are concentrated in Toronto and Vancouver, and Table 3 shows that the concentration is even greater for multiple-property owners with the highest value of overall property holdings. In Ontario, 86.8% of multiple-property owners with property holdings valued at $10 million or more lived in the Toronto CMA, even though 43.0% of all multiple-property owners lived there.
Similarly, 53.6% of British Columbia’s multiple-property owners lived in the Vancouver CMA, while the majority (78.7%) of multiple-property owners with property holdings valued at $10 million or more resided in that CMA.
| Total assessment value of properties owned | One property | Two properties | Three properties | Four or more properties |
|---|---|---|---|---|
| number of owners | ||||
| British Columbia | ||||
| Less than $1 million | 1,117,530 | 69,970 | 7,635 | 2,030 |
| $1 million to less than $2 million | 312,475 | 78,930 | 13,335 | 4,280 |
| $2 million to less than $5 million | 66,995 | 49,820 | 17,095 | 8,250 |
| $5 million to less than $10 million | 4,705 | 5,835 | 3,605 | 3,795 |
| $10 million or more | 835 | 1,545 | 1,045 | 1,500 |
| Vancouver census metropolitan area (CMA) | ||||
| Less than $1 million | 420,215 | 9,890 | 445 | 80 |
| $1 million to less than $2 million | 280,265 | 47,705 | 4,840 | 800 |
| $2 million to less than $5 million | 64,515 | 45,475 | 13,845 | 5,280 |
| $5 million to less than $10 million | 4,585 | 5,510 | 3,440 | 3,390 |
| $10 million or more | 505 | 990 | 870 | 1,360 |
| Ontario | ||||
| Less than $1 million | 4,452,450 | 416,875 | 60,010 | 18,830 |
| $1 million to less than $2 million | 227,260 | 185,515 | 51,950 | 24,120 |
| $2 million to less than $5 million | 24,000 | 30,385 | 19,925 | 21,420 |
| $5 million to less than $10 million | 860 | 1,550 | 1,030 | 2,555 |
| $10 million or more | 910 | 440 | 205 | 375 |
| Toronto CMA | ||||
| Less than $1 million | 1,665,275 | 90,520 | 5,485 | 845 |
| $1 million to less than $2 million | 212,790 | 154,540 | 31,980 | 7,475 |
| $2 million to less than $5 million | 23,210 | 28,580 | 18,270 | 16,235 |
| $5 million to less than $10 million | 845 | 1,465 | 980 | 2,215 |
| $10 million or more | 905 | 375 | 195 | 315 |
| Source: Table 46-10-0039-01 | ||||
Although the Toronto and Vancouver CMAs had the largest share of multiple-property owners and of high-value multiple-property owners in their respective provinces, Chart 4 shows that, compared with owners in the Toronto CMA, the Vancouver CMA had a greater proportion of owners with high-valued property holdings for each category.

Data table for Chart 4
| Less than $1 million | $1 million to less than $2 million | $2 million to less than $5 million | $5 million to less than $10 million | $10 million or more | |
|---|---|---|---|---|---|
| percent | |||||
| Vancouver - One property | 54.6 | 36.4 | 8.4 | 0.6 | 0.1 |
| Toronto - One property | 87.5 | 11.2 | 1.2 | 0.0 | 0.1 |
| Vancouver - Two properties | 9.0 | 43.5 | 41.5 | 5.0 | 0.9 |
| Toronto - Two properties | 32.9 | 56.1 | 10.4 | 0.5 | 0.1 |
| Vancouver - Three properties | 1.9 | 20.7 | 59.1 | 14.7 | 3.7 |
| Toronto - Three properties | 9.6 | 56.2 | 32.1 | 1.7 | 0.3 |
| Vancouver - Four or more properties | 0.7 | 7.3 | 48.4 | 31.1 | 12.5 |
| Toronto - Four or more properties | 3.1 | 27.6 | 59.9 | 8.2 | 1.2 |
|
Source: Table 46-10-0039-01 |
|||||
Note to readers
The Canadian Housing Statistics Program (CHSP), launched in 2017, provides information on residential property ownership in Canada. This framework leverages administrative data collected from private and public data sources. This information is used by Canadians in a number of ways, including by policy makers to design programs that answer economic and societal needs, by academics to develop new knowledge, and by businesses and individuals who have interests in the real estate market.
In this release, people who own multiple residential properties are people whose name is on the property title of more than one residential property within a given province. For the purposes of this release, people who owned one property in a given province and second property in another province were not included among multiple-property owners at this time. After the CHSP has integrated information from all provinces and territories, this concept will be updated to take into account people who own properties in more than one province.
Demographic analysis of individual resident owners, including birth year and sex, considers the population where demographic information is known and excludes unspecified values when calculating shares so that total shares equal 100%. Demographic information is provided at the owner level and provides details on owner counts and distribution, regardless of their co-ownership status.
References
Gellatly, Guy, and René Morissette. 2017. “Non-resident Ownership of Residential Properties in Toronto and Vancouver: Initial Information from the Canadian Housing Statistics Program.” Economic Insights. Statistics Canada Catalogue no. 11-626-X. Ottawa: Statistics Canada.
Hou, Feng. 2010. Homeownership over the Life Course of Canadians: Evidence from Canadian Censuses of Population. Analytical Studies Branch Research Paper Series, no. 325. Statistics Canada Catalogue no. 11F0019M. Ottawa: Statistics Canada.
Statistics Canada. 2019. “Canadian Housing Statistics Program, 2018.” The Daily.June 11, 2019. Ottawa: Statistics Canada.
- Date modified: