
 StatCan COVID-19: Data to Insights for a Better Canada Changes in the e-commerce strategies of Canadian businesses during the COVID-19 pandemic

Archived Content
Information identified as archived is provided for reference, research or recordkeeping purposes. It is not subject to the Government of Canada Web Standards and has not been altered or updated since it was archived. Please "contact us" to request a format other than those available.
by Gabrielle Asselin and Howard Bilodeau
Text begins
The onset of the COVID-19 pandemic motivated many Canadian businesses to change their business models in order to adapt to economic restrictions and greater demand for online goods and services. This article highlights selected changes in the e-commerce strategies of Canadian businesses from 2019 to 2021.
According to the Canadian Survey on Business Conditions conducted in the second quarter of 2022, since 2020, half of Canadian establishments (51%) introduced innovations to address changing business conditions or restrictions due to the pandemic, while another 42% innovated to address the health impacts and prevention of COVID-19.Note These findings were also reflected in results from the Survey of Digital Technology and Internet UseNote : amid the pandemic in 2021, a third (33%) of Canadian businesses (with five or more employees) received orders or made sales of goods and services over the Internet, up from 25% before the pandemic in 2019.
Canadian businesses added features on their websites and apps
While the COVID-19 pandemic motivated many businesses to sell online for the first time, it also incentivized others to expand their online offerings. In 2021, Canadian businesses that made sales through their websites or apps had an average of 4.0 e-commerce features on those websites or apps, an increase of 12% from 2019 when businesses had 3.5 e-commerce features on average. Similar trends were identified among businesses of all sizes.
The most common e-commerce features on the websites or apps of businesses with e-commerce sales in 2021 were a description of goods or services (85%), a price list for goods or services (72%) and online payment options (71%). The percentage of e-commerce sellers that offered online payment options on their websites or apps increased by 13 percentage points compared with 2019.
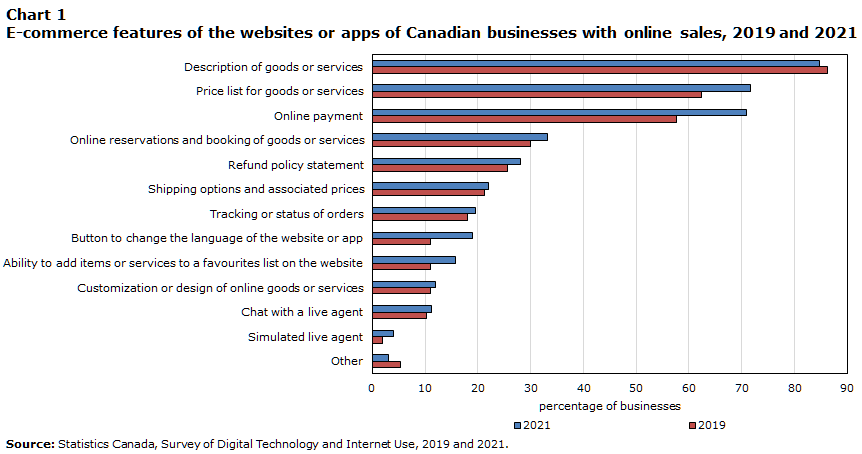
Data table for Chart 1
| Features | 2021 | 2019 |
|---|---|---|
| percentage of businesses | ||
| Description of goods or services | 84.8 | 86.2 |
| Price list for goods or services | 71.7 | 62.3 |
| Online payment | 70.9 | 57.6 |
| Online reservations and booking of goods or services | 33.2 | 29.9 |
| Refund policy statement | 28.0 | 25.6 |
| Shipping options and associated prices | 22.1 | 21.2 |
| Tracking or status of orders | 19.6 | 18.1 |
| Button to change the language of the website or app | 18.9 | 11.0 |
| Ability to add items or services to a favourites list on the website | 15.7 | 11.1 |
| Customization or design of online goods or services | 12.0 | 11.1 |
| Chat with a live agent | 11.2 | 10.3 |
| Simulated live agent | 4.1 | 1.9 |
| Other | 3.1 | 5.3 |
| Source: Statistics Canada, Survey of Digital Technology and Internet Use, 2019 and 2021. | ||
More Canadian businesses reported facing challenges in conducting online sales
As e-commerce sales increased during the pandemic, so too did the proportion of e-commerce sellers reporting challenges selling online (18% in 2021 compared with 14% in 2019). Small e-commerce sellers were more likely to report challenges (19%) than large e-commerce sellers (14%) in 2021. This was the reverse relationship compared with the 2019 survey results, when more large e-commerce sellers (17%) reported facing challenges than small ones (13%).
The difference in e-commerce challenges faced by small and large businesses was most notable in the accommodation and food services sector. As economic restrictions motivated many more small businesses in that sector to sell online (+29 percentage points from 2019 to 2021), a much higher proportion of small e-commerce sellers faced challenges when selling online (24%) than large ones (3%).
Among Canadian businesses that reported facing challenges in conducting sales over the Internet in 2021, high shipping costs were reported as the most common challenge, with almost two-fifths of businesses (39%) encountering this obstacle. This was also true for small businesses (39%); however, for large businesses, security concerns (41%) were the most prevalent issue, ahead of high shipping costs (34%).
Although the pandemic presented new obstacles to many businesses, some aspects of selling online became easier. The percentage of businesses reporting high set-up costs as a challenge in conducting e-commerce sales in 2021 (31%) dropped by 7 percentage points compared with 2019 (38%). High maintenance costs also proved to be less of a challenge when selling online in 2021 (27%) than in 2019 (32%). These findings may be the result of increasing availability of platforms and tools for businesses to expand and manage their e-commerce offerings.
New entrants to e-commerce sales focus on domestic markets
In 2021, a lower percentage of Canadian businesses with e-commerce sales made those sales to customers outside of Canada (19%) compared with 2019 (24%). Despite this, the total number of businesses that exported their e-commerce sales increased marginally from 2019 to 2021. This finding suggests that many of the new entrants to e-commerce sales during the pandemic only had domestic customers. Moreover, on an average basis, Canadian businesses reported that roughly the same percentage of their online sales were exported in 2019 and 2021, providing further evidence that foreign sales did not decline for existing e-commerce sellers.
New entrants to e-commerce sales likely tended to focus on domestic markets due to their familiarity with those markets and to replace lower domestic sales from non-digital channels during periods of economic restrictions. This is supported by the fact that sectors that traditionally make sales in physical locations had the largest increases in the proportion of businesses with e-commerce sales, including the accommodation and food services sector (+24 percentage points) and the retail trade sector (+15 percentage points). Many barriers to selling online, such as high shipping costs, are amplified when exporting.

Data table for Chart 2
| E-commerce sellers | 2019 | 2021 |
|---|---|---|
| number of businesses (x 1,000) | ||
| E-commerce exporters | 19.0 | 19.9 |
| E-commerce non-exporters | 61.6 | 87.1 |
| Source: Statistics Canada, Survey of Digital Technology and Internet Use, 2019 and 2021. | ||
Methodology
E-commerce data in this article are from the 2019 and 2021 iterations of the Survey of Digital Technology and Internet Use (SDTIU).
Data for the 2021 iteration of the SDTIU were collected from November 2021 to March 2022. The target population of this survey includes enterprises with Canadian operations, from most economic sectors, with five or more full or part-time employees based on Statistics Canada’s Business Register. The final sample size was approximately 14,000 enterprises and the response rate was 73%.
Percentages published in this article represent a percentage of businesses, unless otherwise indicated.
The section which describes the e-commerce features of websites or apps only examines the population of Canadian businesses that indicated that they used websites or apps in conducting e-commerce sales or securing orders online in a prior question. Given the population used in that section, “online ordering of goods or services” was not considered to be an e-commerce feature in the count of e-commerce features on websites or apps. All the features that were included in the count of e-commerce features on websites or apps appear in Chart 1.
Minor wording changes were made from 2019 to 2021 to the categories of e-commerce features that appear in Chart 1.
The category “high shipping cost” mentioned in this article was added to question 28 of the SDTIU in 2021, therefore no comparison to previous years is available.
The business size categories presented in this article are based on the number of full-time employees that enterprises reported having on this survey.
Small businesses have 0 to 19 full-time employees.
Large businesses have 100 or more full-time employees, except for manufacturing businesses (NAICS 31-33) where large businesses have 500 or more full-time employees.
Electronic commerce (e-commerce) sales refer to all sales of a business’s goods or services where orders were received, and the commitment to purchase was made, over the Internet. Payment can be made by other means. This includes business to consumer transactions as well as business to business transactions. E-commerce sales refer to sales where orders were received, and the commitment to purchase was made, over the Internet. This includes business to consumer transactions as well as business to business transactions.
- Date modified: