
 StatCan COVID-19: Data to Insights for a Better Canada Analysis on businesses majority-owned by various sub-population groups and visible minorities, fourth quarter of 2021

Archived Content
Information identified as archived is provided for reference, research or recordkeeping purposes. It is not subject to the Government of Canada Web Standards and has not been altered or updated since it was archived. Please "contact us" to request a format other than those available.
by Stephanie Tam, Shivani Sood and Chris Johnston
Text begins
This article provides disaggregated data to better understand the impact of COVID-19 on specific groups. Visit the Gender, Diversity and Inclusion Statistics Hub for more analysis, including disaggregated data on labour, public safety, health and more.
End of text boxThe current business environment impacts Canadian business owners in different ways. Real gross domestic product (GDP) expanded 0.4% in August 2021, placing total economic activity 1.4% below February 2020's pre-pandemic level. The growth was buoyed by higher activity at hotels, restaurants and retailers, and higher factory volumes, while crop production fell sharply for the second consecutive month.Note
While all businesses in Canada have been impacted by the current business environment, different types of businesses have been impacted in different ways. This is also true for different communities that operate businesses in Canada.
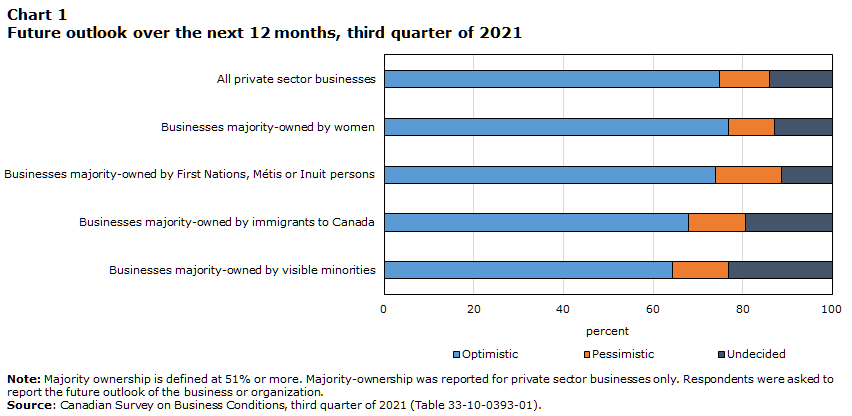
From the beginning of October to early November 2021, Statistics Canada conducted the Canadian Survey on Business Conditions to collect information on the environment businesses are currently operating in and their expectations moving forward. This article explores results from the survey by looking at the businesses majority-ownedNote by women, First Nations, Métis or Inuit persons, immigrants to Canada and visible minorities. In the fourth quarter of 2021, differences were noted in various areas, such as long term optimism, in addition to obstacles such as rising input costs, transportation costs, and recruiting and retaining skilled employees. Results for businesses majority-owned by First Nations, Métis or Inuit persons as well as businesses majority-owned by women reported a similar proportion of positive optimism over the upcoming year to all private sector businesses. Businesses majority-owned by immigrants and visible minorities were less likely to be optimistic than all private sector businesses.
Businesses majority-owned by women have a positive future outlook
Businesses majority-owned by women accounted for 15.6% of all small and medium enterprises (SMEs) in 2017.Note Businesses majority-owned by women were more prevalent in service industries, such as retail trade, accommodation and food services, and tourism.Note
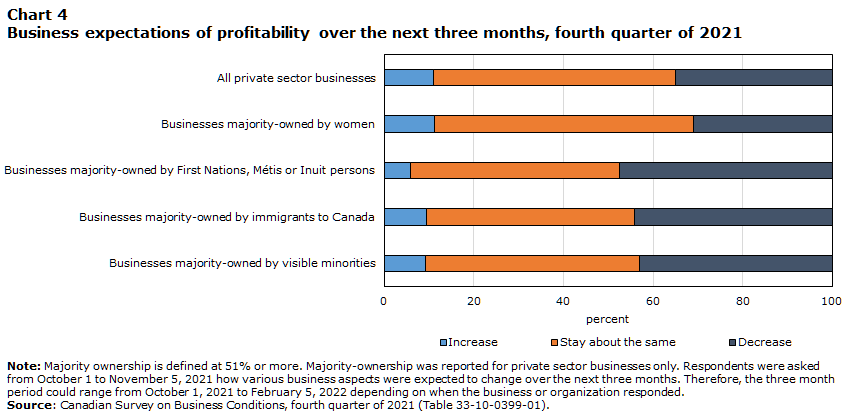
Three-quarters (75.3%) of businesses majority-owned by women reported having an optimistic future outlook over the next 12 months, slightly lower than the third quarter of 2021 (76.7%). These businesses were more likely than all private sector businesses (71.8%) to be optimistic over the next 12 months. Additionally, businesses majority-owned by women were less likely to expect a decrease in the demand for goods and services offered (12.1%) and a decrease in profitability (31.1%) in the next three months,Note when compared to all private sector businesses (15.9% and 35.0% respectively).
In addition, businesses majority-owned by women were less likely to expect to face various obstacles in the next three months compared to all private sector businesses. Under two-fifths (38.1%) of businesses majority-owned by women expected the rising costs of inputs to be an obstacle, compared with over two-fifths (43.7%) of all private sector businesses. Furthermore, one-fifth (20.6%) of businesses majority-owned by women expected retaining skilled employees to be an obstacle, while one-quarter (25.6%) of all private sector businesses said the same. Also, around one-fifth (20.9%) of businesses majority-owned by women expected to have difficulty acquiring inputs, products or supplies domestically and 14.1% of businesses majority-owned by women expected to have difficulty acquiring inputs, products or supplies abroad, compared with all private sector businesses (28.7% and 18.5% respectively).
Businesses majority-owned by First Nations, Métis or Inuit persons anticipate reduced demand and profitability in the months ahead
According to the 2016 census, First Nations, Métis or Inuit persons represented 4.9% of the Canadian population.Note In 2017, 1.4% of SMEs were owned by First Nations, Métis or Inuit persons.Note
Almost three-quarters (72.0%) of businesses majority-owned by First Nations, Métis or Inuit persons indicated having a positive future outlook over the next 12 months, similar to the third quarter (73.8%) and similar to all private sector businesses (71.8%). Businesses majority-owned by First Nations, Métis or Inuit were more likely to expect their number of employees to increase (25.8%) over the next three months when compared with all private sector businesses (12.8%). However, these businesses were more likely to expect a decrease in the demand for goods and services offered (21.1%) and profitability (47.4%) over the next three months, in comparison to all private sector businesses (15.9% and 35.0% respectively).
Businesses majority-owned by First Nations, Métis or Inuit persons were more likely to expect recruiting (46.8%) and retaining (30.2%) skilled employees to be obstacles over the next three months. All private sector businesses were less likely to expect the same obstacles in the same time period (35.2% and 25.6% respectively). Over two-fifths of businesses majority-owned by First Nations, Métis or Inuit persons were also more likely to expect transportation costs (42.9%) and the cost of insurance (43.4%) to be obstacles over the next three months, while nearly one-third of all private sector businesses expected the same, at 32.6% and 32.0% respectively. Businesses majority-owned by First Nations, Métis or Inuit persons were less likely to expect government regulations (11.5%) and travel restrictions and travel bans (11.6%) to be obstacles over the next three months, compared with all private sector businesses (19.1% and 15.9% respectively).
Businesses majority-owned by immigrants to Canada expect difficult business conditions
Immigrants to Canada constituted over one-fifth (21.9%) of the Canadian populationNote and are the primary decision makers for approximately 25.0% of SMEs in Canada, a proportion that has been rising over the past decade.Note Bringing newcomers to Canada remains a priority to drive economic growth and recovery.Note This section presents results on individuals who were born outside of Canada and are majority-owners of businesses in Canada.
Businesses majority-owned by immigrants to Canada were less likely (66.5%) to indicate having an optimistic future outlook over the next 12 months than all private sector businesses (71.8%). These levels of optimism were similar to the third quarter of 2021, where two-thirds (67.8%) of businesses majority-owned by immigrants to Canada indicated having a positive future outlook. Additionally, businesses majority-owned by immigrants to Canada were more likely to expect a decrease in sales (24.4%) and demand (21.0%) of goods and services offered, than all private sector businesses (19.9% and 15.9% respectively). These businesses were also more likely to expect a decrease in profitability (44.1%) when compared with all private sector businesses (35.0%).
Businesses majority-owned by immigrants to Canada were more likely to face obstacles such as attracting new or returning customers (30.3%), maintaining sufficient cash flow or managing debt (26.4%), and travel restrictions and travel bans (20.6%). In contrast, all private sector businesses were less likely to face the same obstacles (20.7%, 20.0%, and 15.9% respectively).
Businesses majority-owned by immigrants to Canada were more likely to expect the absence of government support programs to have a medium-to-high impact on the survival of the business in the next 12 months (43.6%), in comparison with all private sector businesses (33.3%). Furthermore, around one-fifth (21.0%) of businesses majority-owned by immigrants to Canada expect the absence of government support programs to have no impact, compared with nearly one-third (32.3%) of all private sector businesses.
Businesses majority-owned by visible minorities expect declines in sales, demand and profitability over the next three months
According to the 2016 census, visible minorities represented nearly one-quarter (22.3%) of the Canadian population.Note In 2017, 12.2% of SMEs were owned by visible minorities, a proportion that has risen slightly over the past decade.Note For the purposes of the Canadian Survey on Business Conditions, visible minorities are defined as individuals, other than Indigenous persons, who self-identified as non-Caucasian in race or non-white in colour, regardless of place of birth.
Businesses majority-owned by visible minorities were less likely (64.0%) to indicate having an optimistic future outlook over the next 12 months than all private sector businesses (71.8%). These findings are relatively unchanged from the third quarter of 2021. Additionally, businesses majority-owned by visible minorities were more likely to expect a decrease in sales (23.2%) and demand (19.4%) of goods and services offered than all private sector businesses (19.9% and 15.9% respectively). These businesses were also more likely to expect a decrease in profitability (43.1%) when compared with all private sector businesses (35.0%).
Businesses majority-owned by visible minorities were more likely to face obstacles such as attracting new or returning customers (31.4%), fluctuations in consumer demand (29.7%), and maintaining sufficient cash flow or managing debt (28.3%). In contrast, all private sector businesses were less likely to face the same obstacles (20.7%, 22.1%, and 20.0% respectively).
Nearly half (48.4%) of businesses majority-owned by visible minorities expect the absence of government support programs to have a medium-to-high impact on the survival of the business in the next 12 months, while one-third (33.3%) of all private sector businesses said the same. Moreover, less than one-fifth (18.5%) of businesses majority-owned by visible minorities expect the absence of government support programs to have no impact, in comparison with nearly one-third (32.3%) of all private sector businesses.
Appendix
Data table for Chart 1
| Optimistic | Pessimistic | Undecided | |
|---|---|---|---|
| percent | |||
| All private sector businesses | 74.8 | 11.2 | 14.0 |
| Businesses majority-owned by women | 76.7 | 10.4 | 12.8 |
| Businesses majority-owned by First Nations, Métis or Inuit persons | 73.8 | 14.9 | 11.3 |
| Businesses majority-owned by immigrants to Canada | 67.8 | 12.7 | 19.6 |
| Businesses majority-owned by visible minorities | 64.3 | 12.4 | 23.3 |
|
Note: Majority ownership is defined at 51% or more. Majority-ownership was reported for private sector businesses only. Respondents were asked to report the future outlook of the business or organization. Source: Canadian Survey on Business Conditions, third quarter of 2021 (Table 33-10-0393-01). |
|||

Data table for Chart 2
| Optimistic | Pessimistic | Undecided | |
|---|---|---|---|
| percent | |||
| All private sector businesses | 71.8 | 14.5 | 13.7 |
| Businesses majority-owned by women | 75.3 | 13.2 | 11.6 |
| Businesses majority-owned by First Nations, Métis or Inuit persons | 72.0 | 6.9 | 21.1 |
| Businesses majority-owned by immigrants to Canada | 66.5 | 15.7 | 17.8 |
| Businesses majority-owned by visible minorities | 64.0 | 16.7 | 19.3 |
|
Note: Majority ownership is defined at 51% or more. Majority-ownership was reported for private sector businesses only. Respondents were asked to report the future outlook of the business or organization. Source: Canadian Survey on Business Conditions, fourth quarter of 2021 (Table 33-10-0426-01). |
|||
| Q3 2021 | Q4 2021 | |||||
|---|---|---|---|---|---|---|
| Total optimistic | Total pessimistic | Unknown | Total optimistic | Total pessimistic | Unknown | |
| % of businesses | ||||||
| All private sector businesses | 74.8 | 11.2 | 14.0 | 71.8 | 14.5 | 13.7 |
| Businesses majority-owned by women | 76.7 | 10.4 | 12.8 | 75.3 | 13.2 | 11.6 |
| Businesses majority-owned by First Nations, Métis or Inuit persons | 73.8 | 14.9 | 11.3 | 72.0 | 6.9 | 21.1 |
| Businesses majority-owned by immigrants to Canada | 67.8 | 12.7 | 19.6 | 66.5 | 15.7 | 17.8 |
| Businesses majority-owned by visible minorities | 64.3 | 12.4 | 23.3 | 64.0 | 16.7 | 19.3 |
|
Note: Majority ownership is defined at 51% or more. Majority-ownership was reported for private sector businesses only. Respondents were asked to report the future outlook of the business or organization. Source: Canadian Survey on Business Conditions, third quarter of 2021 (Table 33-10-0393-01). Canadian Survey on Business Conditions, fourth quarter of 2021 (Table 33-10-0426-01). |
||||||

Data table for Chart 3
| Increase | Stay about the same | Decrease | |
|---|---|---|---|
| percent | |||
| All private sector businesses | 16.7 | 63.4 | 19.9 |
| Businesses majority-owned by women | 15.4 | 65.9 | 18.7 |
| Businesses majority-owned by First Nations, Métis or Inuit persons | 13.6 | 55.2 | 31.2 |
| Businesses majority-owned by immigrants to Canada | 14.9 | 60.7 | 24.4 |
| Businesses majority-owned by visible minorities | 15.8 | 61.0 | 23.2 |
|
Note: Majority ownership is defined at 51% or more. Majority-ownership was reported for private sector businesses only. Respondents were asked from October 1 to November 5, 2021 how various business aspects were expected to change over the next three months. Therefore, the three month period could range from October 1, 2021 to February 5, 2022 depending on when the business or organization responded. Source: Canadian Survey on Business Conditions, fourth quarter of 2021 (Table 33-10-0399-01). |
|||
Data table for Chart 4
| Increase | Stay about the same | Decrease | |
|---|---|---|---|
| percent | |||
| All private sector businesses | 10.9 | 54.0 | 35.0 |
| Businesses majority-owned by women | 11.3 | 57.6 | 31.1 |
| Businesses majority-owned by First Nations, Métis or Inuit persons | 5.8 | 46.7 | 47.4 |
| Businesses majority-owned by immigrants to Canada | 9.5 | 46.4 | 44.1 |
| Businesses majority-owned by visible minorities | 9.2 | 47.7 | 43.1 |
|
Note: Majority ownership is defined at 51% or more. Majority-ownership was reported for private sector businesses only. Respondents were asked from October 1 to November 5, 2021 how various business aspects were expected to change over the next three months. Therefore, the three month period could range from October 1, 2021 to February 5, 2022 depending on when the business or organization responded. Source: Canadian Survey on Business Conditions, fourth quarter of 2021 (Table 33-10-0399-01). |
|||

Data table for Chart 5
| Increase | Stay about the same | Decrease | |
|---|---|---|---|
| percent | |||
| All private sector businesses | 21.6 | 62.5 | 15.9 |
| Businesses majority-owned by women | 22.6 | 65.3 | 12.1 |
| Businesses majority-owned by First Nations, Métis or Inuit persons | 19.8 | 59.7 | 21.1 |
| Businesses majority-owned by immigrants to Canada | 20.4 | 58.6 | 21.0 |
| Businesses majority-owned by visible minorities | 21.8 | 58.8 | 19.4 |
|
Note: Majority ownership is defined at 51% or more. Majority-ownership was reported for private sector businesses only. Respondents were asked from October 1 to November 5, 2021 how various business aspects were expected to change over the next three months. Therefore, the three month period could range from October 1, 2021 to February 5, 2022 depending on when the business or organization responded. Source: Canadian Survey on Business Conditions, fourth quarter of 2021 (Table 33-10-0399-01). |
|||
| Recruiting skilled employees | Retaining skilled employees | Rising costs of inputs | Cost of insurance | Transportation costs | Fluctuations in consumer demand | Attracting new or returning customers | Maintaining sufficient cash flow or managing debt | |
|---|---|---|---|---|---|---|---|---|
| % of businesses | ||||||||
| All private sector businesses | 35.2 | 25.6 | 43.7 | 32.0 | 32.6 | 22.1 | 20.7 | 20.0 |
| Businesses majority-owned by women | 33.6 | 20.6 | 38.1 | 23.7 | 23.0 | 23.8 | 22.8 | 17.6 |
| Businesses majority-owned by First Nations, Métis or Inuit persons | 46.8 | 30.2 | 46.3 | 43.4 | 42.9 | 19.8 | 12.8 | 21.2 |
| Businesses majority-owned by immigrants to Canada | 28.7 | 22.4 | 43.4 | 32.9 | 33.9 | 25.4 | 30.3 | 26.4 |
| Businesses majority-owned by visible minorities | 29.0 | 25.5 | 43.2 | 33.2 | 30.3 | 29.7 | 31.4 | 28.3 |
|
Note: Majority ownership is defined at 51% or more. Majority-ownership was reported for private sector businesses only. Respondents were asked from October 1 to November 5, 2021 which various business obstacles were expected over the next three months. Therefore, the three month period could range from October 1, 2021 to February 5, 2022 depending on when the business responded. Source: Canadian Survey on Business Conditions, fourth quarter of 2021 (Table 33-10-0400-01). |
||||||||
Methodology
From October 1 to November 5, 2021, representatives from businesses across Canada were invited to take part in an online questionnaire about business conditions and business expectations moving forward. The Canadian Survey on Business Conditions uses a stratified random sample of business establishments with employees classified by geography, industry sector, and size. An estimation of proportions is done using calibrated weights to calculate the population totals in the domains of interest. The total sample size for this iteration of the survey is 36,140 and results are based on responses from a total of 16,528 businesses.
References
Statistics Canada. (2021). Canadian Survey on Business Conditions, third quarter of 2021
Statistics Canada. (2021). Canadian Survey on Business Conditions, fourth quarter of 2021
- Date modified: