
 StatCan COVID-19: Data to Insights for a Better Canada Impact of COVID-19 on small businesses in Canada, fourth quarter of 2021

Archived Content
Information identified as archived is provided for reference, research or recordkeeping purposes. It is not subject to the Government of Canada Web Standards and has not been altered or updated since it was archived. Please "contact us" to request a format other than those available.
by Bernard Li, Shivani Sood and Chris Johnston
Text begins
Small- and medium-sized businesses are significant contributors to the Canadian economy. For context, small businesses made up 98.1% of all employer businesses in Canada in 2021.Note Small businesses employed 9.7 million individuals in Canada – about two-thirds of the total labour force, in 2020. By comparison, medium-sized businesses employed 3.2 million individuals (21.2% of the labour force) and large businesses employed 2.3 million individuals (14.8% of the labour force).Note As such, small businesses play an important role in employing Canadians and are a significant driver towards economic recovery.
From the beginning of October to early November 2021, Statistics Canada conducted the Canadian Survey on Business Conditions to better understand the current environment businesses in Canada are operating in and their expectations moving forward. Small businesses were more likely to expect a decrease in profitability and sales, and were less likely to expect demand for their goods and services to increase over the next three months, compared with larger businesses. Small businesses were more likely to foresee challenges in repaying funding received from repayable government support programs. They were more likely to be uncertain of their future outlook. This article provides insights on the expectations of small business as well as the specific realities faced by these businesses.
Decrease in optimistic outlook from last quarter
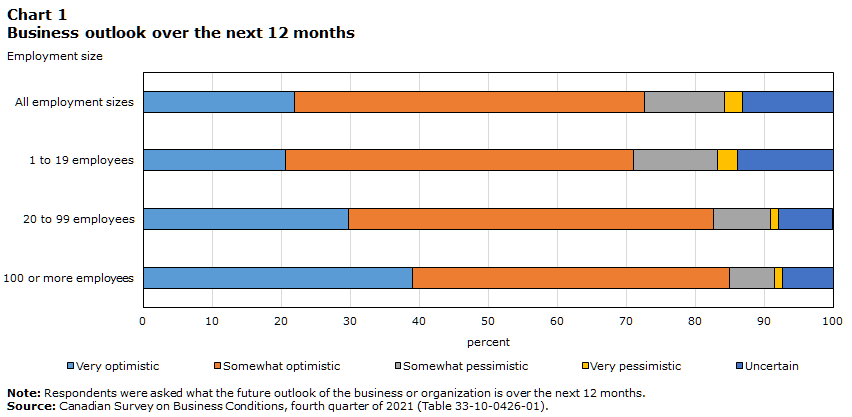
Although the majority of businesses reported that they had an optimistic outlook over the next 12 months, small businesses were less likely to report being optimistic. Less than three-quarters (71.1%) of businesses with 1 to 19 employees reported an optimistic future outlook, compared with over four-fifths of businesses with 20 to 99 employees (82.6%) and 100 or more employees (85.0%). These levels of optimism have decreased somewhat from last quarter, where nearly three-quarters (74.1%) of businesses with 1 to 19 employees, and close to nine in ten businesses with 20 to 99 employees (86.9%) and 100 or more employees (88.7%) had the same outlook.
Additionally, small businesses were more likely to be uncertain of their future outlook. Of businesses with 1 to 19 employees, 13.9% were uncertain of their future outlook, compared with 7.9% of businesses with 20 to 99 employees and 7.4% of businesses with 100 or more employees. These expectations are relatively consistent with those from last quarter, where one in seven (14.3%) businesses with 1 to 19 employees, 7.0% of businesses with 20 to 99 employees and 6.3% of businesses with 100 or more employees were uncertain of their future outlook.
Data table for Chart 1
| Very optimistic | Somewhat optimistic | Somewhat pessimistic | Very pessimistic | Uncertain | |
|---|---|---|---|---|---|
| percent | |||||
| All employment sizes | 21.9 | 50.7 | 11.6 | 2.7 | 13.1 |
| 1 to 19 employees | 20.6 | 50.5 | 12.1 | 2.9 | 13.9 |
| 20 to 99 employees | 29.7 | 52.9 | 8.3 | 1.1 | 7.9 |
| 100 or more employees | 39.0 | 46.0 | 6.5 | 1.1 | 7.4 |
|
Note: Respondents were asked what the future outlook of the business or organization is over the next 12 months. Source: Canadian Survey on Business Conditions, fourth quarter of 2021 (Table 33-10-0426-01). |
|||||
More small businesses expect decrease in sales and profitability than last quarter
Small businesses were more likely to expect a decrease in sales in the short term. Close to one-fifth of businesses with 1 to 19 employees (19.8%) and close to one in seven (13.4%) businesses with 20 to 99 employees expected to see a decrease in sales over the next three months,Note while close to one in ten (9.7%) businesses with 100 or more employees expected the same. These figures are up from last quarter, where nearly one in six (15.5%) businesses with 1 to 19 employees, one in ten (10.4%) businesses with 20 to 99 employees, and 7.1% of businesses with 100 or more employees expected a decrease in sales over the next three months.
| Increase (% of businesses) |
Stay about the same (% of businesses) |
Decrease (% of businesses) |
Not applicable (% of businesses) |
|
|---|---|---|---|---|
| All employment sizes | 16.2 | 61.1 | 18.9 | 3.7 |
| 1 to 19 employees | 15.0 | 61.6 | 19.8 | 3.6 |
| 20 to 99 employees | 24.0 | 58.4 | 13.4 | 4.2 |
| 100 or more employees | 27.3 | 56.3 | 9.7 | 6.6 |
|
Note: Respondents were asked from October 1 to November 5 how their sales were expected to change over the next three months. Therefore, the three month period could range from October 1, 2021 to February 5, 2022 depending on when the business responded. Source: Canadian Survey on Business Conditions, fourth quarter of 2021 (Table 33-10-0399-01). |
||||
Small businesses were less likely to expect demand for their goods and services to increase over the next three months. Just over one-fifth (21.6%) of businesses with 1 to 19 employees expected an increase in demand for their goods and services over the next three months, while around one-third of businesses with 20 to 99 employees (30.3%) and 100 or more employees (34.0%) expected the same.
Over one-third (34.8%) of businesses with 1 to 19 employees and over one-quarter (26.3%) of businesses with 20 to 99 employees expected to see a decrease in profitability, while this was foreseen by less than one-fifth (19.0%) of businesses with 100 or more employees. These numbers have increased from last quarter, when the numbers were 28.5%, 18.5%, and 12.4%, respectively.
| Increase (% of businesses) |
Stay about the same (% of businesses) |
Decrease (% of businesses) |
Not applicable (% of businesses) |
|
|---|---|---|---|---|
| All employment sizes | 10.4 | 52.9 | 33.6 | 3.0 |
| 1 to 19 employees | 9.6 | 52.8 | 34.8 | 2.8 |
| 20 to 99 employees | 16.0 | 53.1 | 26.3 | 4.5 |
| 100 or more employees | 15.7 | 60.9 | 19.0 | 4.4 |
|
Note: Respondents were asked from October 1 to November 5 how their profitability were expected to change over the next three months. Therefore, the three month period could range from October 1, 2021 to February 5, 2022 depending on when the business responded. Source: Canadian Survey on Business Conditions, fourth quarter of 2021 (Table 33-10-0399-01). |
||||
Small businesses more likely to expect some obstacles and financial hardships in the short term
The rising cost of inputs was most commonly expected to be an obstacle for all sizes of businesses over the next three months. Over two-fifths (42.0%) of businesses with 1 to 19 employees expected rising cost of inputs to be obstacles over the next three months, which was similar for businesses with 20 to 99 employees (46.7%) and businesses with 100 or more employees (40.0%).
Other obstacles were more likely to be encountered by small businesses over the next three months. Close to one-sixth (15.4%) of businesses with 1 to 19 employees and nearly one in ten (9.2%) businesses with 20 to 99 employees expected insufficient demand for goods or services to be a challenge over the next three months, while 5.9% of businesses with 100 or more employees anticipated the same. Also, over one-fifth of businesses with 1 to 19 employees (21.5%) and 20 to 99 employees (20.1%) expected fluctuations in consumer demand to be a challenge over the next three months, compared with close to one-sixth (15.1%) of businesses with 100 or more employees that anticipated the same.
Additionally, 11.3% of businesses with 1 to 19 employees and 7.6% of businesses with 20 to 99 employees expect obtaining financing to be a challenge over the next three months, compared with 2.0% of businesses with 100 or more employees. Also, one-fifth (20.7%) of businesses with 1 to 19 employees and nearly one in seven (14.5%) businesses with 20 to 99 employees expected maintaining sufficient cash flow or managing debt to be a challenge over the next three months, while 6.2% of businesses with 100 or more employees.
Small businesses more likely to have financial constraints than their larger counterparts
As COVID-19 restrictions were put in place, many businesses sought external financing in order to survive. Government support programs were put in place to provide a lifeline to businesses as the pandemic impacted their ability to operate and survive. As those support programs are ending, businesses need to reassess how they will continue to operate in their absence.
Small businesses were more likely to foresee challenges in repaying funding received from repayable government support programs over the next 12 months. Nearly two-fifths (39.4%) of businesses with 1 to 19 employees and over one-fifth (21.9%) of businesses with 20 to 99 employees reported having these concerns, compared with 5.8% of businesses with 100 or more employees.
Similarly, small businesses were more likely to expect a medium-to-high impact on their survival if there was an absence of government support programs over the next 12 months. Around one-third of businesses with 1 to 19 employees (33.8%) and 20 to 99 employees (32.1%) expected medium-to-high impact, while just over one-fifth (20.7%) of businesses with 100 or more employees felt the same.
One-fifth (20.6%) of businesses with 1 to 19 employees reported that they did not have the ability to take on more debt. In contrast, 11.9% of businesses with 20 to 99 employees and 5.5% of businesses with 100 or more employees reported not being able to take on more debt.

Data table for Chart 2
| Business can take on more debt | Business cannot take on more debt | Ability of business to take on more debt is unknown | |
|---|---|---|---|
| percent | |||
| All employment sizes | 55.8 | 19.4 | 24.9 |
| 1 to 19 employees | 54.5 | 20.6 | 24.9 |
| 20 to 99 employees | 65.1 | 11.9 | 22.9 |
| 100 or more employees | 61.1 | 5.5 | 33.4 |
|
Note: Respondents were asked if the business or organization had the ability to take on more debt. Source: Canadian Survey on Business Conditions, fourth quarter of 2021 (Table 33-10-0420-01). |
|||
Among businesses that could not take on more debt, the most commonly reported reasons were lack of confidence or uncertainty in future sales and cash flow. Small businesses were more likely to report cash flow as a reason. Nearly half of smaller businesses with 1 to 19 employees (45.0%) and 20 to 99 employees (48.2%) reported cash flow as a reason, compared with nearly a third of larger businesses with 100 or more employees (32.9%). Small businesses were more likely than larger businesses to report a lack of confidence or uncertainty in future sales as a reason. This was reported by nearly half (47.1%) of businesses with 1 to 19 employees and 45.5% of businesses with 20 to 99 employees, in comparison with nearly one-fifth (18.6%) of businesses with 100 or more employees.
Methodology
From October 1 to November 5, 2021, representatives from businesses across Canada were invited to take part in an online questionnaire about business conditions and business expectations moving forward. The Canadian Survey on Business Conditions uses a stratified random sample of business establishments with employees classified by geography, industry sector, and size. An estimation of proportions is done using calibrated weights to calculate the population totals in the domains of interest. The total sample size for this iteration of the survey is 36,140 and results are based on responses from a total of 16,528 businesses or organizations.
References
Statistics Canada. (2021). Canadian Survey on Business Conditions, third quarter of 2021.
Statistics Canada. (2021). Canadian Survey on Business Conditions, fourth quarter of 2021.
- Date modified: