
 StatCan COVID-19: Data to Insights for a Better CanadaA closer look at the
Canada Emergency Wage Subsidy: a rural lens
StatCan COVID-19: Data to Insights for a Better CanadaA closer look at the
Canada Emergency Wage Subsidy: a rural lens

Archived Content
Information identified as archived is provided for reference, research or recordkeeping purposes. It is not subject to the Government of Canada Web Standards and has not been altered or updated since it was archived. Please "contact us" to request a format other than those available.
March 15 to October 24, 2020
by Scott P. Bacon, Ash Munro, Peter Timusk, and Haaris Jafri
Over the course of the COVID-19 pandemic, businesses have had to adapt to challenging circumstances that have affected their ability to earn revenue. The Canada Emergency Wage Subsidy (CEWS) program has provided wage subsidies to eligible employers.Note Statistics Canada has recently released a databaseNote containing key CEWS usage estimates at the regional and community levels covering March 15 to October 24, 2020.Note Based on these data, this article studies the use of the CEWS program by businesses in rural areas.Note
Approximately 220,000 employer businesses were in operation in rural areas in 2020, representing 16.9% of all Canadian employers.Note About 1.9 million persons residingNote in the country’s rural areas were working as employees of businesses in 2020.Note Rural areas feature a vibrant business ecosystem. Factors relevant to the business environment differ between rural and urban areas, including the regional industry mix, employment profiles, and remoteness from important services and amenities.
From March 15 to October 24, 2020, the CEWS program paid out a total of $5.6 billionNote to businesses in rural Canada, supporting an average of approximately 388,000 employees per CEWS claim period.Note This represents approximately 10% of the total CEWS subsidies and about 10% of all employees supported by the program.
Nearly a quarter (23.7%) of subsidy amounts to rural industries were provided to manufacturing. The next largest shares of subsidy amounts were provided to the construction industry (13.6%), followed by accommodation and food services (10.0%). These industries were also the top three in rural areas in terms of the highest average number of employees supported, with respective shares of 21.5%, 11.6%, and 16.8% of the total in rural areas.
On average, subsidies transferred by the program supported one in six (15.8%) rural employees and one in five (20.1%) urban employees.Note In terms of the percentage of employees supported over this time within each industry in rural areas, the impact varied by industry. The highest averages per period were in manufacturing (29.9%), accommodation and food services (29.8%), and mining, quarrying, and oil and gas extraction (24.5%).
In nearly every industry, the average share of employment supported by CEWS was higher in urban areas as compared to rural areas. These results align with those of the Canadian Survey on Business Conditions, which found that urban businesses were more likely than rural ones (57.4% urban, 45.8% rural) to have revenue decreases of 10% or more in 2020 in the majority of industries.Note
Rural businesses accounted for 10% of all CEWS subsidies, with shares varying by region
Over the March 15 to October 24, 2020 period, the CEWS program provided wage subsidies of $5.6 billion to support employers in rural areas, or 10.1% of the total value. These payments supported an average of about 388,000 employees in rural industries. By comparison, in industries in urban areas, over the same interval, the program disbursed subsidies of $50.0 billion and supported an average of 3.4 million employees.
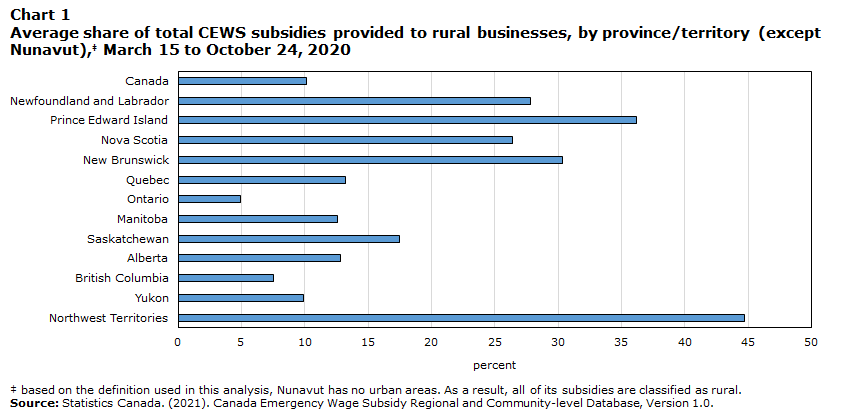
The share of subsidy amounts provided to rural businesses varied by region (Chart 1). Among provinces, rural business shares of CEWS ranged from a low of 4.9% in Ontario to a high of 36.2% in Prince Edward Island. Among territories, shares of CEWS were 9.9% in Yukon and 44.7% in Northwest Territories.Note The shares to rural businesses were higher among the Atlantic provinces than the other provinces.
Data table for Chart 1
| Rural businesses | |
|---|---|
| percent | |
| Canada | 10.1 |
| Newfoundland and Labrador | 27.8 |
| Prince Edward Island | 36.2 |
| Nova Scotia | 26.4 |
| New Brunswick | 30.3 |
| Quebec | 13.2 |
| Ontario | 4.9 |
| Manitoba | 12.6 |
| Saskatchewan | 17.5 |
| Alberta | 12.8 |
| British Columbia | 7.5 |
| Yukon | 9.9 |
| Northwest Territories | 44.7 |
|
Note: Based on the definition used in this analysis, Nunavut has no urban areas. As a result, all of its subsidies are classified as rural. Source: Statistics Canada. (2021). Canada Emergency Wage Subsidy Regional and Community-level Database, Version 1.0. |
|
Nearly one-fourth of total CEWS subsidies in rural areas were provided to the manufacturing industry
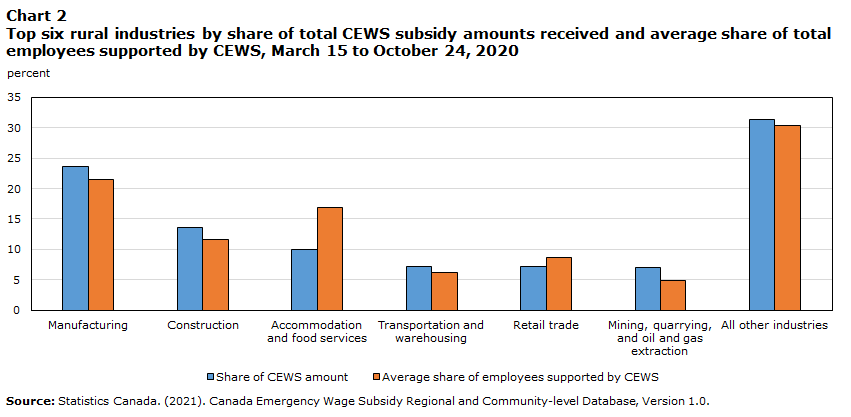
Among rural industries, the largest amounts of subsidies were in manufacturing, construction, and accommodation and food services. These industries made up 23.7%, 13.6%, and 10.0%, respectively, of the $5.6 billion total amount for rural subsidies (Chart 2). The transportation and warehousing, retail trade, and mining, quarrying and oil and gas extraction industries were the next largest recipients of CEWS subsidies, with a share of about 7% each.
Similarly, in terms of the average number of employees supported in rural businesses, the highest values were in manufacturing (21.5%), accommodation and food services (16.8%), and construction (11.6%) (Chart 2). While the CEWS subsidy amounts provided to construction are higher than the amounts provided to accommodation and food services, the latter has a higher share of the total number of supported employees in rural areas. The wages in construction are typically higher than in accommodation and food services, making for larger subsidy amounts even though the number of employees is smaller.Note
Data table for Chart 2
| Industry name | Share of CEWS amount | Average share of employees supported by CEWS |
|---|---|---|
| percent | ||
| Manufacturing | 23.7 | 21.5 |
| Construction | 13.6 | 11.6 |
| Accommodation and food services | 10.0 | 16.8 |
| Transportation and warehousing | 7.2 | 6.3 |
| Retail trade | 7.1 | 8.7 |
| Mining, quarrying, and oil and gas extraction | 7.1 | 4.8 |
| All other industries | 31.3 | 30.3 |
| Source: Statistics Canada. (2021). Canada Emergency Wage Subsidy Regional and Community-level Database, Version 1.0. | ||
CEWS supported an average of nearly one in six rural employees
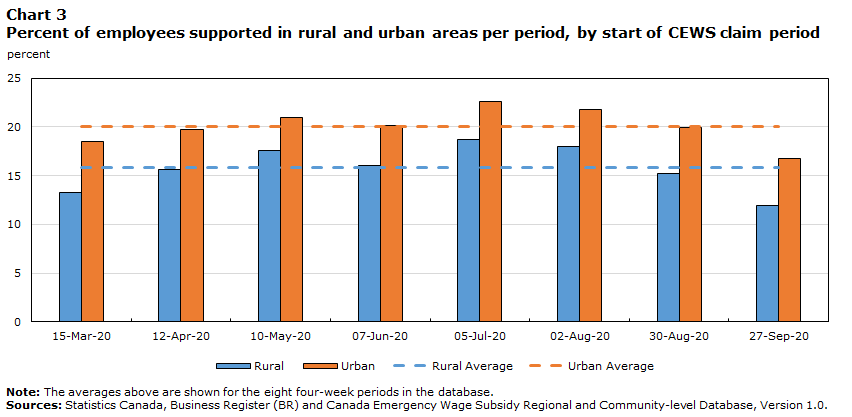
CEWS subsidies supported an average of one in six (15.8%) rural employees and one in five (20.1%) urban employees.Note In each of the eight periods, a greater share of urban employees was supported by the program than rural employees (Chart 3).Note
The highest percentage of employees supported in rural areas was in the period beginning July 5, 2020, at 18.7%, while the lowest, at 11.9%, was in the period that began September 27, 2020. The highest and lowest shares of employees supported among industries in urban areas were 22.7% and 16.8%, respectively, and coincided with those in rural areas. These trends correspond with the easing of lockdown measures as the first wave of the pandemic ran its course, the gradual reopening of businesses, and the buildup of employment in many industries that went with it.Note
Data table for Chart 3
| Rural | Rural Average | Urban | Urban Average | |
|---|---|---|---|---|
| percent | ||||
| 15-Mar-20 | 13.3 | 15.8 | 18.5 | 20.1 |
| 12-Apr-20 | 15.6 | 15.8 | 19.7 | 20.1 |
| 10-May-20 | 17.6 | 15.8 | 21.0 | 20.1 |
| 07-Jun-20 | 16.1 | 15.8 | 20.2 | 20.1 |
| 05-Jul-20 | 18.7 | 15.8 | 22.7 | 20.1 |
| 02-Aug-20 | 18.0 | 15.8 | 21.8 | 20.1 |
| 30-Aug-20 | 15.3 | 15.8 | 19.9 | 20.1 |
| 27-Sep-20 | 11.9 | 15.8 | 16.8 | 20.1 |
|
Note: The averages above are shown for the eight four-week periods in the database. Sources: Statistics Canada, Business Register (BR) and Canada Emergency Wage Subsidy Regional and Community-level Database, Version 1.0. |
||||
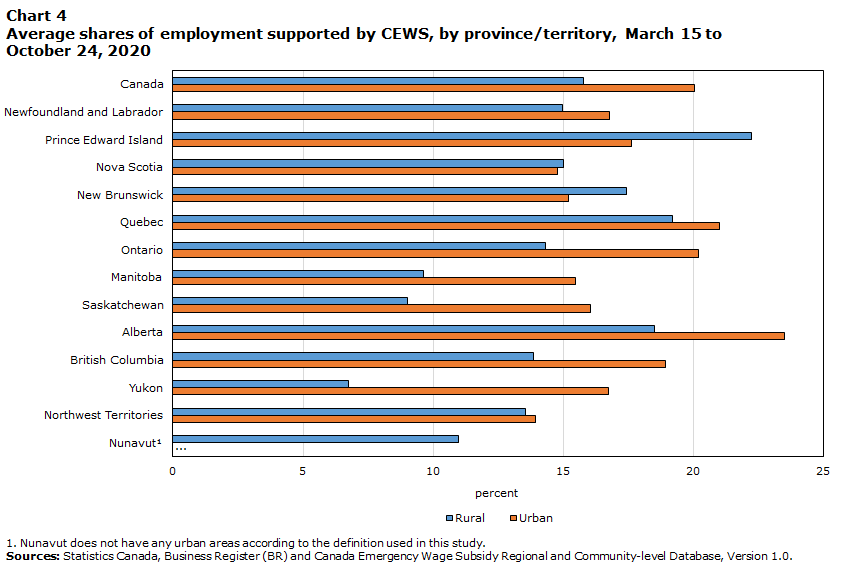
The highest shares of supported employees in rural businesses were in Prince Edward Island (22.3%), Quebec (19.2%), and Alberta (18.5%), while in urban areas, these shares were greatest in Alberta (23.5%), Quebec (21.0%), and Ontario (20.2%) (Chart 4).
Notably in the three Atlantic provinces of Prince Edward Island, Nova Scotia, and New Brunswick, a greater share of rural rather than of urban employees were supported by CEWS.
Data table for Chart 4
| Urban | Rural | |
|---|---|---|
| percent | ||
| Canada | 20.1 | 15.8 |
| Newfoundland and Labrador | 16.8 | 15.0 |
| Prince Edward Island | 17.6 | 22.3 |
| Nova Scotia | 14.8 | 15.0 |
| New Brunswick | 15.2 | 17.4 |
| Quebec | 21.0 | 19.2 |
| Ontario | 20.2 | 14.3 |
| Manitoba | 15.5 | 9.6 |
| Saskatchewan | 16.1 | 9.0 |
| Alberta | 23.5 | 18.5 |
| British Columbia | 18.9 | 13.9 |
| Yukon | 16.8 | 6.8 |
| Northwest Territories | 14.0 | 13.6 |
| NunavutData table for Chart 4 Note 1 | Note ...: not applicable | 11.0 |
... not applicable
|
||
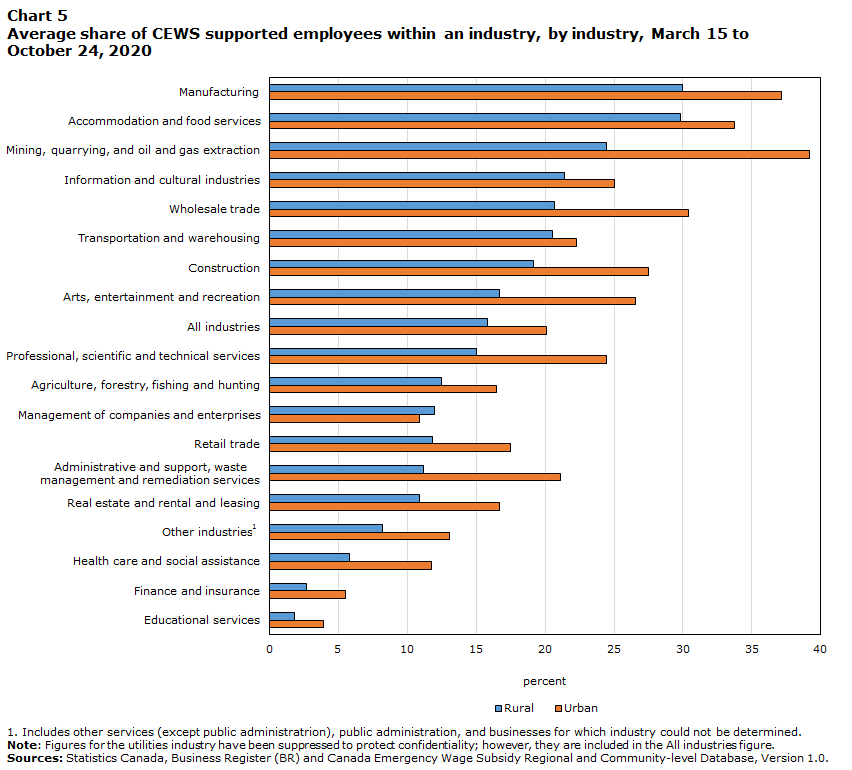
In rural areas, the largest shares of supported employees within an industry were in manufacturing and accommodation and food services
The average share of employees supported by CEWS varied by industry (Chart 5). In rural areas, the highest proportions of employees supported by CEWS within an industry were in manufacturing (29.9%), accommodation and food services (29.8%), and mining, quarrying, and oil and gas extraction (24.5%).
The manufacturing, accommodation and food services, and mining, quarrying, and oil and gas extraction are among the industries with the lowest telework capacities.Note In the face of lockdowns and physical distancing requirements, a greater share of employees in these industries would be unable to work than those in many other industries.
The average share of employees supported by CEWS was lower in industries in rural areas compared to their counterparts in urban areas, with the exception of the management of companies and enterprises industry.
Data table for Chart 5
| Urban | Rural | |
|---|---|---|
| percent | ||
| Manufacturing | 37.1 | 29.9 |
| Accommodation and food services | 33.7 | 29.8 |
| Mining, quarrying, and oil and gas extraction | 39.2 | 24.5 |
| Information and cultural industries | 25.0 | 21.4 |
| Wholesale trade | 30.4 | 20.6 |
| Transportation and warehousing | 22.3 | 20.5 |
| Construction | 27.5 | 19.2 |
| Arts, entertainment and recreation | 26.6 | 16.6 |
| All industries | 20.1 | 15.8 |
| Professional, scientific and technical services | 24.4 | 15.0 |
| Agriculture, forestry, fishing and hunting | 16.5 | 12.5 |
| Management of companies and enterprises | 10.8 | 11.9 |
| Retail trade | 17.5 | 11.8 |
| Administrative and support, waste management and remediation services | 21.1 | 11.2 |
| Real estate and rental and leasing | 16.7 | 10.9 |
| Other industriesData table for Chart 5 Note 1 | 13.0 | 8.2 |
| Health care and social assistance | 11.7 | 5.8 |
| Finance and insurance | 5.5 | 2.6 |
| Educational services | 3.9 | 1.8 |
Sources: Statistics Canada, Business Register (BR) and Canada Emergency Wage Subsidy Regional and Community-level Database, Version 1.0. |
||
Methodology
The Canada Emergency Wage Subsidy Regional and Community-level DatabaseNote was created using Canada Revenue Agency’s Canada Emergency Wage Subsidy (CEWS) microdata and linking these with Statistics Canada’s Business Register. This database covers CEWS periods beginning on March 15, 2020 and ending on October 24, 2020.
Using the Standard Geographical Classification 2016 (SGC),Note these data are available at the following geographical levels: Canada, province/territory, census metropolitan area (CMA), census agglomeration (CA), and census subdivision (CSD). A rural and urban breakdown at the Canada and provincial/territorial levels was also created. CSDs outside CMA/CAs were classified as “rural”, while those inside CMA/CAs, as “urban”. The database also contains breakdowns by industry sector (2-digit NAICS) and subsector (3-digit NAICS) levels.Note
See the Canada Emergency Wage Subsidy Regional and Community-level Database online metadata for more details on the database used in this study.Note
- Date modified: