
 StatCan COVID-19: Data to Insights for a Better Canada Impact of COVID-19 on small businesses in Canada, second quarter of 2021

Archived Content
Information identified as archived is provided for reference, research or recordkeeping purposes. It is not subject to the Government of Canada Web Standards and has not been altered or updated since it was archived. Please "contact us" to request a format other than those available.
by Stephanie Tam, Shivani Sood and Chris Johnston
Text begins
Following the onset of the pandemic, Canada experienced a drastic drop in its real gross domestic product (GDP), with the economy contracting 18.2% between March and April 2020.Note With the gradual easing of pandemic-related restrictions, the business climate began to improve. GDP grew for eleven consecutive months, although overall economic activity is about 1% below February 2020’s pre-pandemic level.Note While recent months showed an improvement in economic activity, in light of the persistence of COVID-19 and repeated changes in restrictions in several provinces, there remain challenges and uncertainty ahead for businesses. By the second quarter of 2021, the Canadian economy had experienced just over a full year of COVID-19.
Small and medium sized businesses are significant contributors to the Canadian economy. For context, small businesses made up 98.0% of all employer businesses in Canada in 2020,Note employing 9.7 million individuals in Canada - approximately 64% of the total labour force. By comparison, medium-sized businesses employed 3.2 million individuals (21.2% of the labour force) and large businesses employed 2.3 million individuals (14.8% of the labour force).Note As such, a significant driver towards economic recovery will be how quickly small businesses in Canada return to pre-pandemic levels.
From the beginning of April to early May 2021, Statistics Canada conducted the Canadian Survey on Business Conditions to better understand the ongoing effects of the pandemic on businesses and business expectations moving forward. Based on the results of the survey, while the majority of businesses in Canada expected to be impacted, smaller businesses expected more significant impacts, such as a decrease in profitability and sales. Small businesses were less likely to be able to take on more debt, have the liquid assets to operate, experience cyber security incidents, adopt or incorporate various technologies, and focus on exports. This article provides insights on the expectations of small business as well as the specific realities faced by these businesses during these unprecedented times.
Small businesses expect challenges in the short-term
Over one-quarter (27.0%) of businesses with 1 to 19 employees and less than one-fifth (17.7%) of businesses with 20 to 99 employees expected to see a decrease in sales over the next three months,Note while 9.7% of businesses with 100 or more employees expected the same.
Additionally, nearly two-fifths (38.7%) of businesses with 1 to 19 employees and over one-quarter (27.7%) of businesses with 20 to 99 employees expect to see a decrease in profitability, while under one-fifth (17.3%) of businesses with 100 or more employees reported the same.
Small businesses were more likely to expect insufficient demand for goods or services offered and the cost of insurance to be an obstacle over the next three months. One-fifth (20.4%) of businesses with 1 to 19 employees and 15.0% of businesses with 20 to 99 employees expected insufficient demand for goods or services to be a challenge over the next three months, while 11.0% of businesses with 100 or more employees anticipated the same. Additionally, around one-quarter of businesses with 1 to 19 employees (26.9%) and 20 to 99 employees (22.9%) expected the cost of insurance to be a challenge over the next three months, compared with 17.6% of businesses with 100 or more employees.
Although the majority of businesses reported that they had an optimistic outlook over the next 12 months, smaller businesses were less likely to report being optimistic, and slightly more likely to be uncertain of their future outlook. Less than three-quarters (72.3%) of businesses with 1 to 19 employees reported an optimistic future outlook, while over four-fifths of larger businesses with 20 to 99 employees (82.7%) and 100 or more employees (86.8%) had the same outlook. Meanwhile, 15.3% of businesses with 1 to 19 employees were uncertain of their future outlook, compared with 9.2% of businesses with 20 to 99 employees and 7.9% of businesses with 100 or more employees.
| Increase (% of businesses) | Stay about the same (% of businesses) | Decrease (% of businesses) | Not applicable (% of businesses) | |
|---|---|---|---|---|
| All employment sizes | 18.8 | 48.7 | 25.7 | 6.9 |
| 1 to 19 employees | 17.0 | 49.1 | 27.0 | 6.9 |
| 20 to 99 employees | 29.8 | 45.8 | 17.7 | 6.6 |
| 100 or more employees | 36.5 | 45.8 | 9.7 | 7.9 |
|
Note: Respondents were asked between April 1 and May 6 how their sales and profitability were expected to change to change over the next three months. Therefore, the three month period could range from April 1 to August 6, 2021, depending on when the business responded. Source: Canadian Survey on Business Conditions, second quarter of 2021 (Table 33-10-0337-01). |
||||
| Increase (% of businesses) | Stay about the same (% of businesses) | Decrease (% of businesses) | Not applicable (% of businesses) | |
|---|---|---|---|---|
| All employment sizes | 12.4 | 45.5 | 37.1 | 5.0 |
| 1 to 19 employees | 11.1 | 45.1 | 38.7 | 5.1 |
| 20 to 99 employees | 21.3 | 46.7 | 27.7 | 4.2 |
| 100 or more employees | 18.1 | 57.5 | 17.3 | 7.0 |
|
Note: Respondents were asked between April 1 and May 6 how their sales and profitability were expected to change over the next three months. Therefore, the three month period could range from April 1 to August 6, 2021, depending on when the business responded. Source: Canadian Survey on Business Conditions, second quarter of 2021 (Table 33-10-0337-01). |
||||
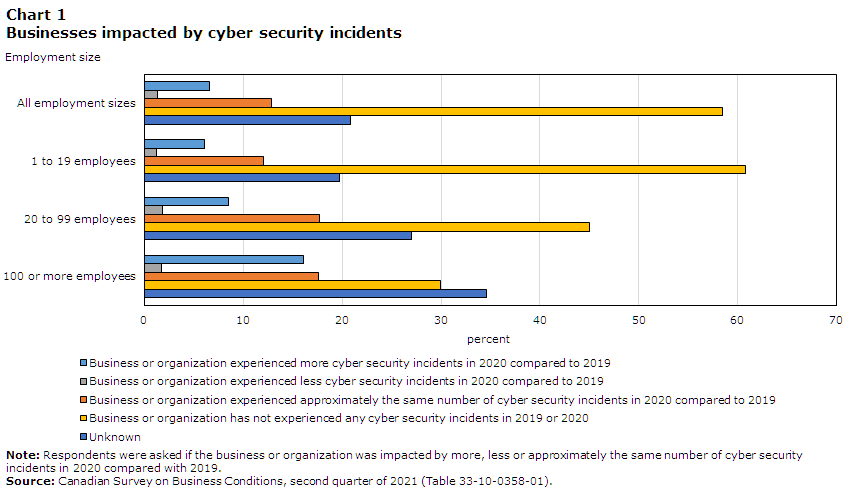
Small businesses less likely to have experienced cyber security incidents
With more and more businesses shifting their operations online and transitioning employees to a teleworking model, cyber security has increasingly become more of a concern. However, smaller businesses were less likely to have reported experiencing cyber security incidents in both 2019 and 2020. While three-fifths (60.8%) of businesses with 1 to 19 employees reported experiencing no cyber security incidents in either year, less than half (45.0%) of businesses with 20 to 99 employees and under one-third (29.9%) of businesses with 100 or more employees reported the same. Additionally, smaller businesses were less likely to report an increase in cyber security incidents in 2020 compared with 2019. Less than one in ten businesses with 1 to 19 employees (6.1%) and 20 to 99 employees (8.5%) reported more cyber security incidents year over year, compared with 16.1% of businesses with 100 or more employees. Consequently, small businesses were less likely to plan to incorporate security software tools over the next 12 months. Over one-quarter (28.0%) of larger businesses with 20 to 99 employees and less than two-fifths (37.5%) of businesses with 100 or more employees planned to incorporate security software tools over the next 12 months, while one-fifth (21.0%) of smaller businesses with 1 to 19 employees reported similar plans.
Data table for Chart 1
| Employment size | Business or organization experienced more cyber security incidents in 2020 compared to 2019 | Business or organization experienced less cyber security incidents in 2020 compared to 2019 | Business or organization experienced approximately the same number of cyber security incidents in 2020 compared to 2019 | Business or organization has not experienced any cyber security incidents in 2019 or 2020 | Unknown |
|---|---|---|---|---|---|
| percent | |||||
| All employment sizes | 6.6 | 1.3 | 12.8 | 58.5 | 20.8 |
| 1 to 19 employees | 6.1 | 1.2 | 12.0 | 60.8 | 19.7 |
| 20 to 99 employees | 8.5 | 1.8 | 17.7 | 45.0 | 27.0 |
| 100 or more employees | 16.1 | 1.7 | 17.6 | 29.9 | 34.6 |
|
Note: Respondents were asked if the business or organization was impacted by more, less or approximately the same number of cyber security incidents in 2020 compared with 2019. Source: Canadian Survey on Business Conditions, second quarter of 2021 (Table 33-10-0358-01). |
|||||
Meanwhile, smaller businesses were less likely to adopt or incorporate various technologies.Note While nearly two-thirds (61.1%) of businesses with 1 to 19 employees reported no plans to adopt or incorporate these technologies, half (49.8%) of businesses with 20 to 99 employees and over one-third (35.5%) of businesses with 100 or more employees said the same. If businesses were planning to adopt or incorporate these technologies, smaller businesses were more likely to report having access to financial resources to invest in new technologies to be challenging. Nearly one-third (30.5%) of businesses with 1 to 19 employees and over one-fifth (22.5%) of businesses with 20 to 99 employees reported access to financial resources as challenging, compared with 16.3% of businesses with 100 or more employees.
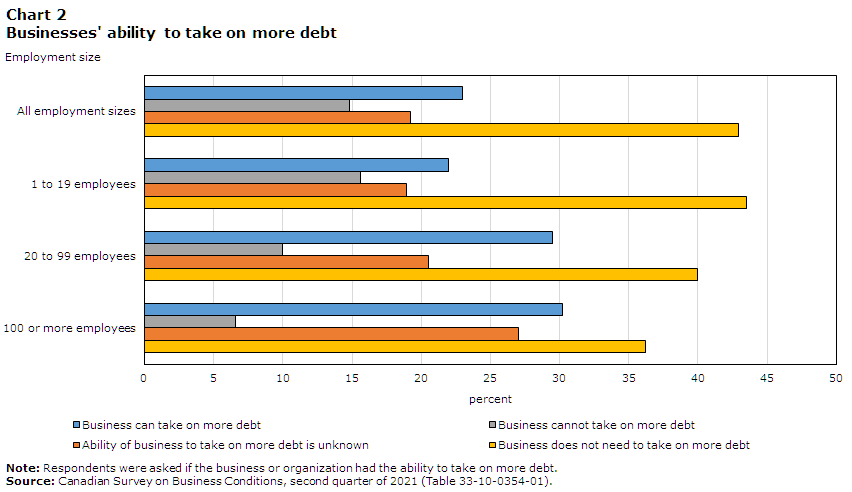
Small businesses more likely to have financial constraints
As COVID-19 restrictions were put in place, many businesses sought external financing in order to survive. As a result, some businesses have now reached a point where they do not have the ability to take on more debt. Smaller businesses were more likely to report this being the case. At the same time, smaller businesses were less likely to report having the cash or liquid assets required to operate.
One in seven (15.6%) businesses with 1 to 19 employees and 10.0% of businesses with 20 to 99 employees reported that they did not have the ability to take on more debt. In contrast, 6.6% of businesses with 100 or more employees reported not being able to take on more debt. In comparison, over two-fifths (42.9%) of businesses of all sizes reported that they did not need to take on more debt.
Data table for Chart 2
| Employment size | Business can take on more debt | Business cannot take on more debt | Ability of business to take on more debt is unknown | Business does not need to take on more debt |
|---|---|---|---|---|
| percent | ||||
| All employment sizes | 23.0 | 14.8 | 19.2 | 42.9 |
| 1 to 19 employees | 22.0 | 15.6 | 18.9 | 43.5 |
| 20 to 99 employees | 29.5 | 10.0 | 20.5 | 40.0 |
| 100 or more employees | 30.2 | 6.6 | 27.0 | 36.2 |
|
Note: Respondents were asked if the business or organization had the ability to take on more debt. Source: Canadian Survey on Business Conditions, second quarter of 2021 (Table 33-10-0354-01). |
||||
Of businesses that could not take on more debt, the most commonly reported reasons were lack of confidence or uncertainty in future sales and cash flow. Smaller businesses with 1 to 19 employees were less likely to report cash flow as a reason (45.9%), compared with larger businesses with 20 to 99 employees (60.7%) or 100 or more employees (67.7%). However, smaller businesses with 1 to 19 employees were more likely to report lack of confidence or uncertainty in future sales as a reason (57.2%), in comparison to larger businesses with 20 to 99 employees (44.1%) and 100 or more employees (53.3%).
Around one-fifth of businesses with 1 to 19 employees (23.1%) and 20 to 99 employees (17.8%) expected maintaining sufficient cash flow to be an obstacle over the next three months. Conversely, 9.3% of businesses with 100 or more employees reported similar concerns.
More than two-thirds (67.6%) of businesses with 1 to 19 employees and less than three-quarters (74.3%) of businesses with 20 to 99 employees reported that they could continue to operate for 12 months or more before considering closure or bankruptcy, while nearly four-fifths (79.2%) of businesses with 100 or more employees said the same.
Almost three-quarters (74.0%) of businesses with 1 to 19 employees and four-fifths (81.6%) of businesses with 20 to 99 employees reported that they had the cash or liquid assets required to operate, while 85.0% of businesses with 100 or more employees said the same.
Small businesses less likely to focus on exports
In 2019, 50,542 Canadian establishments exported goods with a value totaling $533.3 billion. SMEs accounted for 37.7% of the total value of exported goods, whereas businesses with 1 to 99 employees accounted for 16.6%. In 2020, Canada’s main export destination was the United States, followed by China and the United Kingdom.Note
Small businesses were less likely to focus on any international activity in the next 12 months.Note One in ten (11.1%) businesses with 1 to 19 employees and 14.2% of businesses with 20 to 99 employees stated they planned to focus on any international activity in the next 12 months. In contrast, one-fifth (20.3%) of businesses with 100 or more employees reported the same. If businesses reported that they planned to focus on international activities, small businesses were less likely to primarily plan to focus on exports over the next 12 months. While 11.0% of businesses with 100 or more employees reported they would primarily focus on exports over the next 12 months, 4.6% of businesses with 1 to 19 employees and 7.2% of businesses with 20 to 99 employees said the same.

Data table for Chart 3
| Employment size | Businesses that primarily plan to focus on exports over the next 12 months |
|---|---|
| percent | |
| All employment sizes | 5.0 |
| 1 to 19 employees | 4.6 |
| 20 to 99 employees | 7.2 |
| 100 or more employees | 11.0 |
|
Note: Respondents were asked what type of international activity the business or organization primarily planned to focus on over the next 12 months. Source: Canadian Survey on Business Conditions, second quarter of 2021 (Table 33-10-0358-01). |
|
Of those businesses that plan to focus on international activity over the next 12 months, the majority plan to focus on the international market of the United States. Businesses with 1 to 19 employees (52.8%), 20 to 99 employees (70.0%), and 100 or more employees (63.6%) reported that they primarily plan to focus on the United States as an international market. On the other hand, a smaller proportion of businesses with 1 to 19 employees (15.4%), 20 to 99 employees (13.5%), and 100 or more employees (14.1%) plan to focus on Asia. Additionally, a smaller proportion of businesses with 1 to 19 employees (16.8%), 20 to 99 employees (8.6%), and 100 or more employees (11.4%) plan to focus on Europe.
Smaller businesses seek advice and interact with new customers differently than larger businesses
Small businesses were more likely to consult their friends or family for advice related to opportunities or challenges. Over one-third (36.2%) of businesses with 1 to 19 employees reported they would consult friends or family for advice over the next 12 months, while around one-fifth of businesses with 20 to 99 employees (22.1%) and 100 or more employees (15.8%) said the same.
However, smaller businesses were less likely to consult employees or colleagues and external consultants. Two-fifths (40.3%) of businesses with 1 to 19 employees reported they would seek advice from employees or colleagues in the business, compared with less than half of businesses with 20 to 99 employees (48.5%) and 100 or more employees (45.5%). One-fifth (20.5%) of businesses with 1 to 19 employees and over one-quarter (27.0%) of businesses with 20 to 99 employees said they would turn to external consultants for business advice, whereas over one-third (36.8%) of businesses with 100 or more employees said the same.

Data table for Chart 4
| Employment size | Friends or family | Employees or colleagues in the business | External consultants |
|---|---|---|---|
| percent | |||
| All employment sizes | 34.2 | 41.3 | 21.5 |
| 1 to 19 employees | 36.2 | 40.3 | 20.5 |
| 20 to 99 employees | 22.1 | 48.5 | 27.0 |
| 100 or more employees | 15.8 | 45.5 | 36.8 |
|
Note: Respondents were asked if the business or organization will consult any sources for advice related to opportunities or challenges over the next 12 months. Source: Canadian Survey on Business Conditions, second quarter of 2021 (Table 33-10-0349-01). |
|||
Small businesses were less likely to reach new or existing customers, clients or partners in domestic and international markets using virtual connections. Over one in ten (12.4%) businesses with 1 to 19 employees accessed new domestic markets using virtual connections and one-quarter (25.5%) accessed existing domestic markets, whereas a larger proportion of businesses with 100 or more employees accessed new (21.8%) and existing (43.7%) domestic markets respectively. Additionally, 4.7% of businesses with 1 to 19 employees accessed new international markets using virtual connections and 5.5% accessed existing international markets, while a larger proportion of businesses with 100 or more employees accessed new (8.2%) and existing (14.6%) international markets respectively.
Methodology
From April 1 to May 6, 2021, representatives from businesses across Canada were invited to take part in an online questionnaire about how COVID-19 is affecting their business and business expectations moving forward. The Canadian Survey on Business Conditions uses a stratified random sample of business establishments with employees classified by geography, industry sector, and size. An estimation of proportions is done using calibrated weights to calculate the population totals in the domains of interest. The total sample size for this iteration of the survey is 34,169 and results are based on responses from a total of 16,937 businesses.
References
Statistics Canada. (2021). Canadian Survey on Business Conditions, second quarter of 2021.
- Date modified: