
 StatCan COVID-19: Data to Insights for a Better Canada Impact of COVID-19 on businesses majority-owned by specific populations, first quarter of 2021

Archived Content
Information identified as archived is provided for reference, research or recordkeeping purposes. It is not subject to the Government of Canada Web Standards and has not been altered or updated since it was archived. Please "contact us" to request a format other than those available.
by Stephanie Tam, Shivani Sood, and Chris Johnston
Text begins
This article provides disaggregated data to better understand the impact of COVID-19 on specific groups. Visit the Gender, Diversity and Inclusion Statistics Hub for more analysis, including disaggregated data on labour, public safety, health and more.
The COVID-19 pandemic continues to impact the Canadian economy and the ability of businesses to operate. Real gross domestic product (GDP) grew 0.1% in DecemberNote , the eighth consecutive monthly increase which continued to offset the steepest drops on record in Canadian economic activity observed in March (7.5%) and April (11.6%).Note However, overall economic activity was still about 3% below February’s pre-pandemic level.Note While recent months showed an improvement in economic activity, in light of the resurgence of COVID-19 and a return to a partial shutdown this winter in several provinces, there remain challenges and uncertainty ahead for businesses.
Many communities in Canada have been impacted in various ways by the COVID-19 pandemic. In the latest Speech from the Throne, the Government of Canada recognized the challenges faced by specific populations, and identified the need to address economic inequalities for these communities. Initiatives such as the Women’s Entrepreneurship Strategy and the Black Entrepreneurship Program are designed to address these disparities.Note
This article presents results from the Canadian Survey on Business Conditions in the context of businesses majority-ownedNote by women, First Nations, Métis or Inuit persons, immigrants to Canada, and visible minorities. Differences were noted in certain areas, such as expectations in profitability and sales, changes in revenue, funding and credit, and workforce changes. This article further explores the challenges facing these businesses during these unprecedented times.
Businesses majority-owned by women face similar challenges to all private sector businesses
Businesses majority-owned by women are usually higher among businesses with fewer than 20 employees and also in service industries, such as retail trade, accommodation and food services, and tourism.Note The proportion of businesses majority-owned by women accounted for 15.6% of all small and medium enterprises (SMEs) in 2017.Note
Businesses majority-owned by women (37.7%) were more likely than all private sector businesses (31.2%) to report a drop in revenue of 30% or more in 2020 compared to 2019. Additionally, both groups had similar expectations on profitability over the next three monthsNote , as over two-fifths of both businesses majority-owned by women (41.9%) and all private sector businesses (43.0%) expected their profitability would decrease over the next three months. Businesses majority-owned by women were slightly more likely to report they were unable to take on more debt (43.6%) in comparison to all private sector businesses (39.0%).
As businesses adapted to the pandemic by moving sales online, this was more likely occur in the service industries, where the proportion of businesses owned by women is higher. Over one-quarter (26.4%) of businesses majority-owned by women reported at least some of their sales in 2020 were made online, a 6.6% increase from 2019, compared with under one-quarter (22.0%) of all private sector businesses, at a 4.6% increase from 2019.
Businesses majority-owned by women (33.3%) were as likely as all private sector businesses (31.5%) to report being able to operate for 12 months or more at their current level of revenue and expenditures before considering laying off staff. Additionally, businesses majority-owned by women (39.5%) were as likely as all private sector businesses (37.7%) to report being able to operate for 12 months or more at their current level of revenue and expenditures before considering closure or bankruptcy.
Businesses majority-owned by First Nations, Métis or Inuit persons anticipate reduced sales in the months ahead
As stated by the previous census, First Nations, Métis or Inuit persons represented 4.9% of the Canadian population.Note In 2017, 1.4% of SMEs were owned by First Nations, Métis or Inuit personsNote and often faces additional challenges to achieve business growth due to geographic remoteness and constraints on financing.
When compared with all private sector businesses, these businesses had similar expectations in a decrease in profitability, but at the same time, were less likely to expect a decrease in sales and more likely to expect an increase in employment. Under one-quarter (24.6%) of businesses majority-owned by First Nations, Métis or Inuit persons expected a decrease in sales compared with close to one-third (31.4%) of all private sector businesses. Two-fifths of businesses majority-owned by First Nations, Métis or Inuit persons (40.6%) and all private sector businesses (43.0%) expect a decrease in profitability over the next three months. Less than one-fifth (15.1%) of businesses majority-owned by First Nations, Métis or Inuit persons expected an increase in the number of employees compared with 8.4% of all private sector businesses.
Although businesses majority-owned by First Nations, Métis or Inuit persons are twice as likely to increase the number of employees in the short term, the outlook on future operations in the long term is less positive. Under one-fifth (18.2%) of businesses majority-owned by First Nations, Métis or Inuit reported they could operate for 12 months or more at their current level of revenue before considering laying off staff. In contrast, nearly one-third (31.5%) of private sector businesses reported that they would be able to operate for 12 months or more at their current level of revenue and expenditures before having to consider laying off staff.
Businesses majority-owned by First Nations, Métis or Inuit persons (41.1%) were slightly more likely than all private sector businesses (39.0%) to be unable to take on more debt. Businesses majority-owned by First Nations, Métis or Inuit persons were more likely or as likely as all private sector businesses to be approved for or receive various types of funding. Two-thirds (66.6%) of businesses majority-owned by First Nations, Métis or Inuit persons were approved for or received the Canada Emergency Business Account (CEBA)Note , whereas over half (56.9%) of all private sector businesses were approved for or received the CEBA. Businesses majority-owned by First Nations, Métis or Inuit (26.7%) were slightly more likely to be approved for the Temporary 10% Wage Subsidy for Employers (TWS)Note than all private sector businesses (20.2%). Businesses majority-owned by First Nations, Métis or Inuit (32.4%) were just as likely to be approved for the Canadian Emergency Wage Subsidy (CEWS)Note as all private sector businesses (34.5%).
Businesses majority-owned by immigrants to Canada expect difficult business conditions
According to the latest census, immigrants to Canada made up over one-fifth (21.9%) of the Canadian populationNote and run approximately 25.0% of SMEs in Canada, a proportion that has been rising over the past decade.Note Bringing newcomers to Canada remains a priority to drive economic growth and recovery in alignment with the 2021-2023 Immigration Levels Plan.Note This section refers to businesses majority-owned by immigrants, reflecting individuals who were born outside of Canada.
Businesses majority-owned by immigrants in Canada expect to face a more difficult business environment the short term compared to all private sector businesses. These businesses expect to see a drop in sales (43.3%), profitability (56.2%), and demand (37.6%), compared with all private sector businesses expecting to see a drop in sales (31.4%), profitability (43.0%), and demand (25.3%).
Businesses majority-owned by immigrants have experienced a significant loss of revenue over the course of the pandemic which impacts their ability to operate long term. Over two-fifths (43.0%) of businesses majority-owned by immigrants to Canada reported revenues were down 30% or more in 2020 compared with 2019. At the same time, under one-third (31.2%) of all private sector businesses experienced similar decreases in revenue. Nearly one-quarter (22.7%) of businesses majority-owned by immigrants to Canada reported they could operate for 12 months or more at their current level of revenue before considering laying off staff. Conversely, nearly one-third (31.5%) of private sector businesses reported that they would be able to operate for 12 months or more at their current level of revenue and expenditures before having to consider laying off staff. Businesses majority-owned by immigrants to Canada (41.8%) were as likely as all private sector businesses (39.0%) to be unable to take on more debt.
Nearly two-thirds (62.8%) of businesses majority-owned by immigrants to Canada were approved for the CEBA, while over half (56.9%) of all private sector businesses reported the same. Businesses majority-owned by immigrants to Canada (33.6%) were just as likely to be approved for the CEWS as all private sector businesses (34.5%).
Businesses majority-owned by visible minorities expect declines in sales and profitability over the next three months
According to the most recent census, visible minorities represented nearly one-quarter (22.3%) of the Canadian population.Note In 2017, 12.2% of SMEs were owned by visible minorities, a proportion that has risen slightly over the past decade. These SMEs were most often found in the retail trade, accommodation and food services, professional, scientific and technical services, and other sectors.Note For the purposes of the Canadian Survey on Business Conditions, visible minorities are defined as individuals, other than Aboriginal persons, who self-identified as non-Caucasian in race or non-white in colour, regardless of place of birth.
In the short term, businesses majority-owned by visible minorities were more likely than all private sector businesses to see a decrease in sales and profitability. Over two-fifths (43.8%) of businesses majority-owned by visible minorities expect to see a decrease in sales over the next three months. However, nearly one-third (31.4%) of all private sector businesses expect the same. Similarly, almost three-fifths (58.0%) of businesses majority-owned by visible minorities expect to see a decrease in profitability over the next three months, in contrast with over two-fifths (43.0%) of all private sector businesses.
A significant loss of revenue year-over-year was reported by businesses majority-owned by visible minorities, which limits the potential future operations of these businesses. Almost half (48.3%) of businesses majority-owned by visible minorities reported revenues were down 30% or more in 2020 compared to 2019. At the same time, under one-third (31.2%) of all private sector businesses reported seeing similar decreases in revenue. One-fifth (20.3%) of businesses majority-owned by visible minorities reported they could operate for 12 months or more at their current level of revenue and expenditures before considering laying off staff. In comparison, almost one-third (31.5%) of private sector businesses reported the same. Businesses majority-owned by visible minorities (37.1%) were nearly as likely as all private sector businesses (39.0%) to not have the ability to take on more debt.
Almost two-thirds (66.2%) of businesses majority-owned by visible minorities were approved for the CEBA, while over half (56.9%) of all private sector businesses were approved for the CEBA. Businesses majority-owned by visible minorities (33.2%) were just as likely to be approved for the CEWS as all private sector businesses (34.5%).
Appendix
| Increase |
Stay about the same |
Decrease |
Not applicable |
|
|---|---|---|---|---|
| % of businesses | ||||
| All private sector businesses | 12.3 | 43.4 | 31.4 | 12.9 |
| Businesses majority-owned by women | 12.8 | 42.5 | 28.2 | 16.4 |
| Businesses majority-owned by First Nations, Métis or Inuit persons | 10.9 | 44.1 | 24.6 | 20.5 |
| Businesses majority-owned by immigrants to Canada | 8.1 | 34.4 | 43.3 | 14.1 |
| Businesses majority-owned by visible minorities | 8.9 | 31.9 | 43.8 | 15.4 |
|
Note: Majority ownership is defined at 51% or more. Majority-ownership was reported for private sector businesses only. Respondents were asked: Over the next three months, how are each of the following expected to change for this business or organization? Source: Canadian Survey on Business Conditions, first quarter of 2021 (Table 33-10-0307-01). |
||||
| Increase | Stay about the same |
Decrease |
Not applicable |
|
|---|---|---|---|---|
| % of businesses | ||||
| All private sector businesses | 8.6 | 43.3 | 43.0 | 5.0 |
| Businesses majority-owned by women | 8.0 | 44.7 | 41.9 | 5.4 |
| Businesses majority-owned by First Nations, Métis or Inuit persons | 4.1 | 50.8 | 10.6 | 4.5 |
| Businesses majority-owned by immigrants to Canada | 7.9 | 30.6 | 56.2 | 5.3 |
| Businesses majority-owned by visible minorities | 8.4 | 28.3 | 58.0 | 5.4 |
|
Note: Majority ownership is defined at 51% or more. Majority-ownership was reported for private sector businesses only. Respondents were asked: Over the next three months, how are each of the following expected to change for this business or organization? Source: Canadian Survey on Business Conditions, first quarter of 2021 (Table 33-10-0307-01). |
||||
| Increase |
Stay about the same |
Decrease |
Not applicable |
|
|---|---|---|---|---|
| % of businesses | ||||
| All private sector businesses | 15.2 | 47.6 | 25.3 | 12.0 |
| Businesses majority-owned by women | 17.9 | 46.0 | 20.4 | 15.8 |
| Businesses majority-owned by First Nations, Métis or Inuit persons | 7.1 | 46.6 | 24.2 | 22.0 |
| Businesses majority-owned by immigrants to Canada | 14.1 | 33.8 | 37.6 | 14.5 |
| Businesses majority-owned by visible minorities | 13.6 | 32.6 | 37.4 | 16.4 |
|
Note: Majority ownership is defined at 51% or more. Majority-ownership was reported for private sector businesses only. Respondents were asked: Over the next three months, how are each of the following expected to change for this business or organization? Source: Canadian Survey on Business Conditions, first quarter of 2021 (Table 33-10-0307-01). |
||||
| Percentage of businesses that reported an increase in revenue | Percentage of businesses that reported no change in revenue | Percentage of businesses that reported a 1% to less than 30% decline in revenue | Percentage of businesses that reported a 30% or more decline in revenue | Not applicable e.g., started operating after December 31st, 2019 | |
|---|---|---|---|---|---|
| All private sector businesses | 18.0 | 20.2 | 29.7 | 31.2 | 0.8 |
| Businesses majority-owned by women | 16.7 | 19.4 | 25.2 | 37.7 | 1.0 |
| Businesses majority-owned by First Nations, Métis or Inuit persons | 14.9 | 10.5 | 42.8 | 30.5 | 1.4 |
| Businesses majority-owned by immigrants to Canada | 13.4 | 14.7 | 28.3 | 43.0 | 0.6 |
| Businesses majority-owned by visible minorities | 11.9 | 13.0 | 26.4 | 48.3 | 0.4 |
|
Note: Majority ownership is defined at 51% or more. Majority-ownership was reported for private sector businesses only.Respondents were asked: Compared to 2019, how did the revenues of this business change in 2020? Source: Canadian Survey on Business Conditions, first quarter of 2021 (Table 33-10-0317-01). |
|||||
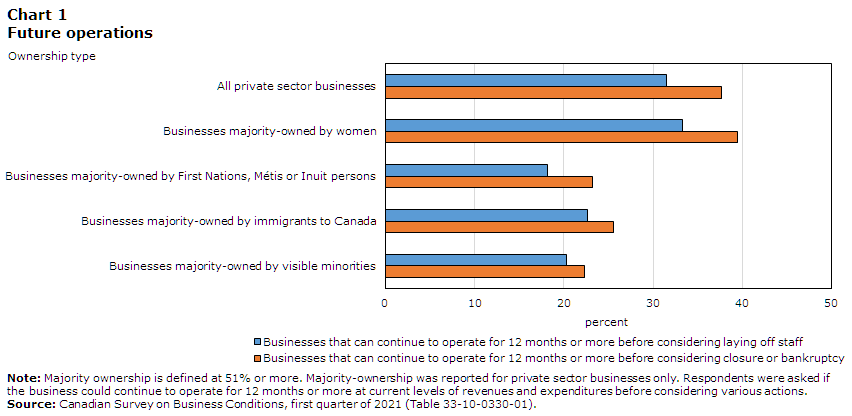
Data table for Chart 1
| Ownership type | Businesses that can continue to operate for 12 months or more before considering laying off staff | Businesses that can continue to operate for 12 months or more before considering closure or bankruptcy |
|---|---|---|
| percent | ||
| All private sector businesses | 31.5 | 37.7 |
| Businesses majority-owned by women | 33.3 | 39.5 |
| Businesses majority-owned by First Nations, Métis or Inuit persons | 18.2 | 23.2 |
| Businesses majority-owned by immigrants to Canada | 22.7 | 25.6 |
| Businesses majority-owned by visible minorities | 20.3 | 22.3 |
|
Note: Majority ownership is defined at 51% or more. Majority-ownership was reported for private sector businesses only. Respondents were asked if the business could continue to operate for 12 months or more at current levels of revenues and expenditures before considering various actions. Source: Canadian Survey on Business Conditions, first quarter of 2021 (Table 33-10-0330-01). |
||

Data table for Chart 2
| Owernship type | Percent |
|---|---|
| All private sector businesses | 39.0 |
| Businesses majority-owned by women | 43.6 |
| Businesses majority-owned by First Nations, Métis or Inuit persons | 41.1 |
| Businesses majority-owned by immigrants to Canada | 41.8 |
| Businesses majority-owned by visible minorities | 37.1 |
|
Note: Majority ownership is defined at 51% or more. Majority-ownership was reported for private sector businesses only. Respondents were asked if the business or organization had the ability to take on more debt. Source: Canadian Survey on Business Conditions (Table 33-10-0322-01). |
|
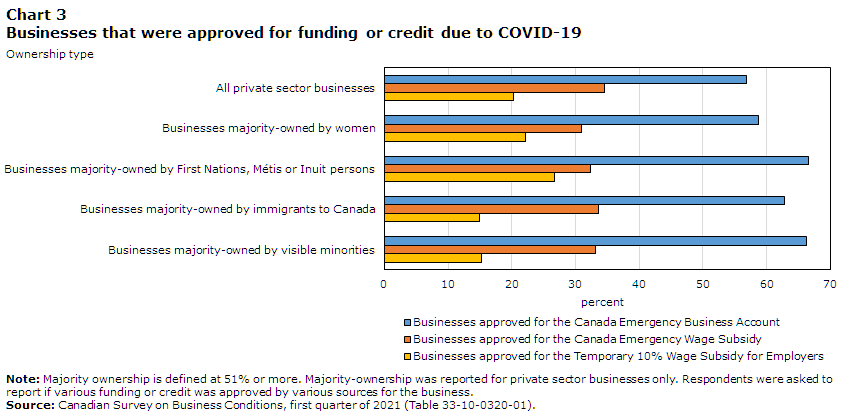
Data table for Chart 3
| Owernship type | Businesses approved for the Canada Emergency Business Account | Businesses approved for the Canada Emergency Wage Subsidy | Businesses approved for the Temporary 10% Wage Subsidy for Employers |
|---|---|---|---|
| percent | |||
| All private sector businesses | 56.9 | 34.5 | 20.2 |
| Businesses majority-owned by women | 58.7 | 30.9 | 22.2 |
| Businesses majority-owned by First Nations, Métis or Inuit persons | 66.6 | 32.4 | 26.7 |
| Businesses majority-owned by immigrants to Canada | 62.8 | 33.6 | 14.9 |
| Businesses majority-owned by visible minorities | 66.2 | 33.2 | 15.2 |
|
Note: Majority ownership is defined at 51% or more. Majority-ownership was reported for private sector businesses only. Respondents were asked to report if various funding or credit was approved by various sources for the business. Source: Canadian Survey on Business Conditions, first quarter of 2021 (Table 33-10-0320-01). |
|||
Methodology
From January 11 to February 11, representatives from businesses across Canada were invited to take part in an online questionnaire about how COVID-19 is affecting their business. This iteration of the Canadian Survey on Business Conditions used a stratified random sample of business establishments with employees classified by geography, industry sector, and size. Estimation of proportions is done using calibrated weights to calculate the population totals in the domains of interest.
References
Statistics Canada. (2021). Canadian Survey on Business Conditions, first quarter of 2021.
- Date modified: