
 StatCan COVID-19: Data to Insights for a Better Canada The changes in health and well-being of Canadians with long-term conditions or disabilities since the start of the COVID-19 pandemic

Archived Content
Information identified as archived is provided for reference, research or recordkeeping purposes. It is not subject to the Government of Canada Web Standards and has not been altered or updated since it was archived. Please "contact us" to request a format other than those available.
by Fei-Ju Yang, Kristin Dorrance and Nicole Aitken
Text begins
The COVID-19 pandemic has been a stressful time for Canadians and is associated with a decrease in people’s mental healthNote . Canadians living with long-term conditions and disabilities are also experiencing increased challenges in the context of COVID-19Note . They are reporting decreases in their health and mental health and disruptions to the health services they often need on a regular basis.
This article explores the changes in health and well-being before and during the pandemic among Canadians 15 years and older with long-term health conditions or disabilities who participated in a crowdsourcing survey. The data are from the Impacts of COVID-19 on Canadians: Data Collection SeriesNote collected from June 23 to July 6, 2020 on "Living with Long-term Conditions and Disabilities”. Participants of this crowdsource collection included individuals who reported having a long-term health condition, difficulty or self-identified as a person with a disability. Participating individuals indicated a range of different types of long-term conditions which have lasted six months or more: 21% indicated they had a sensory difficulty, 38% reported a physical difficulty, 25% indicated a cognitive difficulty, 48% reported a mental health-related difficulty and 57% indicated they had some other health problem or conditionNote . There were 54% who selected more than one difficulty type.
Readers should note that, unlike other surveys conducted by Statistics Canada, crowdsourcing data are not collected using probability-based samplingNote . They are an opportunity for participants to voice their experiences. Data presented here summarize the experiences of those people with long-term health conditions or disabilities who participated. It is their story. Caution should be exercised when interpreting the findings, and no inferences about the overall Canadian population or the population of persons with long term conditions or disabilities should be made based on these results.
Overall health: Almost half of participants with long-term conditions or disabilities reported worse overall health compared to before COVID-19
Overall health refers not only to the absence of disease or injury but also to physical, mental and social well-being. Research suggests people with long-term conditions or disabilities experience poorer levels of health than the general populationNote . According to the crowdsource data, the overall health of participants with long-term conditions or disabilities seems to have worsened under the constraints of the pandemic. Almost half (48%) of participants with long-term conditions or disabilities reported that their health was ‘much worse’ or ‘somewhat worse’ since before the pandemic (Table 1), 44% reported their health was ‘about the same’, and 8% reported their health was ‘somewhat better’ or ‘much better’. The worsening of self-rated health could be related to the unique situation occurring during the pandemic, which disrupted many services in Canada. People with long-term conditions or disabilities generally have more health-care needs than others and are therefore more likely to be impacted by low quality or inaccessible health-care servicesNote .
| Gender | Change in overall health, somewhat or much worse | Change in mental health, somewhat or much worse |
|---|---|---|
| Percent | ||
| All | 48 | 57 |
| Age 15-24 | 54 | 70 |
| Age 25-64 | 50 | 61 |
| Age 65 and older | 39 | 43 |
| Females | 50 | 59 |
| Age 15-24 | 53 | 68 |
| Age 25-64 | 53 | 62 |
| Age 65 and older | 42 | 46 |
| Males | 44 | 53 |
| Age 15-24 | 55 | 69 |
| Age 25-64 | 46 | 58 |
| Age 65 and older | 36 | 38 |
| Source: Impacts of COVID-19 on Canadians - Living with Long-term Conditions and Disabilities | ||
Changes in the overall health of participants varied depending on the type of long-term condition or disability. Almost half (48%) of participants with hearing difficulties reported their health was about the same since the start of the COVID-19 pandemic (Chart 1). However, almost two-thirds (64%) of participants with cognitive difficulties (i.e., learning, remembering, or concentrating) reported ’somewhat worse’ or ‘much worse’ health compared to before the pandemic, followed by 60% of those with mental health-related difficulties.

Data table for Chart 1
| Type of difficulty | Somewhat worse, much worse | About the same | Somewhat better, much better |
|---|---|---|---|
| percent | |||
| Seeing | 52 | 41 | 7 |
| Hearing | 45 | 48 | 7 |
| Physical | 54 | 41 | 5 |
| Cognitive | 64 | 29 | 6 |
| Mental health related | 60 | 32 | 8 |
| Other | 49 | 44 | 7 |
| Source: Impacts of COVID-19 on Canadians - Living with Long-term Conditions and Disabilities. | |||
Mental health: More than half of participants with long-term conditions or disabilities reported worse mental health compared to before COVID-19
More participants with long-term conditions or disabilities reported their self-rated mental health had worsened since the beginning of the pandemic than reported a worsening of their overall health. Over half (57%) of the participants reported experiencing ‘somewhat worse’ or ‘much worse’ mental health since the beginning of the pandemic, while 36% reported that their mental health was ‘about the same’, and 7% reported that their mental health had improved (‘somewhat better’ or ‘much better’) (Table 1). In the context of COVID-19, it is important to note that feelings of stress and anxiety can be understood as natural reactions during these uncertain times.
The general Canadian population also reported that their mental health worsened after the start of physical distancingNote . The worsening mental health of participants may be due to factors related to feelings of isolation and being separated from normal social supports as a result of public health authority recommendations around social distancing. Participants with long-term conditions or disabilities could be more impacted during the pandemic since many rely on formal and informal social supports and almost half receive help with daily activitiesNote .
The change in self-rated mental health of participants varied depending on the type of long-term condition or disability reported. Participants with hearing difficulties reported the highest proportion of consistent self-rated mental health (44%) since before the pandemic (Chart 2). Participants with mental health-related difficulties had the highest proportion (73%) of ’somewhat worse’ or ‘much worse’ mental health since before the pandemic.

Data table for Chart 2
| Type of difficulty | Somewhat worse, much worse | About the same | Somewhat better, much better |
|---|---|---|---|
| percent | |||
| Seeing | 58 | 36 | 6 |
| Hearing | 50 | 44 | 6 |
| Physical | 58 | 38 | 5 |
| Cognitive | 69 | 24 | 7 |
| Mental health related | 73 | 19 | 8 |
| Other | 56 | 39 | 6 |
| Source: Impacts of COVID-19 on Canadians - Living with Long-term Conditions and Disabilities. | |||
Among participants with long-term conditions or disabilities, a higher proportion of individuals in population groups designated as visible minorities reported worse overall health and mental health
Previous surveysNote have shown that population groups designated as visible minorities (hereafter referred to as “visible minorities”) tend to report lower overall health and mental health. These crowdsource results, however, highlight how health and well-being has worsened among these groups during the pandemic. Almost half (54%) of visible minority participants with long-term conditions or disabilities Note reported having ‘somewhat worse’ or ‘much worse’ self-rated overall health since the start of the pandemic, compared to 47% of the participants who were not a visible minority. Higher proportions were also found for changes in self-rated mental health. There were 61% of visible minority and 56% of non-visible minority participants who reported ‘somewhat worse’ or ‘much worse’ mental health since the start of the pandemic.
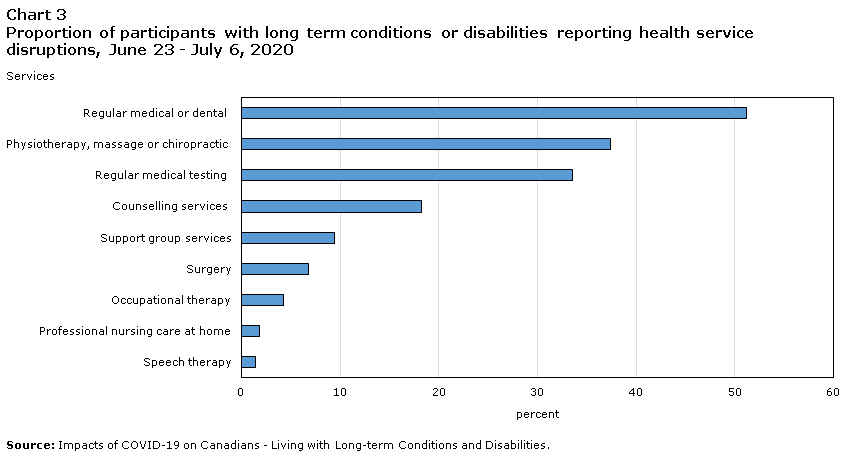
Regular medical or dental treatments, physiotherapy and medical testing unrelated to COVID-19 are the top three health services interrupted by the pandemic
Due to public health safety recommendations enacted during the pandemic, a range of health services were temporarily suspended. More than three quarters (77%) of participants with long term conditions and disabilities reported that they required a health service for their condition but were unable to receive it due to the pandemic. The most common health service disruption reported was for regular medical or dental services (51%), followed by physiotherapy, massage therapy or chiropractic treatments (37%), regular medical testing (34%), and counselling services (18%) (Chart 3).
Data table for Chart 3
| Services | Percent |
|---|---|
| Speech therapy | 1 |
| Professional nursing care at home | 2 |
| Occupational therapy | 4 |
| Surgery | 7 |
| Support group services | 9 |
| Counselling services | 18 |
| Regular medical testing | 34 |
| Physiotherapy, massage or chiropractic | 37 |
| Regular medical or dental | 51 |
| Source: Impacts of COVID-19 on Canadians - Living with Long-term Conditions and Disabilities. | |
The highest proportion of participants reporting a service disruption was found in Newfoundland and Labrador (87%) followed by the Territories (82%). Participants in Quebec (71%) and Prince Edward Island (73%) had the lowest proportions reporting service disruptions (Table 2).
| Region of participant | Service disruption (%) |
|---|---|
| Canada | 77 |
| Newfoundland and Labrador | 87 |
| Prince Edward Island | 73 |
| Nova Scotia | 81 |
| New Brunswick | 79 |
| Quebec | 71 |
| Ontario | 78 |
| Manitoba | 74 |
| Saskatchewan | 74 |
| Alberta | 78 |
| British Columbia | 79 |
| Territories | 82 |
| Source: Impacts of COVID-19 on Canadians - Living with Long-term Conditions and Disabilities | |
Additionally, people with long-term conditions and disabilities often face environmental challenges which could prevent them from being able to access specific COVID-19 related help during the pandemic (e.g., accessibility issue in COVID-19 testing centres, health information unavailable in accessible formats). Almost one in ten participants (8%) reported that they were unable to get COVID-19 related testing or medical attention due to their long-term condition or disability.
Statistics Canada will continue to provide timely information on a regular basis as information becomes available throughout the pandemic to track the impacts of COVID-19 on Canadians and our society.
Data Source
The article uses data from the Impacts of COVID-19 on Canadians: Data Collection Series collected from June 23 to July 6, 2020 on "Living with Long-term Conditions and Disabilities”. It is important to note that statistical inferences about the Canadian population cannot be made from participants in crowdsource questionnaires, as the respondents are self-selected. Respondents to traditional sample-based surveys, on the other hand, are probabilistically selected from the target population. Further caution should be used when interpreting the results because of the collection mode and the population of interest. The survey was only available as an electronic questionnaire. The overall accessibility of the survey was reduced since it was not available in other formats—such as ASL or LSQ, Braille or audio versions—and it was not available to those without access to a computer or Internet. Proxy interviews were encouraged, to allow family members or caregivers to respond on behalf of a person with a long-term condition or disability. Nevertheless, crowdsourcing is a cost-effective and timely way to collect granular data on a particular topic. In this article, methodological benchmark adjustments were made to account for age, sex, and provincial differences.
To identify those with a long-term condition or disability, participants in this crowdsource were asked if they had difficulties from a list of six different areas and then if they identified as a person with a disability. Included in this analysis were respondents that reported a difficulty and self-identified as a person with a disability, those who reported no specific difficulty but identified as a person with a disability and those who reported a difficulty but did not identify as a person with a disability. This differs from the method used by Statistics Canada on the Canadian Survey on Disability, which administers the Disability Screening Questionnaire to identify persons with a disability and calculate the official rates of disability across Canada.
References
Findlay, Leanne, and Arim, Rubab. 2020. Canadians report lower self-perceived mental health during the COVID-19 pandemic. StatCan COVID-19: Data to insights for a better Canada, catalogue no. 45-28-0001. Ottawa: Statistics Canada. Available at https://www150.statcan.gc.ca/n1/pub/45-28-0001/2020001/article/00003-eng.htm
Moyser, Melissa. 2020 “Gender differences in the mental health during the COVID-19 pandemic.” Statcan COVID-19: Data to insights for a better Canada, catalogue no. 45-28-0001. Ottawa: Statistics Canada. Available at https://www150.statcan.gc.ca/n1/pub/45-28-0001/2020001/article/00047-eng.htm
Ofner, Marianna, Marina Salvadori, Aidan Pucchio, Yung-En Chung, Althea House and the PHAC COVID-19 Clinical Issues Task Group. 2020. “COVID-19 and people with disabilities in Canada”. Available at https://www.canada.ca/en/public-health/services/diseases/2019-novel-coronavirus-infection/guidance-documents/people-with-disabilities.html
Public Health Agency of Canada. 2020. “Vulnerable populations and COVID-19.” https://www.canada.ca/en/public-health/services/publications/diseases-conditions/vulnerable-populations-covid-19.html
Statistics Canada. Canadian Survey on Disability (2017) https://www23.statcan.gc.ca/imdb/p2SV.pl?Function=getSurvey&SDDS=3251
Statistics Canada. 2020a. Impacts of COVID-19 on Canadians: Data Collection Series.
Statistics Canada. 2020b. “The vulnerability of Canadians with disabilities during the COVID-19 pandemic”. The Daily. July 6. https://www150.statcan.gc.ca/n1/daily-quotidien/200706/dq200706a-eng.htm
Statistics Canada. 2020c. “Canadians' mental health during the COVID-19 pandemic.” The Daily. May 27. https://www150.statcan.gc.ca/n1/daily-quotidien/200527/dq200527b-eng.htm
Statistics Canada. 2020d. “Canadian Community Health Survey, 2019”. The Daily. August 6. https://www150.statcan.gc.ca/n1/daily-quotidien/200806/dq200806a-eng.htm
United Nations. 2020. “COVID-19 Outbreak and Persons with Disabilities”. Available at https://www.un.org/development/desa/disabilities/covid-19.html
World Health Organization. 2011. “World report on disability”. Available at https://apps.who.int/iris/bitstream/handle/10665/70670/WHO_NMH_VIP_11.01_eng.pdf;jsessionid=49D4A12032A1B75B6FE204581BB45847?sequence=1;
- Date modified: