
 StatCan COVID-19: Data to Insights for a Better CanadaExcess mortality in Canada during the COVID-19 pandemic

Archived Content
Information identified as archived is provided for reference, research or recordkeeping purposes. It is not subject to the Government of Canada Web Standards and has not been altered or updated since it was archived. Please "contact us" to request a format other than those available.
COVID-19 has had and continues to have a clear impact on communities and families across the country. Many have lost family members and friends to the pandemic.
In order to better understand the impacts of the pandemic on Canadian families and communities, Statistics Canada has adopted, and continues to adopt, new ways of working to provide Canadians with the data and insights they need to respond to COVID-19. To continue to meet the need for more timely information, provisional data on deaths in Canada and excess mortality have been released on a monthly basis for reporting provinces and territories. Statistics Canada's capacity to provide useful information depends, however, on its ability to receive data from the provinces and territories. The data used in this article are provisional, as some deaths which occurred during the reference period have not yet been reported. To address this issue, Statistics Canada has produced provisional death estimates which have been adjusted to account for the incomplete nature of the counts.
What is the true toll of lives lost due to the pandemic in Canada?
Since the start of the COVID-19 pandemic, health authorities in Canada have been reporting on the number of deaths due to COVID-19. However, the true toll of a pandemic can be different from these reported figures for a number of reasons. For example, there could be underreporting of deaths from the virus, especially at the start of the pandemic where some individuals may have died prior to getting tested. Additionally, there can be indirect consequences related to measures put in place to address the pandemic that could cause increases or decreases in mortality, such as missed or delayed medical interventions, fewer traffic-related incidents and other possible changes in behaviour such as increased substance use.
In terms of lives lost, the toll of the pandemic should account for both the direct and indirect effects of the virus. Excess mortality, which occurs when there are more deaths during a period of time than what would be typical for that period Note is one key measure that accounts for these effects. Other measures looking at the effects on life expectancy and the number of years of life lost would also assess the impact of the pandemic on mortality.
How is excess mortality measured?
As noted above, the number of excess deaths is measured as the difference between the number of observed deaths and the number of expected deaths over a certain period of time (e.g., a week or a month).
To precisely measure excess mortality, it is important that the observed number of deaths is accurate. In Canada, death data are collected by the provincial and territorial vital statistical offices and their capacity to provide these data to Statistics Canada in a timely manner varies greatly. More importantly, their capacity may have also changed as a result of the pandemic itself (i.e., Vital Statistics Offices could have been closed). The incomplete nature of the reported counts makes it difficult to draw any conclusions on the extent of excess deaths in Canada that could be caused by the COVID-19 pandemic. To address these limitations, Statistics Canada has derived provisional death estimates which are adjusted for reporting delays, where possible. These adjustments add to the counts to incorporate deaths not yet reported to Statistics Canada, based on past provincial and territorial reporting patterns. For more information on the estimation process and on the Canadian Vital Statistics Death Database, please consult the Definitions, data sources and methods for Survey 3233— Vital Statistics - Death Database.
Measuring excess mortality also requires some way to determine the number of deaths that would be expected to be observed were there no pandemic. There are a number of ways to assess (or estimate) expected deaths, including comparing to previous yearly counts or using historical averages (e.g., over the previous 5-years). In the Canadian context, with an aging and growing population, the number of deaths has been steadily increasing over recent years and so a higher number of deaths in 2020 would be expected regardless of COVID-19. In addition, even without a crisis, there is always some variation in the number of people who die in a given week from year to year. This means that what might be expected should fall within a certain range of values as opposed to a precise number. For these reasons, Statistics Canada is using an approach that has also been adopted for other countries to estimate expected deaths, taking recent trends into account Note .
For excess mortality, it’s also important to consider the time period covered. While there could be excess mortality for certain weeks, this may not translate into excess mortality over the course of an entire year.
What have we learned so far about excess mortality during the pandemic?
Across the world, the COVID-19 pandemic has led to excess mortality and Canada is no exception. The number of deaths in Canada was higher than expected starting in March and returned to normal levels in June. The largest provinces of Quebec, Ontario, and British Columbia all experienced varying levels of excess mortality over this period Note . Excess mortality has been similar for both sexes and has disproportionately affected those over the age of 85 Note .
At the start of June, the number of deaths across Canada had returned to normal levels. However, it is possible that this will change as the pandemic persists. Direct consequences of any rise in COVID-19 deaths may again lead to an increase. On the other hand, the number of deaths could continue to decline. The first wave of the virus disproportionally affected vulnerable populations, some of whom were likely at a high risk of dying in the subsequent months regardless of a pandemic. Furthermore, the indirect consequences of the pandemic may still have an impact in the months and years ahead. For example, it will be difficult to determine the extent to which future mortality could be affected by the impacts of the pandemic on mental health.
Patterns in mortality will continue to evolve over the course of the pandemic.
Can the number of excess deaths be different than the number of deaths attributed to COVID-19?
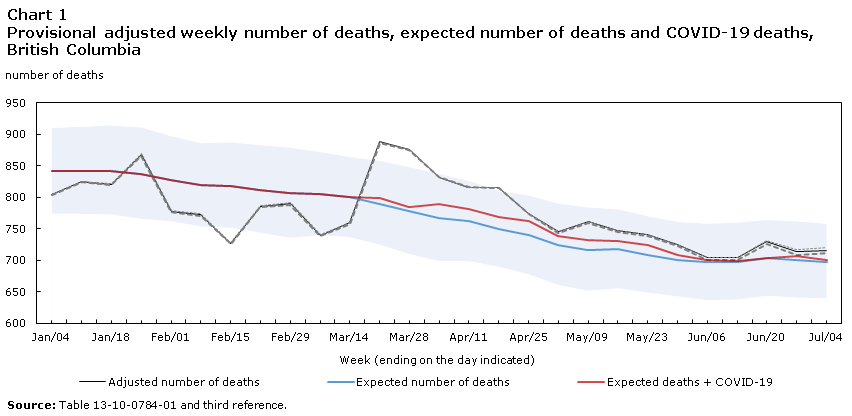
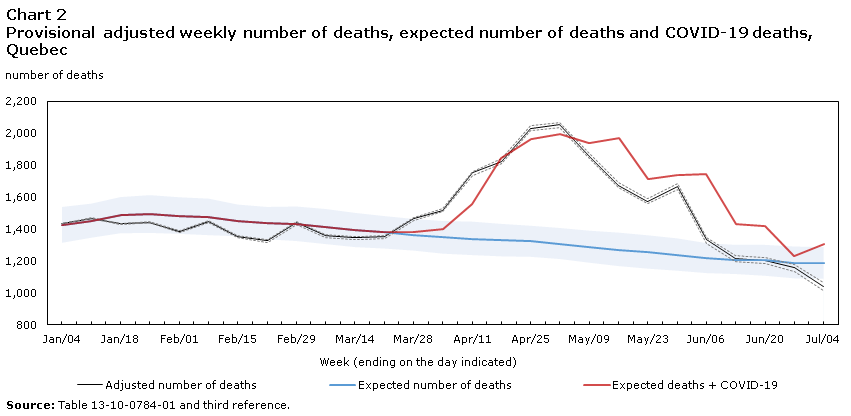
For some periods, it is possible for there to be more excess deaths than deaths reportedly due to the virus itself. For example, in British Columbia, there were 336 more deaths than expected from the middle of March to the end of April. This is 232 more than the 104 deaths reportedly attributed to COVID-19 over the same period. These additional excess deaths, not directly attributed to COVID-19, may be due to underreporting in the early phases of the pandemic or to indirect consequences such as missed or delayed medical interventions. Of particular consideration would be cases, especially early in the pandemic, where individuals may have died of COVID-19 prior to getting tested or treated. This pattern is similar for other countries such as in the United States and is also apparent for other provinces. For instance, in Quebec, health authorities reported 2,132 deaths due to COVID-19 from March through April compared with 2,636 excess deaths. This suggests that about 504 more deaths may have been caused directly or indirectly by the virus than what was reported.
Data table for Chart 1
| Week (ending on the day indicated) |
Adjusted number of deaths | Adjusted number of deaths, upper bound | Adjusted number of deaths, lower bound | Expected number of deaths | Expected number of deaths, upper bound | Expected number of deaths, lower bound | Expected deaths + COVID-19 |
|---|---|---|---|---|---|---|---|
| number of deaths |
|||||||
| 1/4/2020 | 804 | 804 | 804 | 841 | 910 | 774 | 841 |
| 1/11/2020 | 825 | 825 | 825 | 842 | 912 | 774 | 842 |
| 1/18/2020 | 821 | 822 | 819 | 842 | 914 | 773 | 842 |
| 1/25/2020 | 868 | 869 | 866 | 837 | 911 | 766 | 837 |
| 2/1/2020 | 778 | 779 | 776 | 828 | 897 | 762 | 828 |
| 2/8/2020 | 773 | 774 | 771 | 820 | 886 | 754 | 820 |
| 2/15/2020 | 727 | 728 | 726 | 818 | 887 | 752 | 818 |
| 2/22/2020 | 786 | 787 | 784 | 812 | 883 | 744 | 812 |
| 2/29/2020 | 790 | 791 | 788 | 806 | 879 | 736 | 806 |
| 3/7/2020 | 740 | 741 | 738 | 805 | 872 | 740 | 805 |
| 3/14/2020 | 760 | 760 | 757 | 800 | 864 | 737 | 801 |
| 3/21/2020 | 889 | 889 | 886 | 790 | 858 | 725 | 799 |
| 3/28/2020 | 875 | 875 | 875 | 778 | 848 | 710 | 784 |
| 4/4/2020 | 832 | 832 | 832 | 767 | 837 | 699 | 789 |
| 4/11/2020 | 816 | 816 | 816 | 762 | 826 | 699 | 782 |
| 4/18/2020 | 815 | 815 | 815 | 749 | 810 | 690 | 769 |
| 4/25/2020 | 774 | 774 | 774 | 740 | 803 | 678 | 762 |
| 5/2/2020 | 745 | 745 | 744 | 725 | 790 | 661 | 739 |
| 5/9/2020 | 761 | 761 | 759 | 717 | 784 | 652 | 732 |
| 5/16/2020 | 747 | 747 | 745 | 718 | 781 | 656 | 730 |
| 5/23/2020 | 741 | 741 | 739 | 708 | 770 | 649 | 724 |
| 5/30/2020 | 725 | 725 | 723 | 701 | 761 | 643 | 708 |
| 6/6/2020 | 704 | 705 | 701 | 697 | 758 | 637 | 700 |
| 6/13/2020 | 704 | 705 | 701 | 698 | 760 | 638 | 699 |
| 6/20/2020 | 730 | 732 | 726 | 703 | 764 | 644 | 703 |
| 6/27/2020 | 714 | 717 | 709 | 700 | 762 | 641 | 706 |
| 7/4/2020 | 716 | 720 | 711 | 698 | 758 | 640 | 701 |
|
Source: Table 13-10-0784-01 and third reference. |
|||||||
Data table for Chart 2
| Week (ending on the day indicated) |
Adjusted number of deaths | Adjusted number of deaths, upper bound | Adjusted number of deaths, lower bound | Expected number of deaths | Expected number of deaths, upper bound | Expected number of deaths, lower bound | Expected deaths + COVID-19 |
|---|---|---|---|---|---|---|---|
| number of deaths |
|||||||
| 1/4/2020 | 1436 | 1436 | 1436 | 1425 | 1539 | 1314 | 1425 |
| 1/11/2020 | 1468 | 1469 | 1465 | 1452 | 1560 | 1346 | 1452 |
| 1/18/2020 | 1433 | 1435 | 1429 | 1485 | 1601 | 1374 | 1485 |
| 1/25/2020 | 1442 | 1446 | 1438 | 1493 | 1613 | 1376 | 1493 |
| 2/1/2020 | 1385 | 1389 | 1379 | 1483 | 1600 | 1370 | 1483 |
| 2/8/2020 | 1449 | 1455 | 1442 | 1475 | 1591 | 1362 | 1475 |
| 2/15/2020 | 1352 | 1359 | 1345 | 1453 | 1554 | 1355 | 1453 |
| 2/22/2020 | 1326 | 1332 | 1317 | 1437 | 1539 | 1336 | 1437 |
| 2/29/2020 | 1439 | 1446 | 1429 | 1432 | 1542 | 1325 | 1432 |
| 3/7/2020 | 1357 | 1365 | 1348 | 1415 | 1526 | 1306 | 1415 |
| 3/14/2020 | 1344 | 1352 | 1333 | 1393 | 1502 | 1287 | 1393 |
| 3/21/2020 | 1350 | 1361 | 1339 | 1378 | 1482 | 1278 | 1382 |
| 3/28/2020 | 1466 | 1474 | 1456 | 1363 | 1464 | 1265 | 1381 |
| 4/4/2020 | 1518 | 1529 | 1508 | 1347 | 1451 | 1246 | 1400 |
| 4/11/2020 | 1751 | 1762 | 1738 | 1340 | 1447 | 1237 | 1554 |
| 4/18/2020 | 1826 | 1839 | 1812 | 1329 | 1433 | 1229 | 1845 |
| 4/25/2020 | 2032 | 2047 | 2016 | 1322 | 1421 | 1226 | 1963 |
| 5/2/2020 | 2052 | 2069 | 2036 | 1308 | 1407 | 1212 | 1998 |
| 5/9/2020 | 1857 | 1874 | 1840 | 1288 | 1390 | 1189 | 1938 |
| 5/16/2020 | 1674 | 1689 | 1658 | 1271 | 1378 | 1168 | 1968 |
| 5/23/2020 | 1575 | 1591 | 1558 | 1255 | 1361 | 1152 | 1712 |
| 5/30/2020 | 1669 | 1686 | 1650 | 1239 | 1342 | 1139 | 1738 |
| 6/6/2020 | 1331 | 1347 | 1311 | 1216 | 1312 | 1124 | 1747 |
| 6/13/2020 | 1217 | 1234 | 1199 | 1208 | 1301 | 1118 | 1433 |
| 6/20/2020 | 1202 | 1223 | 1183 | 1203 | 1301 | 1107 | 1416 |
| 6/27/2020 | 1156 | 1178 | 1133 | 1189 | 1291 | 1091 | 1229 |
| 7/4/2020 | 1039 | 1064 | 1014 | 1186 | 1287 | 1088 | 1304 |
|
Source: Table 13-10-0784-01 and third reference. |
|||||||
It is also important to note that excess mortality can be due to other causes not directly linked to the pandemic. For example, in Nova Scotia, the week ending April 25th saw 37 excess deaths above and beyond the expected range. However, while this may have been driven in part by the 15 deaths reportedly due to the virus that week, it would also have been affected by the lives lost due to the mass shooting which took place on April 18th and 19th.
At the same time, it is also possible for the number of reported deaths due to the virus to surpass the number of excess deaths. For example, in Quebec, from the start of May to the first week of June, there were 1,837 excess deaths compared with 2,834 deaths officially due to the virus. This deficit between excess deaths and deaths reportedly due to COVID-19 is in line with patterns from other countries. As previously indicated, this could be the result of the first wave of the virus disproportionally affecting vulnerable populations, some of whom may have been at high risk of dying in the subsequent months regardless of COVID-19.
There are other reasons why the number of excess deaths could be lower than the reported deaths due to the virus. These could include, for example, deaths wrongly attributed to COVID-19. Not all deaths are necessarily linked to a test result and someone could theoretically die of other causes even if they tested positive. Finally, due to their provisional nature, the estimates of excess deaths may evolve as provincial reporting improves.
Looking ahead…
Today August 28, Statistics Canada released provisional death counts and estimates for the first 27 weeks of 2020. In addition, cause of death information for the first six months of 2020 was released for all provinces and territories, except Yukon. Provisional death information, including updated provisional death estimates, will be released on a monthly basis. The provisional death counts and estimates will be revised and improved in future releases as provincial reporting increases.
Statistics Canada will continue to provide timely information on a regular basis on excess deaths as information becomes available throughout the pandemic.
Data sources and methodology
These observations are based on an updated provisional dataset from the Canadian Vital Statistics Death Database released August 28th, 2020, which includes data for the first 27 weeks of 2020 (ending July 4), based on information received from all provinces and territories except Yukon.
References to the period from March to June refer to the period from the week ending March 28th to the week ending June 6th. References to the period from March to the end of April refer to the period from the week ending March 28th to the week ending May 2nd. References to the period from May to the start of June refer to the period from the week ending May 9th to the week ending June 6th.
For this analysis, weekly excess mortality is defined as the difference between the weekly adjusted counts and expected mortality were there no pandemic. Only in those weeks where the lower bound on the adjusted count is greater than the upper bound on the expected deaths are the differences considered and discussed as excesses here.
The model used to estimate the expected number of deaths is adapted from an infectious disease detection algorithm developed by Farrington et al., Note and modified by Noufaily et al. Note and Salmon et al. Note . Adjusted counts are obtained using an approach described by Brookmeyer and DamianoNote . For more information on these models and on the Canadian Vital Statistics Death Database, please consult the Definitions, data sources and methods for Survey 3233— Vital Statistics - Death Database.
References
Centers for Disease Control and Prevention. (2020, June 1st). Excess Deaths Associated with COVID-19.
EuroMOMO. (2020, July 1st). European mortality monitoring.
The number of deaths in Canada related to COVID-19 as of July 4 comes from the Public Health Agency of Canada's COVID-19 Outbreak Update (consulted August 17). For the most recent information, please refer to the Public Health Agency of Canada website.
COVID-19 death information reported by PHAC is based on data submitted by provincial and territorial authorities. There may be some differences in regards to how provinces and territories report the date of death. This date may refer to the actual date of death or the date when the death was recorded by the jurisdiction. The authoritative source for causes of death will be the Canadian Vital Statistics Database as the data becomes available.
- Date modified: