
 StatCan COVID-19: Data to Insights for a Better Canada Commuting to work during COVID-19

Archived Content
Information identified as archived is provided for reference, research or recordkeeping purposes. It is not subject to the Government of Canada Web Standards and has not been altered or updated since it was archived. Please "contact us" to request a format other than those available.
by Katherine Savage and Martin Turcotte
Text begins
As a result of restrictions introduced to slow the spread of COVID-19, the number of commuters has significantly decreased over the last months. Although these changes could be temporary, a decrease in peak commuter numbers and traffic congestion has been felt in almost every metropolis in the world, including major Canadian cities (Clarke 2020).
The abrupt halt in ridership on Canada’s buses, trains and subways, which began in mid-March as part of an effort to prevent the spread of COVID-19, resulted in a historic year-over-year passenger decrease in April 2020. Following a 42% decline in March, the number of passenger trips fell 85% in April (Statistics Canada 2020).
As the economy reopens, the number of workers having to commute will likely increase. However, the modes of transportation used by Canadian workers while the virus is still circulating may differ from those they used before the pandemic. Many may be reluctant to use public transit, and some will likely continue to work from home for several weeks or months to come.
From June 15 to 21, 2020, Statistics Canada conducted the third wave of the Canadian Perspectives Survey Series (CPSS). This statistically representative survey examined Canadians’ reactions to the pandemic, with a focus on how they perceived the reopening of the economy and the loosening of restrictions.
Using data from the CPSS, this article examines changes in the mode of transportation of workers over the course of the pandemic and the characteristics of those who switched to telework. The article also provides new insights on the concerns expressed by those who were using public transit before the pandemic and were not yet back in their regular place of work in June.
This analysis is based on Canadians who had a job prior to the pandemic and who were still working during the survey reference week (whether they worked from home or commuted). It should be noted that results from this study do not necessarily reflect how commuting patterns and the modes of transportation used to get to work will evolve in the post-pandemic period. While some of these changes may be permanent, others are likely temporary.
The increase in teleworking means less workers are using private vehicles and public transit
Prior to the pandemic, personal motor vehicles (75%) were the most common mode of transportation to work, followed by public transit (13%) and active transportation (walking or cycling) (7%) (Chart 1).Note Fewer than 1 in 20 workers teleworked (4%).
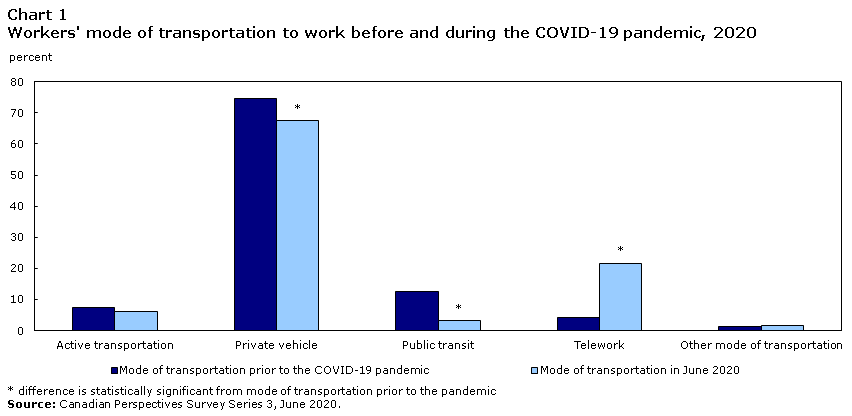
Data table for Chart 1
| Mode of transportation prior to the COVID-19 pandemic | Mode of transportation in June 2020 | |
|---|---|---|
| percent | ||
| Active transportation | 7.4 | 6.2 |
| Private vehicle | 74.5 | 67.5Note * |
| Public transit | 12.7 | 3.1Note * |
| Telework | 4.1 | 21.6Note * |
| Other mode of transportation | 1.3 | 1.6 |
|
||
A large number of Canadians were still working from home in June, and this mostly explains why a smaller proportion of workers were using public transit or personal motor vehicles. In June, 22% of Canadians worked from home, a proportion that was more than five times higher than it was prior to the pandemic (4%).Note
In June, personal motor vehicles remained the predominant mode of transportation used by Canadian workers (67%). The decline in the proportion of workers using public transit was more pronounced. While 13% of workers used public transit prior to the pandemic, 3% of them did so in June. The proportion of workers using an active mode of transportation (i.e., walking or cycling) did not change significantly over the period.
Previous public transit users most likely to have switched to telework
The vast majority (84%) of commuters who used personal motor vehicles before the pandemic were still using that mode of transportation to go to work in June. Among those who were no longer using a personal motor vehicle, most had switched to telework, suggesting that the pandemic did not bring transformative changes in the commuting habits of these commuters which is not surprising given the circumstances.
Similarly, over two-thirds (67%) of people who walked or cycled to work before the pandemic kept the same mode of transportation in June, while 17% switched to teleworking.
By contrast, the pandemic brought major changes in the commuting habits of public transit users. Slightly less than one-quarter (24%) of those who were using public transit before the pandemic were still using public transit in June to go to work. About one-third of public transit users switched to another mode of transportation (34%) and more than 4 in 10 public transit users (42%) switched to telework. Of the public transit users who changed modes, nearly three-quarters switched to personal motor vehicles and slightly more than one-fifth switched to active transportation.
The larger proportion of public transit users switching to telework can be explained, at least in part, by their location and the nature of their jobs. Public transit users are more likely to live in larger census metropolitan areas (CMAs), such as Toronto and Montréal, and to work in offices located in the city cores, where the type of work they do often allows for telework (Statistics Canada 2017a, 2017b; Savage 2019).
Results by size of a worker’s community support this observation. Workers in CMAs with a population of at least 500,000, where public transit use is significantly higher,Note were the most likely to have switched to telework (Table 1). In contrast, workers who lived in smaller communities (i.e., with a population of less than 500,000) were less likely to have switched to telework.
Public transit users in large CMAs often commute to jobs in the city core in high-paid service industries,Note and many of these workers have the option to telework especially during the pandemic. Other factors associated with telework are also important to consider and are discussed in the next section.
Workers with higher levels of education were more likely to switch to telework
A previous study released in this series highlighted other factors that may be associated with switching to telework (Deng et al. 2020). That study found that roughly 4 in 10 Canadian workers had jobs that could be carried out from home, with substantial variation across industries and provinces. The study also found that financially vulnerable workers, such as younger workers or those with lower levels of education, were less likely to have jobs for which telework was an option.
Results from the CPSS support these findings, given that workers with higher levels of education are more likely to be in jobs amenable to telework. Among workers who did not telework before the COVID-19 pandemic, nearly one in three (33%) of those with a bachelor’s degree teleworked in June. The proportion was even higher for those whose highest level of education was above the bachelor level (38%). In contrast, pre-pandemic commuters whose highest level of education was below the bachelor level were less likely to have switched to teleworking, at 11% (Table 1). These results also contribute to explaining the relationship between CMA size and telework, as workers in larger CMAs are also more likely to have a higher level of education.Note
| Commuters who switched to teleworking | |
|---|---|
| percent | |
| Sex | |
| Men (ref.) | 17.5 |
| Women | 20.0 |
| Age | |
| 15 to 34 years (ref.) | 17.0 |
| 35 to 44 years | 20.5 |
| 45 to 54 years | 20.7 |
| 55 years and over | 17.2 |
| Level of educationTable 1 Note 1 | |
| Below a bachelor’s degree (ref.) | 11.4 |
| Bachelor’s degree | 32.8Note * |
| Above bachelor’s degree | 38.3Note * |
| Census metropolitan area (CMA) and census agglomeration (CA) population size | |
| 1,500,000 and over | 26.9Note * |
| 500,000 to 1,499,999 | 28.3Note * |
| 100,000 to 499,999 | 13.4Note * |
| Any CMA/CA less than 100,000 | 8.8Note * |
| Non CMA/CA (ref.) | 4.6 |
| Immigration status | |
| Born in Canada (ref.) | 16.7 |
| Landed immigrant | 27.0Note * |
Source: Canadian Perspectives Survey Series 3, June 2020. |
|
Lastly, immigrants workers, who are more likely than workers born in Canada to live in larger CMAsNote and who are more likely to have a university degree, were also more likely to have switched from commuting before the pandemic to telework by mid-June (27%, compared with 17% for Canadian-born workers).
The majority of public transit users before the pandemic were concerned about using public transit again
Telework may not be a permanent option for all previous commuters, and many workers will likely need to decide what mode of transportation they will use when they are able to return to the workplace. This may particularly affect previous public transit users, whose usual mode of transportation is associated with higher risks of exposure to COVID-19. The CPSS asked survey respondents who were not back in their regular place of work about whether they felt safe returning to work, and about the concerns they may have. One of the concerns examined was fear of using public transit.
Among those who used public transit before the pandemic and who said they were not comfortable going back to their usual place of work, almost all (94%) reported that the fear of using public transit was one of their concerns about returning to their physical workplace. However, even among those who said they felt safe returning to their physical workplace, the majority said they were very or extremely concerned about using public transit (74%).
Statistics Canada will continue to monitor the impacts of COVID-19 to see the extent to which these changes are temporary or permanent. The 2021 Census, which will include several questions on commuting, will be an important source of information to evaluate how commuting patterns in Canada may be affected in the longer term.
Methodology
Data in this release are from Statistics Canada’s new Canadian Perspectives Survey Series (CPSS), which represents a panel of Canadians who have agreed to complete a number of short online surveys. The CPSS is a probabilistic panel based on the Labour Force Survey and is therefore representative of the general population. The CPSS enables Statistics Canada to collect important information from Canadians more efficiently, more rapidly and at a lower cost, compared with traditional survey methods. The first iteration of the CPSS took place from March 29 to April 3 and collected information from 4,600 respondents. The second iteration was conducted from May 4 to 10, with most of the same respondents. The third iteration, used in this article, took place from June 15 to 21. Statistics Canada would like to thank the Canadians who took the time to answer the questions in this survey during this time of crisis.
References
Clarke, S. 2020. “The traffic data that shows the road into - and out of - Covid-19 lockdown.” The Guardian. April 27. https://cutaactu.ca/en/news-media/latest-news/transit-ridership-systems-face-closure.
Deng, Z., D. Messacar and R. Morissette. 2020. “Running the economy remotely: Potential for working from home during and after COVID-19.” STATCAN COVID-19: Data to Insights for a Better Canada, no. 26. Statistics Canada Catalogue no. 45280001. Ottawa: Statistics Canada.
Heisz, A., and S. LaRochelle-Côté. 2005. “Work and commuting in census metropolitan areas, 1996-2001.” Trends and Conditions in Census Metropolitan Areas, no. 7. Statistics Canada Catalogue no. 89-613-M.
Savage, K. 2019. “Results from the 2016 Census: Commuting within Canada’s largest cities.” Insights on Canadian Society. May. Statistics Canada Catalogue no. 75-006-X.
Statistics Canada. 2017a. “Journey to work: Key results from the 2016 Census.” The Daily. November 29.
Statistics Canada. 2017b. “Commuters using sustainable transportation in census metropolitan areas.” Census in Brief. November 29.
Statistics Canada. 2020. “Urban public transit, April 2020.” The Daily. June 30.
- Date modified: