
 StatCan COVID-19: Data to Insights for a Better CanadaCOVID-19 Impact Analysis and 2020 Outlook: For-hire Motor Carrier Freight Services Price Index

Archived Content
Information identified as archived is provided for reference, research or recordkeeping purposes. It is not subject to the Government of Canada Web Standards and has not been altered or updated since it was archived. Please "contact us" to request a format other than those available.
Start of text box
Highlights
- For-hire Motor Carrier Freight Services Price Index (FHMCFSPI) movements are cyclical and significantly impacted by diesel prices.
- During the COVID-19 pandemic, there has been a significant drop in demand for freight trucking services, as manufacturers and retailers reduced activity.
- The 2020 Outlook for the FHMCFSPI is a decline in price, given the prediction from the International Monetary Fund of the largest economic contraction since 1921.
End of text box
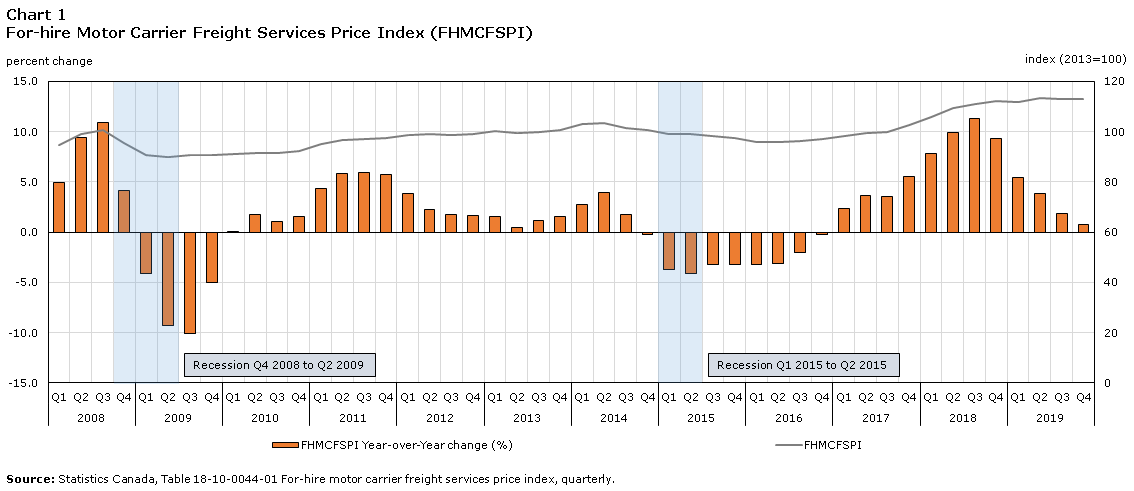
For-hire Motor Carrier Freight Services Price Index (FHMCFSPI) measures the price movements of services provided by the truck transportation industry. This includes establishments that are primarily engaged in the truck transportation of goods and excludes a large portion of truck activity classified to other industries which include but are not limited to retail, freight forwarders, couriers and wholesalers.
Historically, the FHMCFSPI has shown clear cyclical movements, responding to economic downturns, but typically taking longer to recover to pre-recession levels when compared to the truck transportation gross domestic product (GDP). As fuel expenses contribute the most to truck transportation costs, the trend of the FHMCFSPI is highly correlated with the diesel price movement.
Data table for Chart 1
| FHMCFSPI | FHMCFSPI Year-over-Year change | |
|---|---|---|
| index (2013=100) |
percent change | |
| 2008 | ||
| Quarter 1 | 94.8 | 5.0 |
| Quarter 2 | 99.0 | 9.4 |
| Quarter 3 | 100.8 | 10.9 |
| Quarter 4Data table Note 1 | 95.7 | 4.1 |
| 2009 | ||
| Quarter 1Data table Note 1 | 90.9 | -4.1 |
| Quarter 2Data table Note 1 | 89.8 | -9.3 |
| Quarter 3 | 90.6 | -10.1 |
| Quarter 4 | 90.9 | -5.0 |
| 2010 | ||
| Quarter 1 | 91.0 | 0.1 |
| Quarter 2 | 91.4 | 1.8 |
| Quarter 3 | 91.6 | 1.1 |
| Quarter 4 | 92.3 | 1.5 |
| 2011 | ||
| Quarter 1 | 95.0 | 4.4 |
| Quarter 2 | 96.7 | 5.8 |
| Quarter 3 | 97.0 | 5.9 |
| Quarter 4 | 97.6 | 5.7 |
| 2012 | ||
| Quarter 1 | 98.7 | 3.9 |
| Quarter 2 | 98.9 | 2.3 |
| Quarter 3 | 98.7 | 1.8 |
| Quarter 4 | 99.2 | 1.6 |
| 2013 | ||
| Quarter 1 | 100.2 | 1.5 |
| Quarter 2 | 99.4 | 0.5 |
| Quarter 3 | 99.8 | 1.1 |
| Quarter 4 | 100.7 | 1.5 |
| 2014 | ||
| Quarter 1 | 103.0 | 2.8 |
| Quarter 2 | 103.3 | 3.9 |
| Quarter 3 | 101.6 | 1.8 |
| Quarter 4 | 100.5 | -0.2 |
| 2015 | ||
| Quarter 1Data table Note 2 | 99.2 | -3.7 |
| Quarter 2Data table Note 2 | 99.0 | -4.2 |
| Quarter 3 | 98.3 | -3.2 |
| Quarter 4 | 97.3 | -3.2 |
| 2016 | ||
| Quarter 1 | 96.0 | -3.2 |
| Quarter 2 | 95.9 | -3.1 |
| Quarter 3 | 96.3 | -2.0 |
| Quarter 4 | 97.1 | -0.2 |
| 2017 | ||
| Quarter 1 | 98.3 | 2.4 |
| Quarter 2 | 99.4 | 3.6 |
| Quarter 3 | 99.7 | 3.5 |
| Quarter 4 | 102.5 | 5.6 |
| 2018 | ||
| Quarter 1 | 106.0 | 7.8 |
| Quarter 2 | 109.3 | 10.0 |
| Quarter 3 | 111.0 | 11.3 |
| Quarter 4 | 112.1 | 9.4 |
| 2019 | ||
| Quarter 1 | 111.8 | 5.5 |
| Quarter 2 | 113.5 | 3.8 |
| Quarter 3 | 113.1 | 1.9 |
| Quarter 4 | 113.0 | 0.8 |
|
||
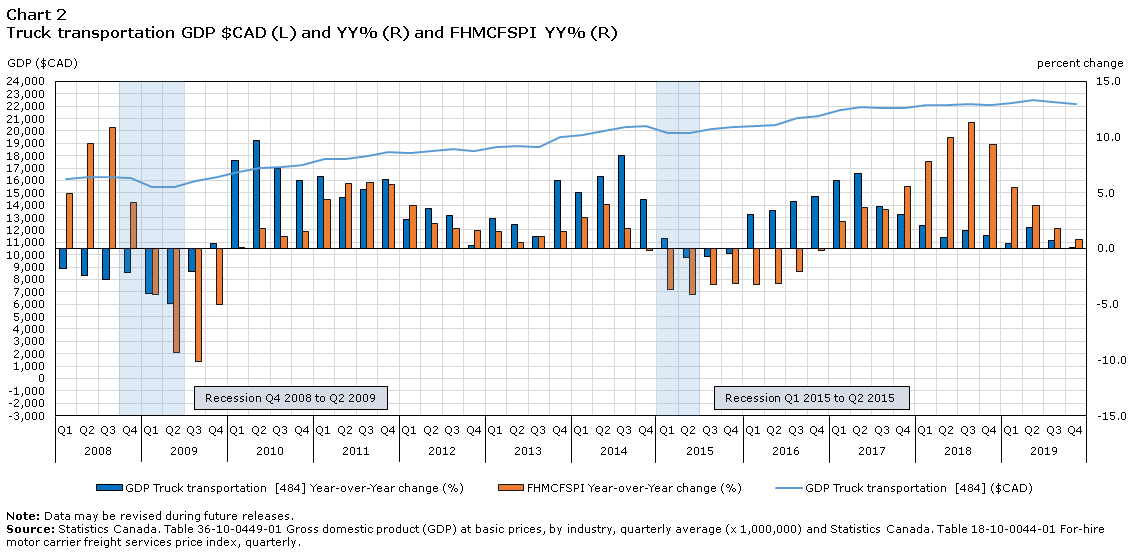
Almost 24% fewer truck drivers entered Canada from the US during the week of March 23rd to 29th, 2020 compared to the previous year, according to a spokesperson from the Canada Border Service Agency. Unlike many Canadian businesses, truck transportation has been deemed an essential service during the COVID-19 crises, and continued to operate.
Data table for Chart 2
| GDP Truck transportation [484] | GDP Truck transportation [484] Year-over-Year change | FHMCFSPI Year-over-Year change | |
|---|---|---|---|
| Canadian dollars | percent change | ||
| 2008 | |||
| Quarter 1 | 16,105 | -1.8 | 5.0 |
| Quarter 2 | 16,282 | -2.4 | 9.4 |
| Quarter 3 | 16,282 | -2.8 | 10.9 |
| Quarter 4Data table Note 1 | 16,199 | -2.2 | 4.1 |
| 2009 | |||
| Quarter 1Data table Note 1 | 15,457 | -4.0 | -4.1 |
| Quarter 2Data table Note 1 | 15,471 | -5.0 | -9.3 |
| Quarter 3 | 15,949 | -2.0 | -10.1 |
| Quarter 4 | 16,275 | 0.5 | -5.0 |
| 2010 | |||
| Quarter 1 | 16,685 | 7.9 | 0.1 |
| Quarter 2 | 16,967 | 9.7 | 1.8 |
| Quarter 3 | 17,098 | 7.2 | 1.1 |
| Quarter 4 | 17,265 | 6.1 | 1.5 |
| 2011 | |||
| Quarter 1 | 17,769 | 6.5 | 4.4 |
| Quarter 2 | 17,741 | 4.6 | 5.8 |
| Quarter 3 | 18,002 | 5.3 | 5.9 |
| Quarter 4 | 18,333 | 6.2 | 5.7 |
| 2012 | |||
| Quarter 1 | 18,225 | 2.6 | 3.9 |
| Quarter 2 | 18,385 | 3.6 | 2.3 |
| Quarter 3 | 18,537 | 3.0 | 1.8 |
| Quarter 4 | 18,384 | 0.3 | 1.6 |
| 2013 | |||
| Quarter 1 | 18,713 | 2.7 | 1.5 |
| Quarter 2 | 18,781 | 2.2 | 0.5 |
| Quarter 3 | 18,738 | 1.1 | 1.1 |
| Quarter 4 | 19,509 | 6.1 | 1.5 |
| 2014 | |||
| Quarter 1 | 19,654 | 5.0 | 2.8 |
| Quarter 2 | 19,999 | 6.5 | 3.9 |
| Quarter 3 | 20,310 | 8.4 | 1.8 |
| Quarter 4 | 20,373 | 4.4 | -0.2 |
| 2015 | |||
| Quarter 1Data table Note 2 | 19,822 | 0.9 | -3.7 |
| Quarter 2Data table Note 2 | 19,829 | -0.9 | -4.2 |
| Quarter 3 | 20,168 | -0.7 | -3.2 |
| Quarter 4 | 20,285 | -0.4 | -3.2 |
| 2016 | |||
| Quarter 1 | 20,434 | 3.1 | -3.2 |
| Quarter 2 | 20,508 | 3.4 | -3.1 |
| Quarter 3 | 21,025 | 4.2 | -2.0 |
| Quarter 4 | 21,237 | 4.7 | -0.2 |
| 2017 | |||
| Quarter 1 | 21,684 | 6.1 | 2.4 |
| Quarter 2 | 21,898 | 6.8 | 3.6 |
| Quarter 3 | 21,824 | 3.8 | 3.5 |
| Quarter 4 | 21,878 | 3.0 | 5.6 |
| 2018 | |||
| Quarter 1 | 22,123 | 2.0 | 7.8 |
| Quarter 2 | 22,109 | 1.0 | 10.0 |
| Quarter 3 | 22,168 | 1.6 | 11.3 |
| Quarter 4 | 22,124 | 1.1 | 9.4 |
| 2019 | |||
| Quarter 1 | 22,227 | 0.5 | 5.5 |
| Quarter 2 | 22,525 | 1.9 | 3.8 |
| Quarter 3 | 22,325 | 0.7 | 1.8 |
| Quarter 4 | 22,145 | 0.1 | 0.8 |
Source: Statistics Canada. Table 36-10-0449-01 Gross domestic product (GDP) at basic prices, by industry, quarterly average (x 1,000,000) and Statistics Canada. Table 18-10-0044-01 For-hire motor carrier freight services price index, quarterly. |
|||
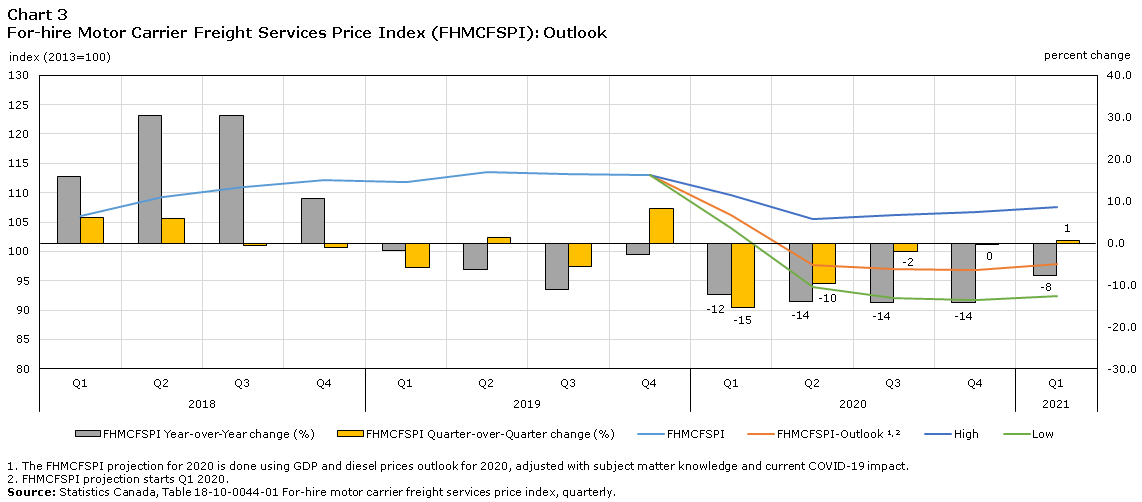
Forecasts on the severity of the effects of COVID-19 vary in terms of length and magnitude of the GDP decline. The projection for the FHMCFSPI for 2020 is based on its movements during the 2009 recession combined with industry knowledge and the current COVID-19 impacts on the industry. With the significant decrease in demand for Truck Transportation and the fluctuations in oil prices, the FHMCFSPI’s decline in 2020 could range from -5% to -20%, amid the prediction from the International Monetary Fund for the largest economic contraction in Canada since 1921.
Data table for Chart 3
| FHMCFSPI | High | Low | FHMCFSPI-OutlookData table Note 1 Data table Note 2 | FHMCFSPI Year-over-Year change | FHMCFSPI Quarter-over-Quarter change | |
|---|---|---|---|---|---|---|
| index (2013=100) |
percent change | |||||
| 2018 | ||||||
| Quarter 1 | 106.0 | Note ..: not available for a specific reference period | Note ..: not available for a specific reference period | Note ..: not available for a specific reference period | 15.9 | 6.2 |
| Quarter 2 | 109.3 | Note ..: not available for a specific reference period | Note ..: not available for a specific reference period | Note ..: not available for a specific reference period | 30.3 | 5.9 |
| Quarter 3 | 111.0 | Note ..: not available for a specific reference period | Note ..: not available for a specific reference period | Note ..: not available for a specific reference period | 30.4 | -0.5 |
| Quarter 4 | 112.1 | Note ..: not available for a specific reference period | Note ..: not available for a specific reference period | Note ..: not available for a specific reference period | 10.7 | -1.1 |
| 2019 | ||||||
| Quarter 1 | 111.8 | Note ..: not available for a specific reference period | Note ..: not available for a specific reference period | Note ..: not available for a specific reference period | -1.9 | -5.9 |
| Quarter 2 | 113.5 | Note ..: not available for a specific reference period | Note ..: not available for a specific reference period | Note ..: not available for a specific reference period | -6.3 | 1.2 |
| Quarter 3 | 113.1 | Note ..: not available for a specific reference period | Note ..: not available for a specific reference period | Note ..: not available for a specific reference period | -11.1 | -5.6 |
| Quarter 4 | 113.0 | 113.0 | 113.0 | 113.0 | -2.7 | 8.3 |
| 2020 | ||||||
| Quarter 1 | Note ..: not available for a specific reference period | 109.6 | 104.0 | 106.2 | -12.4 | -15.3 |
| Quarter 2 | Note ..: not available for a specific reference period | 105.6 | 94.0 | 97.6 | -14.0 | -9.6 |
| Quarter 3 | Note ..: not available for a specific reference period | 106.2 | 92.1 | 97.0 | -14.3 | -2.0 |
| Quarter 4 | Note ..: not available for a specific reference period | 106.8 | 91.8 | 96.8 | -14.3 | -0.4 |
| 2021 | ||||||
| Quarter 1 | Note ..: not available for a specific reference period | 107.6 | 92.3 | 97.9 | -7.8 | 0.6 |
|
.. not available for a specific reference period
|
||||||
To obtain the FHMCFSPI index projections for 2020, an initial comparison was conducted from the year-over-year percentage change of both FHMCFSPI and truck transportation GDP from previous downturns. Using this comparison as a benchmark, FHMCFSPI 2020 year-over-year percentage change was estimated using multiple 2020 GDP year-over-year percentage change forecasts. Based on the FHMCFSPI 2020 year-over-year percent change the index value was calculated with 3 scenarios relating to the different degrees of magnitude of GDP forecasted change.
- Date modified: