
 StatCan COVID-19: Data to Insights for a Better Canada Trade in medical and protective goods, June 2020

Archived Content
Information identified as archived is provided for reference, research or recordkeeping purposes. It is not subject to the Government of Canada Web Standards and has not been altered or updated since it was archived. Please "contact us" to request a format other than those available.
Text begins
Statistics Canada continues to monitor the impact of the COVID-19 pandemic on Canada’s international merchandise trade statistics. The current article describes trade in personal protective equipment with a particular focus on monthly variations in imports and exports in June 2020.
Imports of personal protective equipment increase for a fourth consecutive month
Imports of personal protective equipment rose 9.5% to reach $938 million in June, a fourth consecutive monthly increase. The value of imports in June 2020 was almost three times the value imported in June 2019. For the year to date, growth in imports of personal protective equipment was concentrated in the second quarter of 2020, with significant increases seen in all three sub-groups, each of which showed notable year-over-year growth in the past three months.
In June, the increase in imports of personal protective equipment was led by face and eye protection. Following a 77.1% surge in May, imports of face and eye protection continued to increase in June, rising 12.3% to $400 million, 13 times the import value in the same month last year. Imports of face masks of textile materials rose 11.7%, mainly from Vietnam, China and South Korea. The unit value of face masks of textile materials in June was 19.7% lower than the year-to-date average monthly unit value in 2020, likely the result of increased high value bulk shipments as well as a shift in the source countries. In 2019, 53.0% of Canada’s imports of face masks of textile materials originated in the United States, with another 26.4% from China. This shifted in 2020 with 90.7% originating in China, and 3.3% from the United States.
Imports of other protective equipment were up 5.8% to $466 million in June. There were higher imports of plastic apparel and clothing, including protective suits and their accessories (+87.6%), protective suits of felts and nonwovens textiles to be employed in a noxious atmosphere (+69.0%), and other articles of plastics and of other materials (+14.6%), mostly from China and the United States. These increases were partially offset by a decline in imports from a category including a variety of miscellaneous articles, such as respirators to be employed in a noxious atmosphere (-31.0%).
In June, imports of gloves rose 20.5% to $73 million, almost double the import value in June 2019. Higher imports of protective rubber gloves for use with protective suits to be employed in a noxious atmosphere from China and Malaysia were the main contributor to both the monthly and year-over-year increases. While imports have increased recently, the countries of origin of these gloves remained consistent historically, mainly Malaysia, China and Thailand.
| Monthly value (millions of dollars) | % change | ||||||
|---|---|---|---|---|---|---|---|
| June 2019 | April 2020 | May 2020 | June 2020 | May 2020 over April 2020 | June 2020 over May 2020 | June 2020 over June 2019 | |
| Total of all products | 1,980.2 | 2,655.7 | 2,888.6 | 3,140.9 | 8.8 | 8.7 | 58.6 |
| Disinfectant and sterilization products | 179.6 | 192.7 | 222.4 | 297.2 | 15.4 | 33.6 | 65.5 |
| Disinfectants and sterilizers | 126.0 | 136.8 | 166.8 | 238.1 | 22.0 | 42.7 | 89.0 |
| Wipes | 53.6 | 55.9 | 55.6 | 59.1 | -0.5 | 6.3 | 10.3 |
| Personal protective equipment | 322.0 | 511.0 | 856.7 | 938.4 | 67.7 | 9.5 | 191.4 |
| Face and eye protection | 31.9 | 201.2 | 356.3 | 400.0 | 77.1 | 12.3 | 1,155.1 |
| Gloves | 39.2 | 43.9 | 60.3 | 72.7 | 37.3 | 20.5 | 85.4 |
| Other protective equipment | 250.9 | 265.9 | 440.1 | 465.7 | 65.5 | 5.8 | 85.6 |
| Medical equipment and products | 1,100.8 | 1,456.3 | 1,257.7 | 1,504.2 | -13.6 | 19.6 | 36.6 |
| Medical consumables | 146.4 | 129.2 | 157.8 | 181.4 | 22.2 | 14.9 | 23.9 |
| Medical devices | 240.4 | 229.1 | 202.2 | 255.3 | -11.7 | 26.3 | 6.2 |
| Medicaments | 683.4 | 1,070.6 | 868.8 | 1,034.2 | -18.9 | 19.0 | 51.3 |
| Oxygen therapy | 30.6 | 27.5 | 28.9 | 33.3 | 5.0 | 15.4 | 8.7 |
| Diagnostic products | 377.8 | 495.9 | 551.8 | 401.1 | 11.3 | -27.3 | 6.2 |
| Test kits and diagnostic instruments | 366.8 | 482.0 | 528.0 | 380.7 | 9.6 | -27.9 | 3.8 |
| Thermometers | 11.0 | 13.9 | 23.8 | 20.5 | 71.5 | -14.1 | 86.5 |
| Source: Canadian International Merchandise Trade Program | |||||||
Increased imports were also evident in the other categories. Imports of disinfectants and sterilization products rose 33.6% to $297 million in June, the highest value in the past three years. Year-over-year (+89.0%) imports were up sharply. In particular, imports of disinfectants in packages less than or equal to 1.36 kilograms from China increased in June.
In June, imports of medical equipment and products were up 19.6% to $1.5 billion. Imports in this category tend to fluctuate greatly from month to month, often the result of large shipments of medicaments.
Partially offsetting these increases, imports of diagnostic products declined 27.3% to $401 million in June, the lowest value since September 2019.

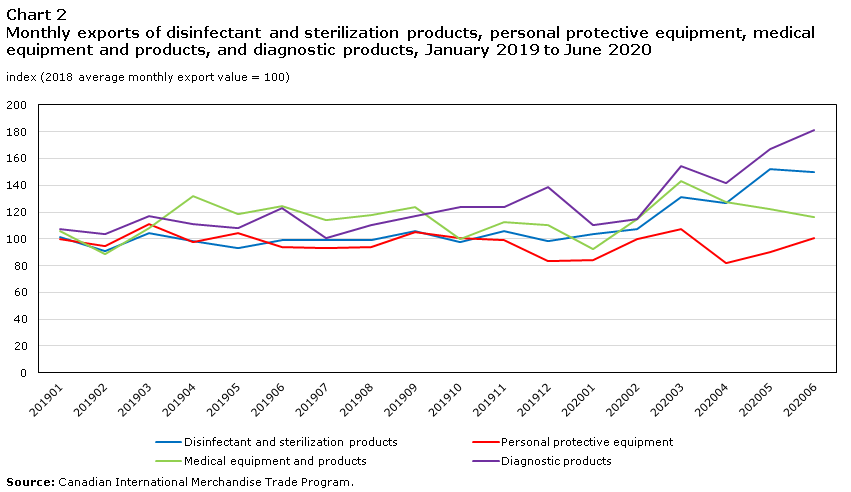
Data table for Chart 1
| Month | Disinfectant and sterilization products | Personal protective equipment | Medical equipment and products | Diagnostic products |
|---|---|---|---|---|
| index (2018 average monthly import value = 100) | ||||
| 201901 | 104 | 105 | 103 | 115 |
| 201902 | 98 | 94 | 104 | 119 |
| 201903 | 109 | 99 | 128 | 114 |
| 201904 | 105 | 104 | 114 | 123 |
| 201905 | 106 | 110 | 116 | 125 |
| 201906 | 115 | 111 | 91 | 120 |
| 201907 | 104 | 128 | 121 | 157 |
| 201908 | 112 | 119 | 106 | 148 |
| 201909 | 99 | 108 | 105 | 120 |
| 201910 | 110 | 110 | 112 | 149 |
| 201911 | 97 | 90 | 109 | 155 |
| 201912 | 85 | 94 | 106 | 137 |
| 202001 | 96 | 99 | 98 | 152 |
| 202002 | 98 | 95 | 102 | 151 |
| 202003 | 115 | 102 | 124 | 169 |
| 202004 | 123 | 176 | 120 | 157 |
| 202005 | 142 | 296 | 104 | 175 |
| 202006 | 190 | 324 | 124 | 127 |
| Source: Canadian International Merchandise Trade Program. | ||||
Exports of personal protective equipment rise in June
Exports of personal protective equipment rose 12.0% to $186 million in June. Exports in this category tend to vary notably from month to month.
The main contributor to the increase in personal protective equipment was higher exports of other protective equipment, which rose 18.7% to $137 million in June. Despite this monthly increase, exports were lower year-over-year.
Partially offsetting the increase in other protective equipment, exports of face and eye protection (-3.3%) and gloves (-4.5%) decreased in June. Exports in both these sub-groups, however, were up on a year-over-year basis. For face and eye protection, and particularly from a category including a variety of miscellaneous articles, exports remained largely destined for the United States throughout this period. From April through June 2020, the proportion of exports comprised of re-exports rose to greater than 50%, on higher re-exports of Chinese-origin goods to the United States.
| Monthly value (millions of dollars) | % change | ||||||
|---|---|---|---|---|---|---|---|
| June 2019 | April 2020 | May 2020 | June 2020 | May 2020 over April 2020 | June 2020 over May 2020 | June 2020 over June 2019 | |
| Total of all products | 1,486.9 | 1,534.6 | 1,540.8 | 1,517.6 | 0.4 | -1.5 | 2.1 |
| Disinfectant and sterilization products | 85.0 | 108.9 | 130.4 | 128.3 | 19.8 | -1.6 | 50.9 |
| Disinfectants and sterilizers | 69.7 | 93.5 | 109.4 | 106.7 | 17.0 | -2.5 | 53.1 |
| Wipes | 15.3 | 15.4 | 21.0 | 21.6 | 36.4 | 2.9 | 41.2 |
| Personal protective equipment | 172.4 | 151.4 | 166.1 | 186.0 | 9.7 | 12.0 | 7.9 |
| Face and eye protection | 26.3 | 36.5 | 44.7 | 43.3 | 22.7 | -3.3 | 64.6 |
| Gloves | 4.6 | 6.9 | 5.6 | 5.3 | -18.6 | -4.5 | 16.9 |
| Other protective equipment | 141.6 | 108.1 | 115.8 | 137.4 | 7.1 | 18.7 | -3.0 |
| Medical equipment and products | 1,122.4 | 1,150.7 | 1,098.7 | 1,045.6 | -4.5 | -4.8 | -6.8 |
| Medical consumables | 67.1 | 29.5 | 34.1 | 31.5 | 15.7 | -7.7 | -53.1 |
| Medical devices | 126.6 | 132.6 | 116.4 | 126.6 | -12.2 | 8.8 | 0.1 |
| Medicaments | 917.2 | 971.3 | 927.1 | 861.5 | -4.6 | -7.1 | -6.1 |
| Oxygen therapy | 11.5 | 17.3 | 21.1 | 26.0 | 22.3 | 23.0 | 125.1 |
| Diagnostic products | 107.1 | 123.6 | 145.6 | 157.8 | 17.8 | 8.4 | 47.3 |
| Test kits and diagnostic instruments | 101.2 | 116.8 | 141.0 | 153.5 | 20.6 | 8.9 | 51.6 |
| Thermometers | 5.8 | 6.8 | 4.6 | 4.3 | -31.8 | -7.9 | -26.8 |
| Source: Canadian International Merchandise Trade Program | |||||||
Exports in the diagnostic products category increased in June, rising 8.4% to $158 million, the highest value of the past three years. The main contributors to the increase in June were higher exports of composite diagnostic or laboratory reagents to the United States and instruments and apparatus for physical or chemical analysis to China and the United States.
Offsetting these increases, exports of medical equipment and products fell 4.8% to $1.0 billion. There were lower exports of medicaments in June. Meanwhile, exports of oxygen therapy increased for a fourth consecutive month to their highest value in the past three years, mainly to the United Kingdom, the United States and the Netherlands.
In June, exports of disinfectant and sterilization products declined 1.6% to $128 million. Year-over-year exports increased notably in each of the past five months, on higher exports of disinfectants in packages for retail sale and chemical products and preparations of the chemical or allied industries to the United States.
Data table for Chart 2
| Month | Disinfectant and sterilization products | Personal protective equipment | Medical equipment and products | Diagnostic products |
|---|---|---|---|---|
| index (2018 average monthly export value = 100) | ||||
| 201901 | 101 | 100 | 106 | 107 |
| 201902 | 91 | 94 | 89 | 104 |
| 201903 | 104 | 111 | 108 | 117 |
| 201904 | 98 | 98 | 132 | 111 |
| 201905 | 93 | 104 | 119 | 108 |
| 201906 | 99 | 94 | 125 | 123 |
| 201907 | 99 | 93 | 114 | 101 |
| 201908 | 99 | 94 | 117 | 111 |
| 201909 | 106 | 105 | 124 | 117 |
| 201910 | 97 | 100 | 100 | 123 |
| 201911 | 106 | 99 | 113 | 124 |
| 201912 | 99 | 83 | 110 | 139 |
| 202001 | 104 | 84 | 92 | 110 |
| 202002 | 107 | 99 | 115 | 115 |
| 202003 | 131 | 108 | 143 | 154 |
| 202004 | 127 | 82 | 128 | 142 |
| 202005 | 152 | 90 | 122 | 167 |
| 202006 | 150 | 101 | 116 | 181 |
| Source: Canadian International Merchandise Trade Program. | ||||
Methodology
The data in the analysis are on a customs basis and are not seasonally adjusted.
Unit values are calculated by dividing the value by the quantity of Harmonized System (HS) codes that require units of measure in the Customs Tariff and the Canadian Export Classification. They provide some insight into the price charged or paid per item. They reflect the mix of items that happen to be traded under an HS code within that particular month. The mix of goods traded under an HS code can change from month to month, which will impact the unit value. For example, an HS code for masks could reflect trade in high quality medical masks in one month, then in the following month reflect a shift towards trade in less expensive paper masks. In this case, the unit price will go down from one month to the next as a result of a change in the product mix as opposed to change in the price paid for the goods.
Additionally, while quantity data undergo quality assurance processing and review, it is possible that aggregate quantities may include inaccurately reported data and therefore some caution needs to be used in interpreting average unit prices. It is also possible that the import price does not reflect the price paid by government authorities or hospitals, as the import may have been arranged by a wholesaler or an intermediary.
In general, the value for duty of imported goods must be equivalent to the transaction value or the price actually paid. The transaction value of imported goods includes all transportation and associated costs incurred up to the point of direct shipment to Canada. Therefore, Canada's imports are valued Free on Board (FOB), place of direct shipment to Canada. It excludes freight and insurance costs in bringing the goods to Canada from the point of direct shipment.
Canada's exports are valued at FOB place of exit, including domestic freight charges to that point but net of discounts and allowances.
The categorization of goods used in this article was developed by Statistics Canada for the purpose of analysis. It was developed based on the Harmonized System (HS) classification guidelines produced by the World Customs Organization and the World Health Organization. The Canadian Border Services Agency’s Customs Notice 20-12, outlining applicable HS codes that can be used for the importation of such goods into Canada, was also considered in the development of these categories.
Note that many of the HS codes are broadly defined and therefore may include goods unrelated to the category into which they are placed. Additionally, data for trade under these categories may include goods that were not relevant to trade in response to the COVID-19 pandemic.
Notes
The source of these data is the Canadian International Merchandise Trade Program. Customs basis, not seasonally adjusted data by HS classification at the 6-digit level and country are available in the Canadian International Merchandise Trade database (table 65F0013X). Data at the 8-digit level for exports and 10-digit level for imports are available upon request.
- Date modified: