
 StatCan COVID-19: Data to Insights for a Better CanadaCOVID-19 Impact Analysis and 2020 Outlook: Commercial and Industrial Machinery and Equipment Rental and Leasing Services Price Index

Archived Content
Information identified as archived is provided for reference, research or recordkeeping purposes. It is not subject to the Government of Canada Web Standards and has not been altered or updated since it was archived. Please "contact us" to request a format other than those available.
Start of text box
Highlights
- CIMERLSPI’s movements are cyclical and significantly impacted by crude oil prices and show longer recovery times after economic impacts are observed.
- CIMERLSPI is estimated to show an overall decrease in 2020 and with a long term recovery beyond 2020.
End of text box
CIMERLSPI measures the change in price of the commercial and industrial machinery and equipment rental and leasing services for the construction, transportation, mining and forestry (NAICS 53241), office (NAICS 53242), and other commercial and industrial machinery and equipment (NAICS 53249) industries.
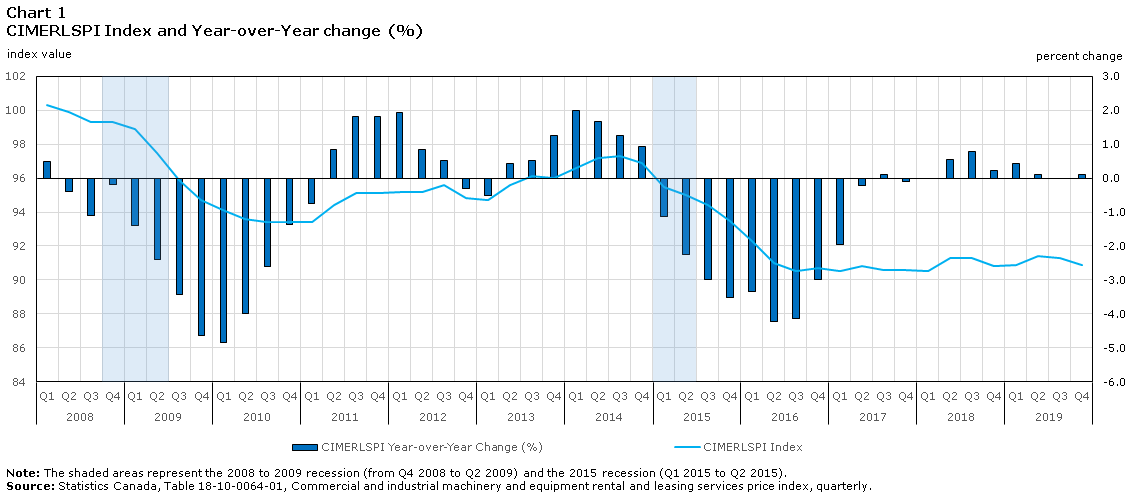
Data table for Chart 1
| CIMERLSPI Index | CIMERLSPI Year-over-Year Change | |
|---|---|---|
| index value | percent change | |
| 2008 | ||
| Quarter 1 | 100.3 | 0.5 |
| Quarter 2 | 99.9 | -0.4 |
| Quarter 3 | 99.3 | -1.1 |
| Quarter 4Data table Note 1 | 99.3 | -0.2 |
| 2009 | ||
| Quarter 1Data table Note 1 | 98.9 | -1.4 |
| Quarter 2Data table Note 1 | 97.5 | -2.4 |
| Quarter 3 | 95.9 | -3.4 |
| Quarter 4 | 94.7 | -4.6 |
| 2010 | ||
| Quarter 1 | 94.1 | -4.9 |
| Quarter 2 | 93.6 | -4.0 |
| Quarter 3 | 93.4 | -2.6 |
| Quarter 4 | 93.4 | -1.4 |
| 2011 | ||
| Quarter 1 | 93.4 | -0.7 |
| Quarter 2 | 94.4 | 0.9 |
| Quarter 3 | 95.1 | 1.8 |
| Quarter 4 | 95.1 | 1.8 |
| 2012 | ||
| Quarter 1 | 95.2 | 1.9 |
| Quarter 2 | 95.2 | 0.8 |
| Quarter 3 | 95.6 | 0.5 |
| Quarter 4 | 94.8 | -0.3 |
| 2013 | ||
| Quarter 1 | 94.7 | -0.5 |
| Quarter 2 | 95.6 | 0.4 |
| Quarter 3 | 96.1 | 0.5 |
| Quarter 4 | 96.0 | 1.3 |
| 2014 | ||
| Quarter 1 | 96.6 | 2.0 |
| Quarter 2 | 97.2 | 1.7 |
| Quarter 3 | 97.3 | 1.2 |
| Quarter 4 | 96.9 | 0.9 |
| 2015 | ||
| Quarter 1Data table Note 2 | 95.5 | -1.1 |
| Quarter 2Data table Note 2 | 95.0 | -2.3 |
| Quarter 3 | 94.4 | -3.0 |
| Quarter 4 | 93.5 | -3.5 |
| 2016 | ||
| Quarter 1 | 92.3 | -3.4 |
| Quarter 2 | 91.0 | -4.2 |
| Quarter 3 | 90.5 | -4.1 |
| Quarter 4 | 90.7 | -3.0 |
| 2017 | ||
| Quarter 1 | 90.5 | -2.0 |
| Quarter 2 | 90.8 | -0.2 |
| Quarter 3 | 90.6 | 0.1 |
| Quarter 4 | 90.6 | -0.1 |
| 2018 | ||
| Quarter 1 | 90.5 | 0.0 |
| Quarter 2 | 91.3 | 0.6 |
| Quarter 3 | 91.3 | 0.8 |
| Quarter 4 | 90.8 | 0.2 |
| 2019 | ||
| Quarter 1 | 90.9 | 0.4 |
| Quarter 2 | 91.4 | 0.1 |
| Quarter 3 | 91.3 | 0.0 |
| Quarter 4 | 90.9 | 0.1 |
|
||
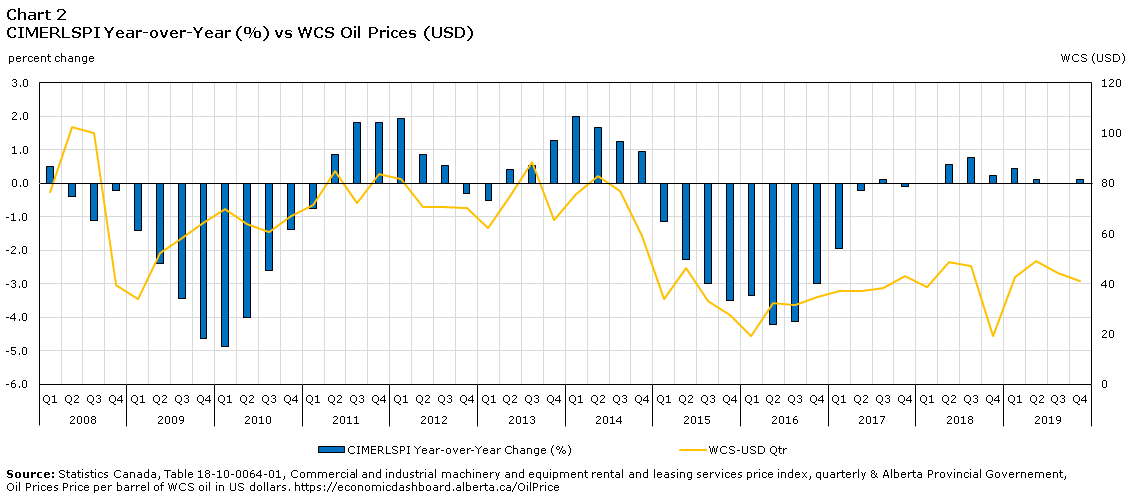
CIMERLSPI movements are cyclical and show response to economic events, however the index takes several quarters to recover after downturns. Prices for crude oil, natural gas, mining products and other natural resources impact demand for equipment, therefore the commodity price influences the equipment requirements and thus rental pricing. Given the relative importance of the construction and heavy equipment rental industry (NAICS 53241) within the index, commodity prices, such as crude oil prices, can be used to help estimate CIMERLSPI trends.
As observed during declining crude oil and other commodity prices during the 2009 and 2015 recessions caused downturns in heavy equipment rental/leasing industry activity. Rental and leasing client companies, primarily in downstream construction, transportation, mining, and forestry market were affected, witnessing an overall decrease in activity. The 2015 recession, in particular, significantly impacted the heavy equipment rental industry (NAICS 53241) as many equipment clients are in oil production, which experienced slow recovery as crude oil and petroleum markets started to pick up on demand.
Data table for Chart 2
| CIMERLSPI Year-over-Year Change | WCS | |
|---|---|---|
| percentage change | US dollars | |
| 2008 | ||
| Quarter 1 | 0.5 | 76.4 |
| Quarter 2 | -0.4 | 102.4 |
| Quarter 3 | -1.1 | 100.0 |
| Quarter 4 | -0.2 | 39.6 |
| 2009 | ||
| Quarter 1 | -1.4 | 34.1 |
| Quarter 2 | -2.4 | 52.2 |
| Quarter 3 | -3.4 | 58.2 |
| Quarter 4 | -4.6 | 64.1 |
| 2010 | ||
| Quarter 1 | -4.9 | 69.7 |
| Quarter 2 | -4.0 | 63.9 |
| Quarter 3 | -2.6 | 60.6 |
| Quarter 4 | -1.4 | 67.1 |
| 2011 | ||
| Quarter 1 | -0.7 | 71.2 |
| Quarter 2 | 0.9 | 84.9 |
| Quarter 3 | 1.8 | 72.1 |
| Quarter 4 | 1.8 | 83.6 |
| 2012 | ||
| Quarter 1 | 1.9 | 81.5 |
| Quarter 2 | 0.8 | 70.6 |
| Quarter 3 | 0.5 | 70.5 |
| Quarter 4 | -0.3 | 70.1 |
| 2013 | ||
| Quarter 1 | -0.5 | 62.4 |
| Quarter 2 | 0.4 | 75.1 |
| Quarter 3 | 0.5 | 88.3 |
| Quarter 4 | 1.3 | 65.3 |
| 2014 | ||
| Quarter 1 | 2.0 | 75.6 |
| Quarter 2 | 1.7 | 82.9 |
| Quarter 3 | 1.2 | 77.0 |
| Quarter 4 | 0.9 | 58.9 |
| 2015 | ||
| Quarter 1 | -1.1 | 33.9 |
| Quarter 2 | -2.3 | 46.4 |
| Quarter 3 | -3.0 | 33.2 |
| Quarter 4 | -3.5 | 27.7 |
| 2016 | ||
| Quarter 1 | -3.4 | 19.2 |
| Quarter 2 | -4.2 | 32.3 |
| Quarter 3 | -4.1 | 31.4 |
| Quarter 4 | -3.0 | 35.0 |
| 2017 | ||
| Quarter 1 | -2.0 | 37.3 |
| Quarter 2 | -0.2 | 37.2 |
| Quarter 3 | 0.1 | 38.3 |
| Quarter 4 | -0.1 | 43.1 |
| 2018 | ||
| Quarter 1 | 0.0 | 38.6 |
| Quarter 2 | 0.6 | 48.6 |
| Quarter 3 | 0.8 | 47.3 |
| Quarter 4 | 0.2 | 19.4 |
| 2019 | ||
| Quarter 1 | 0.4 | 42.6 |
| Quarter 2 | 0.1 | 49.1 |
| Quarter 3 | 0.0 | 44.2 |
| Quarter 4 | 0.1 | 41.1 |
| Source: Statistics Canada, Table 18-10-0064-01, Commercial and industrial machinery and equipment rental and leasing services price index, quarterly and Alberta Provincial Governement, Oil Prices Price per barrel of WCS oil in US dollars (https://economicdashboard.alberta.ca/OilPrice). | ||
To obtain the CIMERLSPI index projections for 2020, an initial comparison from the year-over-year percentage change of both CIMERLSPI and Western Canadian Select (WCS) crude oil prices from previous downturns. Using this comparison as a benchmark, CIMERLSPI 2020 year-over-year percentage change was estimated using 2020 WCS projected (GLJ Petroleum ConsultingNote .) year-over-year percentage change. Based on the CIMERLSPI 2020 year-over-year percent change the index value was calculated.
Decreases in oil prices at the beginning of 2020 combined with a projected slow recovery (based on the forecasting by GLJ Petroleum ConsultingNote ), will be reflected in CIMERLSPI by an overall decrease in 2020 and with a long term recovery beyond 2020, as seen in prior oil price downturns. From the first quarter of 2020 going forward, CIMERLSPI is expected to decrease year-over-year (-0.9% to -3.0%). Also for quarter over-quarter the index is also expected to decrease in 2020 for all quarters and begin to recover in the first quarter of 2021.
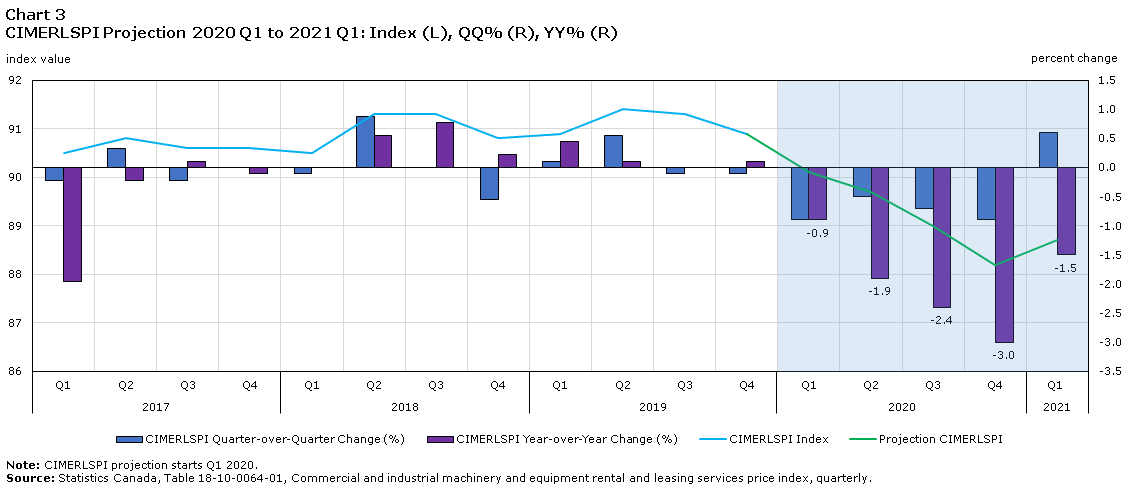
Data table for Chart 3
| CIMERLSPI Index | Projection CIMERLSPI | CIMERLSPI Quarter-over-Quarter Change | CIMERLSPI Year-over-Year Change | |
|---|---|---|---|---|
| index value | percent change | |||
| 2017 | ||||
| Quarter 1 | 90.5 | Note ..: not available for a specific reference period | -0.2 | -2.0 |
| Quarter 2 | 90.8 | Note ..: not available for a specific reference period | 0.3 | -0.2 |
| Quarter 3 | 90.6 | Note ..: not available for a specific reference period | -0.2 | 0.1 |
| Quarter 4 | 90.6 | Note ..: not available for a specific reference period | 0 | -0.1 |
| 2018 | ||||
| Quarter 1 | 90.5 | Note ..: not available for a specific reference period | -0.1 | 0.0 |
| Quarter 2 | 91.3 | Note ..: not available for a specific reference period | 0.9 | 0.6 |
| Quarter 3 | 91.3 | Note ..: not available for a specific reference period | 0.0 | 0.8 |
| Quarter 4 | 90.8 | Note ..: not available for a specific reference period | -0.5 | 0.2 |
| 2019 | ||||
| Quarter 1 | 90.9 | Note ..: not available for a specific reference period | 0.1 | 0.4 |
| Quarter 2 | 91.4 | Note ..: not available for a specific reference period | 0.6 | 0.1 |
| Quarter 3 | 91.3 | Note ..: not available for a specific reference period | -0.1 | 0.0 |
| Quarter 4 | 90.9 | 90.9 | -0.1 | 0.1 |
| 2020 | ||||
| Quarter 1 | Note ..: not available for a specific reference period | 90.1 | -0.9 | -0.9 |
| Quarter 2 | Note ..: not available for a specific reference period | 89.7 | -0.5 | -1.9 |
| Quarter 3 | Note ..: not available for a specific reference period | 89.0 | -0.7 | -2.4 |
| Quarter 4 | Note ..: not available for a specific reference period | 88.2 | -0.9 | -3.0 |
| 2021 | ||||
| Quarter 1 | Note ..: not available for a specific reference period | 88.7 | 0.6 | -1.5 |
|
.. not available for a specific reference period Note: CIMERLSPI projection starts Q1 2020. Source: Statistics Canada, Table 18-10-0064-01, Commercial and industrial machinery and equipment rental and leasing services price index, quarterly. |
||||
- Date modified: