
 StatCan COVID-19: Data to Insights for a Better Canada Transport turning points during COVID-19

Archived Content
Information identified as archived is provided for reference, research or recordkeeping purposes. It is not subject to the Government of Canada Web Standards and has not been altered or updated since it was archived. Please "contact us" to request a format other than those available.
Text begins
Weekly data point to first wave downturn and recovery

In late January, a Canadian resident returning to Toronto from China became Canada's first documented case of the new coronavirus (COVID-19). Although there were only 14 more such cases by the end of February, Statistics Canada was already working to measure the impact of the looming pandemic. Travel and transportation were among the first areas most affected by border closures and public health restrictions. New weekly indicators of aircraft movements and railcars online are examined to assess the initial downturn and the subsequent recovery in the respective transportation of passengers and freight during the first half of 2020
Air movements down sharply while rail freight falls more gradually

To help contain the spread of the virus, the federal government closed its international border to foreign nationals on March 16. A restriction on non-essential travel across the Canada-United States border has been in effect since March 21. To compare the impacts of these as well as other public health restrictions on the movement of people and goods, an index was created using the week of December 28, 2019, as the reference period, set equal to 100 (Figure 1).
After the March restrictions took effect, the impact on aviation was immediate with the number of iterant aircraft movements (that is, take-offs and landings) falling to a low of just over 14,100 during the week of April 11, down 68.2% from the reference week. As the movement of goods remained an essential service, the number of railcars online declined more gradually, hitting a low of 126,400 during the week starting May 9, down 7.9% from the reference week.

Data table for Chart 1
| Week | Aircraft movements (Total) | Railcars online (Systemwide) |
|---|---|---|
| index, week of December 28, 2019 = 100 | ||
| December 28 | 100 | 100 |
| January 04 | 112 | 101 |
| January 11 | 98 | 103 |
| January 18 | 119 | 106 |
| January 25 | 118 | 107 |
| February 01 | 117 | 106 |
| February 08 | 127 | 107 |
| February 15 | 135 | 108 |
| February 22 | 128 | 110 |
| February 29 | 127 | 108 |
| March 07 | 137 | 106 |
| March 14 | 120 | 107 |
| March 21 | 61 | 107 |
| March 28 | 34 | 103 |
| April 04 | 34 | 101 |
| April 11 | 32 | 98 |
| April 18 | 34 | 97 |
| April 25 | 36 | 96 |
| May 02 | 40 | 94 |
| May 09 | 44 | 92 |
| May 16 | 50 | 93 |
| May 23 | 58 | 94 |
| May 30 | 64 | 93 |
| June 06 | 60 | 94 |
| June 13 | 76 | 94 |
| June 20 | 76 | 95 |
|
Note: Week starting Saturday. Source: Statistics Canada, Table 23-10-0287-01 and Table 23-10-0277-01. |
||
Of course, the impact of closures and restrictions was greater on some types of aircraft movements than on others (Figure 2). While domestic itinerant movements (that is, airport to airport) declined by about 60% from the reference week to the week starting April 11, transborder (that is, to and from the United States) and other international movements fell by approximately 90%. From this low of mid-April, total aircraft movements have steadily increased until the end of June. This was driven mainly by domestic flights, albeit with fewer passengers and lower load factors, as well as by more dedicated, but less lucrative air cargo, reflecting a surge in e-commerce sales.Note
Overall, the amplitude of the decline was less severe on the freight side but there were notable differences by type of railcar (Figure 3). System-wide, the number of railcars online declined almost 8% from the reference week to the nadir reached in early May. This decline resulted from sharp drops in the number of tank (-21.2%), box (-8.8%) cars and multilevel automotive (-5.2%) cars, reflecting lower oil prices, the closure of non-essential businesses and disruptions to supply chains. While the recovery is also proving to be gradual, May’s international merchandise trade report points to some encouraging signs, with Canadian exports increasing by 6.7% from April.Note
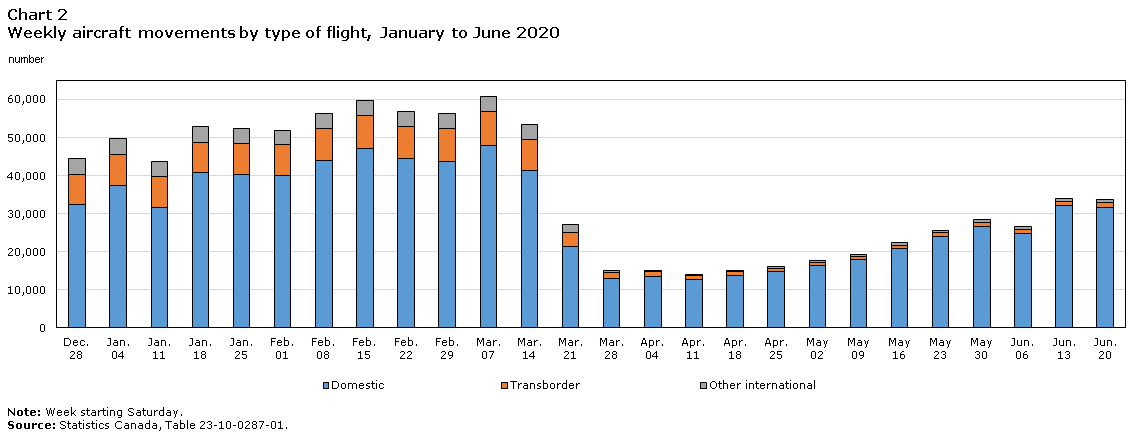
Data table for Chart 2
| Week | Domestic | Transborder | Other international |
|---|---|---|---|
| number | |||
| December 28 | 32,477 | 7,826 | 4,113 |
| January 04 | 37,349 | 8,304 | 4,172 |
| January 11 | 31,725 | 7,931 | 4,016 |
| January 18 | 40,833 | 7,991 | 3,955 |
| January 25 | 40,276 | 8,185 | 3,879 |
| February 01 | 40,090 | 8,024 | 3,846 |
| February 08 | 44,094 | 8,347 | 3,965 |
| February 15 | 47,189 | 8,574 | 3,991 |
| February 22 | 44,486 | 8,423 | 3,934 |
| February 29 | 43,678 | 8,642 | 4,031 |
| March 07 | 47,930 | 8,854 | 4,019 |
| March 14 | 41,279 | 8,195 | 3,990 |
| March 21 | 21,448 | 3,690 | 2,091 |
| March 28 | 13,078 | 1,555 | 527 |
| April 04 | 13,561 | 1,147 | 401 |
| April 11 | 12,811 | 896 | 398 |
| April 18 | 13,820 | 898 | 454 |
| April 25 | 14,781 | 817 | 469 |
| May 02 | 16,428 | 797 | 581 |
| May 09 | 17,902 | 880 | 608 |
| May 16 | 20,824 | 882 | 642 |
| May 23 | 24,010 | 1,004 | 604 |
| May 30 | 26,682 | 1,114 | 618 |
| June 06 | 24,816 | 1,098 | 627 |
| June 13 | 32,167 | 1,113 | 640 |
| June 20 | 31,704 | 1,277 | 665 |
|
Note: Week starting Saturday. Source: Statistics Canada, Table 23-10-0287-01. |
|||
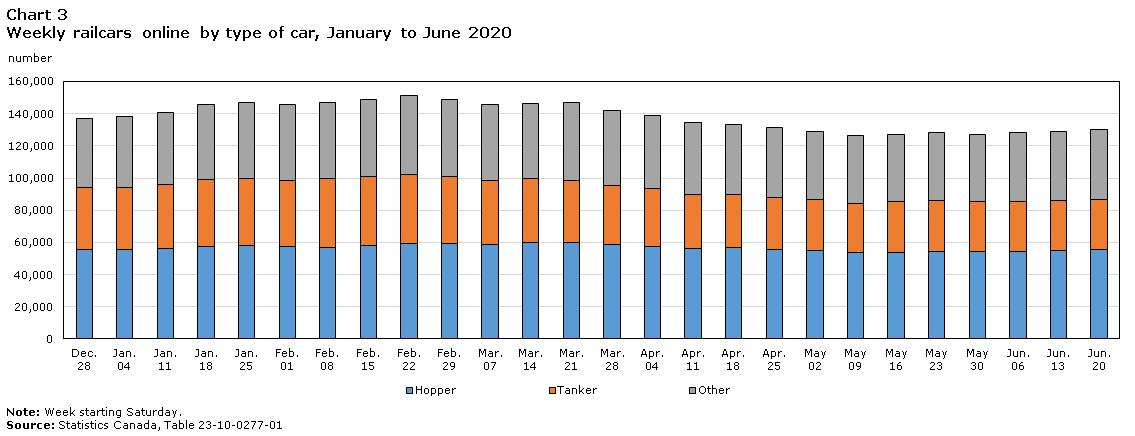
Data table for Chart 3
| Week | Hopper | Tanker | Other |
|---|---|---|---|
| number | |||
| December 28 | 55,583 | 38,850 | 42,777 |
| January 04 | 55,525 | 38,708 | 43,851 |
| January 11 | 56,529 | 39,492 | 44,784 |
| January 18 | 57,554 | 41,437 | 46,723 |
| January 25 | 57,843 | 41,952 | 47,164 |
| February 01 | 57,282 | 41,363 | 47,006 |
| February 08 | 57,093 | 42,445 | 47,379 |
| February 15 | 58,115 | 42,788 | 47,831 |
| February 22 | 59,421 | 42,998 | 48,624 |
| February 29 | 59,489 | 41,403 | 47,682 |
| March 07 | 58,635 | 40,030 | 47,321 |
| March 14 | 59,835 | 39,659 | 47,042 |
| March 21 | 59,886 | 38,816 | 48,030 |
| March 28 | 58,408 | 36,851 | 46,612 |
| April 04 | 57,750 | 36,020 | 45,036 |
| April 11 | 56,163 | 33,923 | 44,162 |
| April 18 | 56,737 | 32,997 | 43,460 |
| April 25 | 55,860 | 32,197 | 43,114 |
| May 02 | 55,142 | 31,804 | 42,298 |
| May 09 | 53,775 | 30,605 | 42,036 |
| May 16 | 53,866 | 31,484 | 41,972 |
| May 23 | 54,577 | 31,291 | 42,456 |
| May 30 | 54,391 | 30,819 | 42,167 |
| June 06 | 54,300 | 31,326 | 42,965 |
| June 13 | 54,743 | 31,152 | 43,236 |
| June 20 | 55,355 | 31,136 | 43,927 |
|
Note: Week starting Saturday. Source: Statistics Canada, Table 23-10-0277-01. |
|||
Methodology
The Weekly Aircraft Movement Statistics cover itinerant aircraft movements reported at major Canadian airports with NAV CANADA control towers. Data are collected for all units of the target population; that is, all itinerant aircraft movements at these airports. For more information, see: Table 23-10-0287-01, Weekly itinerant aircraft movements, airports with NAV CANADA towers
The Weekly Railcars Online are collected by Transport Canada under the auspices of the Transportation Modernization Act. Data are reported by rail carriers directly to Transport Canada and then disseminated on the Statistics Canada website. For more information, see: Table 23-10-0277-01, Weekly rail system performance indicator, by type of rail car
- Date modified: