
 StatCan COVID-19: Data to Insights for a Better Canada Canada’s oil and gas sector: The decline in production and investment and the impact on the economy

Archived Content
Information identified as archived is provided for reference, research or recordkeeping purposes. It is not subject to the Government of Canada Web Standards and has not been altered or updated since it was archived. Please "contact us" to request a format other than those available.
by Weimin Wang
Text begins
The oil and gas industry is an important contributor to the Canadian economy, especially in Alberta. From the year 2000 onwards, its share in the total economy averaged about 5% of Canadian and 21% of Albertan GDP. Its share of jobs was 0.4% and 2.9% in Canada and Alberta, respectively. The recently announced cuts in production and investment in the oil and gas industry will not only impact the industry itself, but its effects will reverberate to the broader economy.
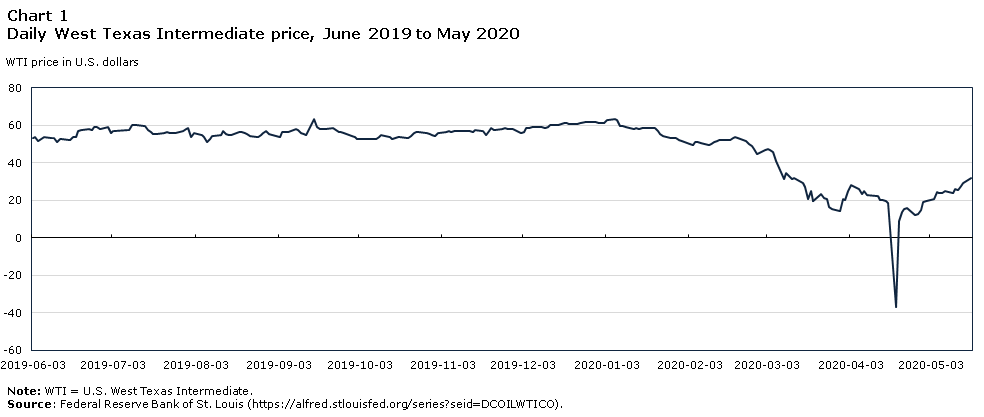
Oil prices dropped sharply in March as the COVID-19 pandemic unfolded and as Russia and Saudi Arabia failed to reach an agreement to support oil prices by limiting production. On Monday, March 9, 2020, U.S. West Texas Intermediate (WTI) crude fell around 30 percent to US$27 a barrel. Since then, the WTI has slid further, to about US$20 a barrel in the mid-April. It turned negative on April 20, closing at -US$37.63 per barrel. Although this was temporaryNote 1, it exposed current constraints in the system for storage. At the same time, the Western Canadian Select (WCS), the benchmark indicator that is widely used to track the price for oil produced in the Alberta oilsands, dropped below US$5 a barrel on average in April, its lowest level ever.
Data table for Chart 1
| Date | WTI price in U.S. dollars |
|---|---|
| 2019-06-03 | 53.25 |
| 2019-06-04 | 53.50 |
| 2019-06-05 | 51.57 |
| 2019-06-06 | 52.59 |
| 2019-06-07 | 53.95 |
| 2019-06-10 | 53.33 |
| 2019-06-11 | 53.30 |
| 2019-06-12 | 51.13 |
| 2019-06-13 | 52.38 |
| 2019-06-14 | 52.47 |
| 2019-06-17 | 51.94 |
| 2019-06-18 | 53.86 |
| 2019-06-19 | 53.74 |
| 2019-06-20 | 56.88 |
| 2019-06-21 | 57.35 |
| 2019-06-24 | 57.73 |
| 2019-06-25 | 57.63 |
| 2019-06-26 | 59.17 |
| 2019-06-27 | 59.18 |
| 2019-06-28 | 58.20 |
| 2019-07-01 | 58.91 |
| 2019-07-02 | 56.00 |
| 2019-07-03 | 57.06 |
| 2019-07-08 | 57.35 |
| 2019-07-09 | 57.57 |
| 2019-07-10 | 60.28 |
| 2019-07-11 | 59.93 |
| 2019-07-12 | 59.99 |
| 2019-07-15 | 59.30 |
| 2019-07-16 | 57.44 |
| 2019-07-17 | 56.50 |
| 2019-07-18 | 55.08 |
| 2019-07-19 | 55.42 |
| 2019-07-22 | 55.87 |
| 2019-07-23 | 56.58 |
| 2019-07-24 | 55.90 |
| 2019-07-25 | 55.88 |
| 2019-07-26 | 56.04 |
| 2019-07-29 | 56.85 |
| 2019-07-30 | 58.04 |
| 2019-07-31 | 58.53 |
| 2019-08-01 | 53.64 |
| 2019-08-02 | 55.67 |
| 2019-08-05 | 54.63 |
| 2019-08-06 | 53.60 |
| 2019-08-07 | 51.14 |
| 2019-08-08 | 52.60 |
| 2019-08-09 | 54.41 |
| 2019-08-12 | 54.98 |
| 2019-08-13 | 57.05 |
| 2019-08-14 | 55.16 |
| 2019-08-15 | 54.51 |
| 2019-08-16 | 54.83 |
| 2019-08-19 | 56.24 |
| 2019-08-20 | 56.18 |
| 2019-08-21 | 55.65 |
| 2019-08-22 | 55.33 |
| 2019-08-23 | 54.08 |
| 2019-08-26 | 53.54 |
| 2019-08-27 | 54.99 |
| 2019-08-28 | 55.76 |
| 2019-08-29 | 56.67 |
| 2019-08-30 | 55.07 |
| 2019-09-03 | 53.91 |
| 2019-09-04 | 56.22 |
| 2019-09-05 | 56.33 |
| 2019-09-06 | 56.45 |
| 2019-09-09 | 57.88 |
| 2019-09-10 | 57.37 |
| 2019-09-11 | 55.66 |
| 2019-09-12 | 55.13 |
| 2019-09-13 | 54.76 |
| 2019-09-16 | 63.10 |
| 2019-09-17 | 59.26 |
| 2019-09-18 | 58.19 |
| 2019-09-19 | 58.19 |
| 2019-09-20 | 57.92 |
| 2019-09-23 | 58.69 |
| 2019-09-24 | 57.22 |
| 2019-09-25 | 56.38 |
| 2019-09-26 | 56.24 |
| 2019-09-27 | 55.95 |
| 2019-09-30 | 54.09 |
| 2019-10-01 | 53.60 |
| 2019-10-02 | 52.67 |
| 2019-10-03 | 52.41 |
| 2019-10-04 | 52.84 |
| 2019-10-07 | 52.76 |
| 2019-10-08 | 52.64 |
| 2019-10-09 | 52.63 |
| 2019-10-10 | 53.57 |
| 2019-10-11 | 54.76 |
| 2019-10-14 | 53.57 |
| 2019-10-15 | 52.81 |
| 2019-10-16 | 53.42 |
| 2019-10-17 | 53.89 |
| 2019-10-18 | 53.75 |
| 2019-10-21 | 53.28 |
| 2019-10-22 | 54.21 |
| 2019-10-23 | 55.90 |
| 2019-10-24 | 56.11 |
| 2019-10-25 | 56.52 |
| 2019-10-28 | 55.60 |
| 2019-10-29 | 55.34 |
| 2019-10-30 | 54.85 |
| 2019-10-31 | 54.02 |
| 2019-11-01 | 56.04 |
| 2019-11-04 | 56.33 |
| 2019-11-05 | 57.04 |
| 2019-11-06 | 56.15 |
| 2019-11-07 | 56.91 |
| 2019-11-08 | 57.02 |
| 2019-11-12 | 56.67 |
| 2019-11-13 | 56.88 |
| 2019-11-14 | 56.57 |
| 2019-11-15 | 57.54 |
| 2019-11-18 | 56.82 |
| 2019-11-19 | 54.93 |
| 2019-11-20 | 56.71 |
| 2019-11-21 | 58.36 |
| 2019-11-22 | 57.68 |
| 2019-11-25 | 57.79 |
| 2019-11-26 | 58.25 |
| 2019-11-27 | 58.12 |
| 2019-11-29 | 58.12 |
| 2019-12-02 | 55.97 |
| 2019-12-03 | 56.15 |
| 2019-12-04 | 58.46 |
| 2019-12-05 | 58.42 |
| 2019-12-06 | 59.20 |
| 2019-12-09 | 58.99 |
| 2019-12-10 | 59.22 |
| 2019-12-11 | 58.74 |
| 2019-12-12 | 59.18 |
| 2019-12-13 | 60.11 |
| 2019-12-16 | 60.21 |
| 2019-12-17 | 60.88 |
| 2019-12-18 | 60.93 |
| 2019-12-19 | 61.30 |
| 2019-12-20 | 60.43 |
| 2019-12-23 | 60.51 |
| 2019-12-24 | 61.17 |
| 2019-12-26 | 61.72 |
| 2019-12-27 | 61.76 |
| 2019-12-30 | 61.66 |
| 2019-12-31 | 61.14 |
| 2020-01-02 | 61.17 |
| 2020-01-03 | 63.00 |
| 2020-01-06 | 63.27 |
| 2020-01-07 | 62.70 |
| 2020-01-08 | 59.65 |
| 2020-01-09 | 59.56 |
| 2020-01-10 | 59.02 |
| 2020-01-13 | 58.17 |
| 2020-01-14 | 58.34 |
| 2020-01-15 | 57.86 |
| 2020-01-16 | 58.52 |
| 2020-01-17 | 58.55 |
| 2020-01-21 | 58.25 |
| 2020-01-22 | 56.76 |
| 2020-01-23 | 55.51 |
| 2020-01-24 | 54.09 |
| 2020-01-27 | 53.09 |
| 2020-01-28 | 53.33 |
| 2020-01-29 | 53.29 |
| 2020-01-30 | 52.19 |
| 2020-01-31 | 51.58 |
| 2020-02-03 | 50.06 |
| 2020-02-04 | 49.59 |
| 2020-02-05 | 50.87 |
| 2020-02-06 | 50.94 |
| 2020-02-07 | 50.34 |
| 2020-02-10 | 49.59 |
| 2020-02-11 | 50.00 |
| 2020-02-12 | 51.13 |
| 2020-02-13 | 51.41 |
| 2020-02-14 | 52.03 |
| 2020-02-18 | 52.10 |
| 2020-02-19 | 53.31 |
| 2020-02-20 | 53.77 |
| 2020-02-21 | 53.36 |
| 2020-02-24 | 51.36 |
| 2020-02-25 | 49.78 |
| 2020-02-26 | 48.67 |
| 2020-02-27 | 47.17 |
| 2020-02-28 | 44.83 |
| 2020-03-02 | 46.78 |
| 2020-03-03 | 47.27 |
| 2020-03-04 | 46.78 |
| 2020-03-05 | 45.90 |
| 2020-03-06 | 41.14 |
| 2020-03-09 | 31.05 |
| 2020-03-10 | 34.47 |
| 2020-03-11 | 33.13 |
| 2020-03-12 | 31.56 |
| 2020-03-13 | 31.72 |
| 2020-03-16 | 28.96 |
| 2020-03-17 | 26.96 |
| 2020-03-18 | 20.48 |
| 2020-03-19 | 25.09 |
| 2020-03-20 | 19.48 |
| 2020-03-23 | 23.33 |
| 2020-03-24 | 21.03 |
| 2020-03-25 | 20.75 |
| 2020-03-26 | 16.60 |
| 2020-03-27 | 15.48 |
| 2020-03-30 | 14.10 |
| 2020-03-31 | 20.51 |
| 2020-04-01 | 20.28 |
| 2020-04-02 | 25.18 |
| 2020-04-03 | 28.36 |
| 2020-04-06 | 26.21 |
| 2020-04-07 | 23.54 |
| 2020-04-08 | 24.97 |
| 2020-04-09 | 22.90 |
| 2020-04-13 | 22.36 |
| 2020-04-14 | 20.15 |
| 2020-04-15 | 19.96 |
| 2020-04-16 | 19.82 |
| 2020-04-17 | 18.31 |
| 2020-04-20 | -36.98 |
| 2020-04-21 | 8.91 |
| 2020-04-22 | 13.64 |
| 2020-04-23 | 15.06 |
| 2020-04-24 | 15.99 |
| 2020-04-27 | 12.17 |
| 2020-04-28 | 12.40 |
| 2020-04-29 | 15.04 |
| 2020-04-30 | 19.23 |
| 2020-05-01 | 19.72 |
| 2020-05-04 | 20.47 |
| 2020-05-05 | 24.56 |
| 2020-05-06 | 23.88 |
| 2020-05-07 | 23.68 |
| 2020-05-08 | 24.73 |
| 2020-05-11 | 24.02 |
| 2020-05-12 | 25.76 |
| 2020-05-13 | 25.37 |
| 2020-05-14 | 27.40 |
| 2020-05-15 | 29.44 |
| 2020-05-18 | 31.83 |
|
Note: WTI = U.S. West Texas Intermediate. Source: Federal Reserve Bank of St. Louis (https://alfred.stlouisfed.org/series?seid=DCOILWTICO). |
|

Data table for Chart 2
| WCS price in U.S. dollars | |
|---|---|
| 2019 | |
| June | 41.7 |
| July | 44.7 |
| August | 43.1 |
| September | 44.8 |
| October | 42.0 |
| November | 42.3 |
| December | 39.1 |
| 2020 | |
| January | 36.8 |
| February | 27.3 |
| March | 12.8 |
| April | 3.5 |
|
Note: WCS = Western Canadian Select. Source: Government of Alberta, 2020, “Oil Prices”, Economic Data. https://economicdashboard.alberta.ca/OilPrice. |
|
In response, companies reacted by adjusting down both capital expenditures and production. As described in Wang (2020), many companies revised downward their capital expenditures by 20% to 57%, and their production by 5% to 8%. These cuts will have a direct impact on the economy. However, as production and investment decline in the oil and gas industry, so does the demand for the inputs the sector uses. The reduction in the production of these inputs by other industries will lead to additional indirect effects. Furthermore, both the direct and indirect effects also cause employees' income and hence their spending to fall. Therefore, businesses serving the needs of these affected employees will also experience falling demand. This is the induced effect of the cut in investment and production in the oil and gas industry.
The total impact of the potential reductions in production and investment in the oil and gas industry on the Canadian economy, including the direct, indirect and induced effects, can be quantified using input-output multipliers derived from Statistics Canada’s supply and use tables for 2016.Note 2
The reactions of specific companies in the oil and gas sector to the decline in oil prices suggest a possible range of outcomes. Many companies have revised downward their capital expenditures and production, but it is unclear how representative these specific firms’ declines are for their industry in general. Therefore, three scenarios are presented. In the first scenario, capital expenditures are assumed to decline 30% and production is assumed to decline by 7%. In the second scenario, the industry’s capital expenditures and production are assumed to fall by 40% and 10%, respectively. In the third scenario, capital expenditures and production are assumed to fall by 20% and 5%, respectively.
The direct impact of the first scenario’s 7% decline in output and a 30% decline in investment in the oil and gas industry is equivalent to a 0.7% drop in GDP and a decline of 23,122 in the total number of jobs (Table 1). The indirect and induced effects of a shock in the oil and gas industry are 77% and 37% of its direct effect on GDP and 388% and 203% of its direct effect on jobs, respectively. In total, under scenario 1, GDP is reduced by 1.5% and the total number of jobs by 159,810, relative to what they would have been without the change in oil prices.
The estimated impacts need to be interpreted with caution. First, given the nature of the shocks facing the sector, demand and supply conditions for oil and gas are highly uncertain and may play out much differently than the scenarios analysed. Second, there are several assumptions behind input-output models, including that: inputs are used in fixed proportions as output is increased or decreased; firms within an industry use the same production process; and prices are fixed. These assumptions can lead to an overstatement of the impacts of a shock if firms can tailor their technology to their new economic conditions, firms are heterogeneous in their capacity to respond to shocks, and/or prices are flexible. Third, the article has focused on the impact of the oil price shock through production and investment in the oil and gas sector. Other channels through which oil prices affect the economy have not been explored.
| Scenario 1 | Scenario 2 | Scenario 3 | ||||
|---|---|---|---|---|---|---|
| Production -7% | Production -10% | Production -5% | ||||
| Investment -30% | Investment -40% | Investment -20% | ||||
| GDP | Jobs | GDP | Jobs | GDP | Jobs | |
| Direct | -0.70% | -23,122 | -1.00% | -32,117 | -0.50% | -16,058 |
| (47%) | (15%) | (47%) | (15%) | (47%) | (15%) | |
| Indirect | -0.50% | -89,664 | -0.70% | -124,544 | -0.40% | -62,272 |
| (36%) | (56%) | (36%) | (56%) | (36%) | (56%) | |
| Induced | -0.30% | -47,023 | -0.40% | -65,316 | -0.20% | -32,658 |
| (17%) | (29%) | (17%) | (29%) | (17%) | (29%) | |
| Total | -1.50% | -159,810 | -2.00% | -221,976 | -1.00% | -110,988 |
| (100%) | (100%) | (100%) | (100%) | (100%) | (100%) | |
|
Note: GDP = Gross domestic product. Source: Statistics Canada, author's calculation. |
||||||
References
Government of Alberta, 2020, “Oil Prices”, Economic Data, last updated in May 2020. https://economicdashboard.alberta.ca/OilPrice.
Wang, W. 2020. The Decline in Production and Investment in Canada’s Oil and Gas Sector and its Impact on the Economy. Economic Insights, no. 109. Statistics Canada Catalogue no. 11-626-X. Ottawa: Statistics Canada.
Related articles
- Date modified: