
 StatCan COVID-19: Data to Insights for a Better Canada COVID-19 Impact Analysis and 2020 Outlook: Couriers and Messengers Services Price Index

Archived Content
Information identified as archived is provided for reference, research or recordkeeping purposes. It is not subject to the Government of Canada Web Standards and has not been altered or updated since it was archived. Please "contact us" to request a format other than those available.
Start of text box
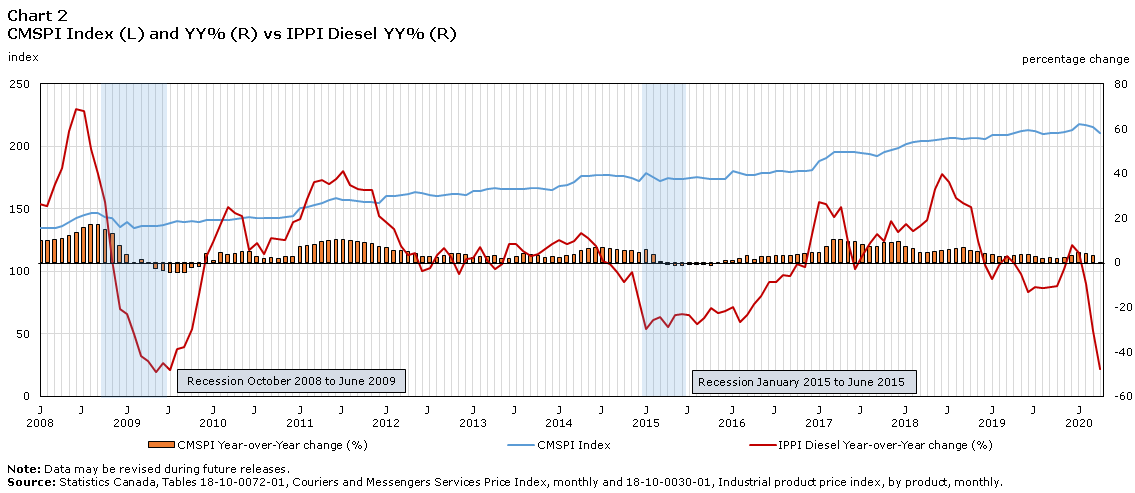
- CMSPI’s movements are cyclical and significantly impacted by fuel prices.
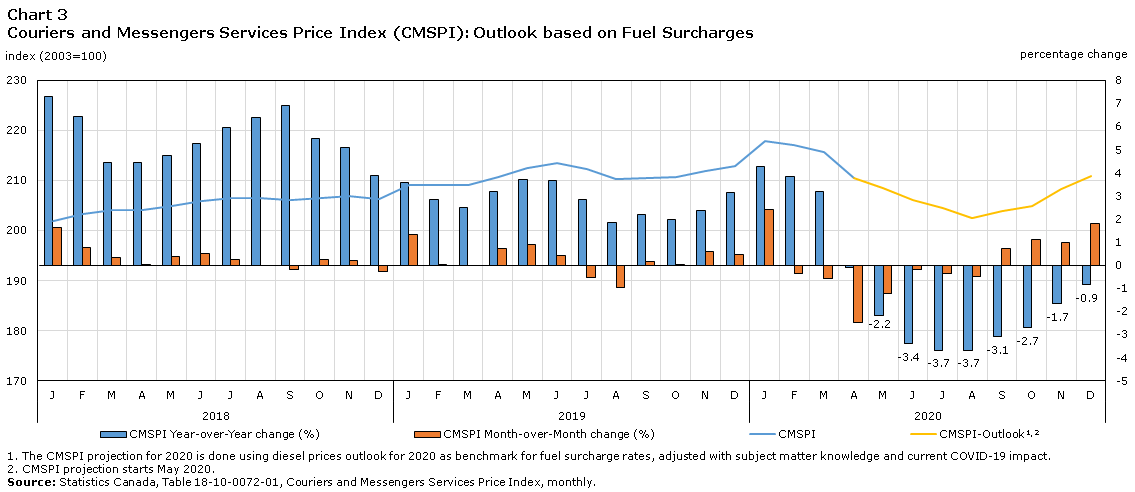
- In 2020 the CMSPI is expected to decrease until mid-year followed by modest increases towards the year-end.
The Couriers and Messengers Services Price Index (CMSPI) measures the price movements of services provided by Couriers and Messengers for long and short distance deliveries to Canadian-based business.
CMSPI’s movements are cyclical but show a lag to economic upturns and downturns, as fuel price changes significantly impact the price movements. Fuel prices are the main drivers behind these movements.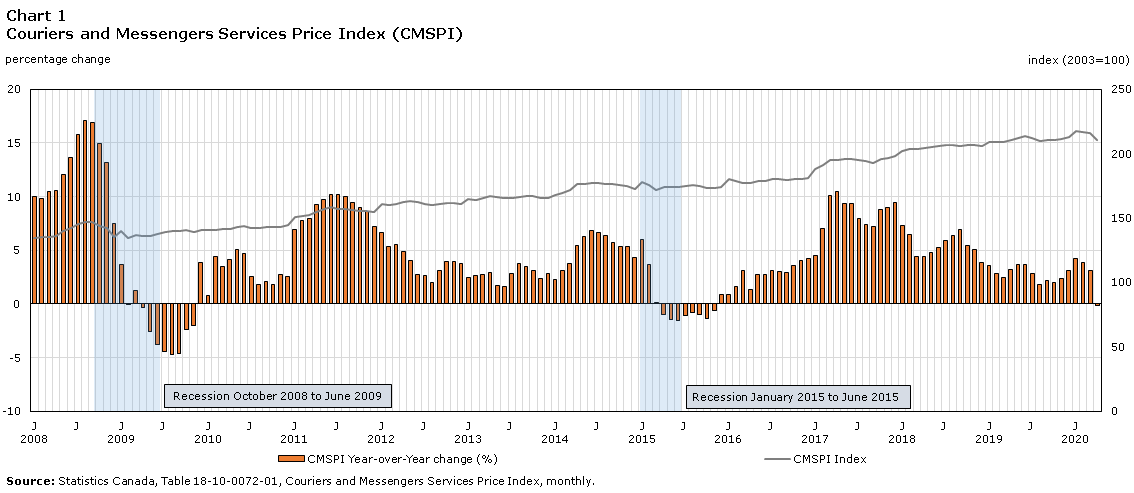
Data table for Chart 1
| CMSPI Index | CMSPI Year-over-Year change (%) | |
|---|---|---|
| index (2003=100) | percentage change | |
| 2008 | ||
| January | 134.8 | 10.0 |
| February | 135.0 | 9.8 |
| March | 135.0 | 10.5 |
| April | 136.5 | 10.6 |
| May | 139.8 | 12.1 |
| June | 142.7 | 13.6 |
| July | 145.5 | 15.8 |
| August | 147.0 | 17.1 |
| September | 146.6 | 16.9 |
| October | 143.9 | 14.9 |
| November | 142.4 | 13.2 |
| December | 135.7 | 7.5 |
| 2009 | ||
| January | 139.8 | 3.7 |
| February | 134.9 | -0.1 |
| March | 136.7 | 1.3 |
| April | 136.0 | -0.4 |
| May | 136.2 | -2.6 |
| June | 137.3 | -3.8 |
| July | 139.1 | -4.4 |
| August | 140.1 | -4.7 |
| September | 139.9 | -4.6 |
| October | 140.5 | -2.4 |
| November | 139.6 | -2.0 |
| December | 141.0 | 3.9 |
| 2010 | ||
| January | 140.9 | 0.8 |
| February | 140.9 | 4.4 |
| March | 141.5 | 3.5 |
| April | 141.7 | 4.2 |
| May | 143.1 | 5.1 |
| June | 143.8 | 4.7 |
| July | 142.7 | 2.6 |
| August | 142.6 | 1.8 |
| September | 142.8 | 2.1 |
| October | 143.0 | 1.8 |
| November | 143.4 | 2.7 |
| December | 144.6 | 2.6 |
| 2011 | ||
| January | 150.7 | 7.0 |
| February | 151.9 | 7.8 |
| March | 152.8 | 8.0 |
| April | 154.8 | 9.2 |
| May | 157.0 | 9.7 |
| June | 158.5 | 10.2 |
| July | 157.2 | 10.2 |
| August | 156.9 | 10.0 |
| September | 156.3 | 9.5 |
| October | 155.9 | 9.0 |
| November | 155.8 | 8.6 |
| December | 155.1 | 7.3 |
| 2012 | ||
| January | 160.7 | 6.6 |
| February | 160.0 | 5.3 |
| March | 161.3 | 5.6 |
| April | 162.3 | 4.8 |
| May | 163.3 | 4.0 |
| June | 162.9 | 2.8 |
| July | 161.3 | 2.6 |
| August | 160.1 | 2.0 |
| September | 161.2 | 3.1 |
| October | 162.0 | 3.9 |
| November | 162.0 | 4.0 |
| December | 160.9 | 3.7 |
| 2013 | ||
| January | 164.6 | 2.4 |
| February | 164.3 | 2.7 |
| March | 165.7 | 2.7 |
| April | 167.1 | 3.0 |
| May | 166.1 | 1.7 |
| June | 165.6 | 1.7 |
| July | 165.9 | 2.9 |
| August | 166.2 | 3.8 |
| September | 166.9 | 3.5 |
| October | 167.1 | 3.1 |
| November | 165.8 | 2.3 |
| December | 165.5 | 2.9 |
| 2014 | ||
| January | 168.3 | 2.2 |
| February | 169.5 | 3.2 |
| March | 171.9 | 3.7 |
| April | 176.2 | 5.4 |
| May | 176.5 | 6.3 |
| June | 176.9 | 6.8 |
| July | 176.9 | 6.6 |
| August | 176.8 | 6.4 |
| September | 176.5 | 5.8 |
| October | 176.1 | 5.4 |
| November | 174.7 | 5.4 |
| December | 172.6 | 4.3 |
| 2015 | ||
| January | 178.4 | 6.0 |
| February | 175.7 | 3.7 |
| March | 172.0 | 0.1 |
| April | 174.5 | -1.0 |
| May | 174.0 | -1.4 |
| June | 174.1 | -1.6 |
| July | 175.0 | -1.1 |
| August | 175.4 | -0.8 |
| September | 174.7 | -1.0 |
| October | 173.7 | -1.4 |
| November | 173.7 | -0.6 |
| December | 174.1 | 0.9 |
| 2016 | ||
| January | 180.0 | 0.9 |
| February | 178.5 | 1.6 |
| March | 177.3 | 3.1 |
| April | 176.9 | 1.4 |
| May | 178.8 | 2.8 |
| June | 178.9 | 2.8 |
| July | 180.4 | 3.1 |
| August | 180.7 | 3.0 |
| September | 179.8 | 2.9 |
| October | 180.0 | 3.6 |
| November | 180.7 | 4.0 |
| December | 181.5 | 4.3 |
| 2017 | ||
| January | 188.1 | 4.5 |
| February | 191.0 | 7.0 |
| March | 195.3 | 10.2 |
| April | 195.4 | 10.5 |
| May | 195.6 | 9.4 |
| June | 195.6 | 9.3 |
| July | 194.8 | 8.0 |
| August | 194.0 | 7.4 |
| September | 192.7 | 7.2 |
| October | 195.8 | 8.8 |
| November | 196.9 | 9.0 |
| December | 198.6 | 9.4 |
| 2018 | ||
| January | 201.8 | 7.3 |
| February | 203.3 | 6.4 |
| March | 204.0 | 4.5 |
| April | 204.1 | 4.5 |
| May | 204.9 | 4.8 |
| June | 205.9 | 5.3 |
| July | 206.4 | 6.0 |
| August | 206.4 | 6.4 |
| September | 206.0 | 6.9 |
| October | 206.5 | 5.5 |
| November | 206.9 | 5.1 |
| December | 206.3 | 3.9 |
| 2019 | ||
| January | 209.0 | 3.6 |
| February | 209.1 | 2.9 |
| March | 209.1 | 2.5 |
| April | 210.6 | 3.2 |
| May | 212.5 | 3.7 |
| June | 213.4 | 3.6 |
| July | 212.3 | 2.9 |
| August | 210.2 | 1.8 |
| September | 210.5 | 2.2 |
| October | 210.6 | 2.0 |
| November | 211.8 | 2.4 |
| December | 212.8 | 3.2 |
| 2020 | ||
| January | 217.9 | 4.3 |
| February | 217.1 | 3.8 |
| March | 215.7 | 3.2 |
| April | 210.4 | -0.1 |
| Source: Statistics Canada, Table 18-10-0072-01, Couriers and messengers services price index, monthly. | ||
In 2020, the Postal services and Couriers and Messengers real GDP is projected to expand due to the increase in demand for home deliveries during the COVID-19 outbreak (e.g. +10% to +25% growth in B.C. according to the Business Council of British Columbia, March 27, 2020 estimates).
Data table for Chart 2
| CMSPI Index | CMSPI Year-over-Year change (%) | IPPI Diesel Year-over-Year change (%) | |
|---|---|---|---|
| index (2003=100) | percentage change | ||
| 2008 | |||
| January | 134.8 | 10.0 | 26.2 |
| February | 135.0 | 9.8 | 25.4 |
| March | 135.0 | 10.5 | 35.2 |
| April | 136.5 | 10.6 | 42.5 |
| May | 139.8 | 12.1 | 58.7 |
| June | 142.7 | 13.6 | 68.9 |
| July | 145.5 | 15.8 | 68.0 |
| August | 147.0 | 17.1 | 50.6 |
| September | 146.6 | 16.9 | 39.5 |
| October | 143.9 | 14.9 | 27.3 |
| November | 142.4 | 13.2 | 0.9 |
| December | 135.7 | 7.5 | -20.8 |
| 2009 | |||
| January | 139.8 | 3.7 | -23.2 |
| February | 134.9 | -0.1 | -31.9 |
| March | 136.7 | 1.3 | -42.1 |
| April | 136.0 | -0.4 | -44.0 |
| May | 136.2 | -2.6 | -49.2 |
| June | 137.3 | -3.8 | -45.3 |
| July | 139.1 | -4.4 | -48.4 |
| August | 140.1 | -4.7 | -38.6 |
| September | 139.9 | -4.6 | -38.0 |
| October | 140.5 | -2.4 | -29.8 |
| November | 139.6 | -2.0 | -14.2 |
| December | 141.0 | 3.9 | 2.4 |
| 2010 | |||
| January | 140.9 | 0.8 | 9.1 |
| February | 140.9 | 4.4 | 17.6 |
| March | 141.5 | 3.5 | 25.0 |
| April | 141.7 | 4.2 | 22.3 |
| May | 143.1 | 5.1 | 20.8 |
| June | 143.8 | 4.7 | 5.4 |
| July | 142.7 | 2.6 | 8.6 |
| August | 142.6 | 1.8 | 3.8 |
| September | 142.8 | 2.1 | 10.8 |
| October | 143.0 | 1.8 | 10.5 |
| November | 143.4 | 2.7 | 10.1 |
| December | 144.6 | 2.6 | 18.1 |
| 2011 | |||
| January | 150.7 | 7.0 | 19.4 |
| February | 151.9 | 7.8 | 28.4 |
| March | 152.8 | 8.0 | 35.9 |
| April | 154.8 | 9.2 | 37.1 |
| May | 157.0 | 9.7 | 35.0 |
| June | 158.5 | 10.2 | 37.4 |
| July | 157.2 | 10.2 | 40.9 |
| August | 156.9 | 10.0 | 34.7 |
| September | 156.3 | 9.5 | 32.9 |
| October | 155.9 | 9.0 | 32.3 |
| November | 155.8 | 8.6 | 32.4 |
| December | 155.1 | 7.3 | 20.6 |
| 2012 | |||
| January | 160.7 | 6.6 | 18.0 |
| February | 160.0 | 5.3 | 14.8 |
| March | 161.3 | 5.6 | 7.2 |
| April | 162.3 | 4.8 | 3.2 |
| May | 163.3 | 4.0 | 4.3 |
| June | 162.9 | 2.8 | -3.9 |
| July | 161.3 | 2.6 | -2.5 |
| August | 160.1 | 2.0 | 3.5 |
| September | 161.2 | 3.1 | 6.5 |
| October | 162.0 | 3.9 | 2.3 |
| November | 162.0 | 4.0 | -5.4 |
| December | 160.9 | 3.7 | 1.7 |
| 2013 | |||
| January | 164.6 | 2.4 | 1.8 |
| February | 164.3 | 2.7 | 6.9 |
| March | 165.7 | 2.7 | 1.0 |
| April | 167.1 | 3.0 | -3.1 |
| May | 166.1 | 1.7 | -0.8 |
| June | 165.6 | 1.7 | 8.1 |
| July | 165.9 | 2.9 | 8.3 |
| August | 166.2 | 3.8 | 5.1 |
| September | 166.9 | 3.5 | 2.7 |
| October | 167.1 | 3.1 | 3.8 |
| November | 165.8 | 2.3 | 6.0 |
| December | 165.5 | 2.9 | 8.4 |
| 2014 | |||
| January | 168.3 | 2.2 | 10.0 |
| February | 169.5 | 3.2 | 8.2 |
| March | 171.9 | 3.7 | 9.6 |
| April | 176.2 | 5.4 | 13.0 |
| May | 176.5 | 6.3 | 11.0 |
| June | 176.9 | 6.8 | 7.2 |
| July | 176.9 | 6.6 | 0.9 |
| August | 176.8 | 6.4 | -0.6 |
| September | 176.5 | 5.8 | -4.5 |
| October | 176.1 | 5.4 | -8.7 |
| November | 174.7 | 5.4 | -4.1 |
| December | 172.6 | 4.3 | -17.4 |
| 2015 | |||
| January | 178.4 | 6.0 | -29.9 |
| February | 175.7 | 3.7 | -26.0 |
| March | 172.0 | 0.1 | -24.3 |
| April | 174.5 | -1.0 | -28.8 |
| May | 174.0 | -1.4 | -23.7 |
| June | 174.1 | -1.6 | -23.3 |
| July | 175.0 | -1.1 | -23.7 |
| August | 175.4 | -0.8 | -27.7 |
| September | 174.7 | -1.0 | -24.9 |
| October | 173.7 | -1.4 | -20.4 |
| November | 173.7 | -0.6 | -22.5 |
| December | 174.1 | 0.9 | -21.6 |
| 2016 | |||
| January | 180.0 | 0.9 | -20.1 |
| February | 178.5 | 1.6 | -26.9 |
| March | 177.3 | 3.1 | -23.6 |
| April | 176.9 | 1.4 | -18.4 |
| May | 178.8 | 2.8 | -15.1 |
| June | 178.9 | 2.8 | -8.6 |
| July | 180.4 | 3.1 | -8.9 |
| August | 180.7 | 3.0 | -5.4 |
| September | 179.8 | 2.9 | -6.0 |
| October | 180.0 | 3.6 | -0.9 |
| November | 180.7 | 4.0 | -2.0 |
| December | 181.5 | 4.3 | 12.7 |
| 2017 | |||
| January | 188.1 | 4.5 | 27.3 |
| February | 191.0 | 7.0 | 26.2 |
| March | 195.3 | 10.2 | 20.2 |
| April | 195.4 | 10.5 | 24.7 |
| May | 195.6 | 9.4 | 9.1 |
| June | 195.6 | 9.3 | -2.8 |
| July | 194.8 | 8.0 | 2.9 |
| August | 194.0 | 7.4 | 8.8 |
| September | 192.7 | 7.2 | 12.9 |
| October | 195.8 | 8.8 | 9.7 |
| November | 196.9 | 9.0 | 18.4 |
| December | 198.6 | 9.4 | 13.6 |
| 2018 | |||
| January | 201.8 | 7.3 | 17.3 |
| February | 203.3 | 6.4 | 14.3 |
| March | 204.0 | 4.5 | 16.2 |
| April | 204.1 | 4.5 | 19.2 |
| May | 204.9 | 4.8 | 33.1 |
| June | 205.9 | 5.3 | 39.8 |
| July | 206.4 | 6.0 | 36.0 |
| August | 206.4 | 6.4 | 29.1 |
| September | 206.0 | 6.9 | 26.5 |
| October | 206.5 | 5.5 | 24.9 |
| November | 206.9 | 5.1 | 9.5 |
| December | 206.3 | 3.9 | -1.0 |
| 2019 | |||
| January | 209.0 | 3.6 | -7.5 |
| February | 209.1 | 2.9 | -1.0 |
| March | 209.1 | 2.5 | 3.0 |
| April | 210.6 | 3.2 | -0.2 |
| May | 212.5 | 3.7 | -5.3 |
| June | 213.4 | 3.6 | -13.1 |
| July | 212.3 | 2.9 | -10.8 |
| August | 210.2 | 1.8 | -11.6 |
| September | 210.5 | 2.2 | -10.9 |
| October | 210.6 | 2.0 | -10.5 |
| November | 211.8 | 2.4 | -3.0 |
| December | 212.8 | 3.2 | 7.7 |
| 2020 | |||
| January | 217.9 | 4.3 | 4.4 |
| February | 217.1 | 3.8 | -9.5 |
| March | 215.7 | 3.2 | -30.8 |
| April | 210.4 | -0.1 | -47.9 |
|
Note: Data may be revised during future releases. Source: Statistics Canada, Tables 18-10-0072-01, Couriers and messengers services price index, monthly and 18-10-0030-01, Industrial product price index, by product, monthly. |
|||
However, the CMSPI may follow a different trend than the industry output. With no expected annual increases in base prices for 2020, as couriers and messengers typically increase the base prices in January and February, fuel prices are expected to drive the CMSPI movement in 2020.
From May onwards, the index is expected to decrease year-over-year (-0.9% to -3.7%). Month-over-month, the index is expected to decrease until August and increase (+0.7% to +1.8%) up to December.
Data table for Chart 3
| CMSPI | CMSPI-Outlook (1) | CMSPI Year-over-Year change (%) | CMSPI Month-over-Month change (%) | |
|---|---|---|---|---|
| index (2003=100) | percentage change | |||
| 2018 | ||||
| January | 201.8 | Note ..: not available for a specific reference period | 7.3 | 1.6 |
| February | 203.3 | Note ..: not available for a specific reference period | 6.4 | 0.7 |
| March | 204.0 | Note ..: not available for a specific reference period | 4.5 | 0.3 |
| April | 204.1 | Note ..: not available for a specific reference period | 4.5 | 0.0 |
| May | 204.9 | Note ..: not available for a specific reference period | 4.8 | 0.4 |
| June | 205.9 | Note ..: not available for a specific reference period | 5.3 | 0.5 |
| July | 206.4 | Note ..: not available for a specific reference period | 6.0 | 0.2 |
| August | 206.4 | Note ..: not available for a specific reference period | 6.4 | 0.0 |
| September | 206.0 | Note ..: not available for a specific reference period | 6.9 | -0.2 |
| October | 206.5 | Note ..: not available for a specific reference period | 5.5 | 0.2 |
| November | 206.9 | Note ..: not available for a specific reference period | 5.1 | 0.2 |
| December | 206.3 | Note ..: not available for a specific reference period | 3.9 | -0.3 |
| 2019 | ||||
| January | 209.0 | Note ..: not available for a specific reference period | 3.6 | 1.3 |
| February | 209.1 | Note ..: not available for a specific reference period | 2.9 | 0.0 |
| March | 209.1 | Note ..: not available for a specific reference period | 2.5 | 0.0 |
| April | 210.6 | Note ..: not available for a specific reference period | 3.2 | 0.7 |
| May | 212.5 | Note ..: not available for a specific reference period | 3.7 | 0.9 |
| June | 213.4 | Note ..: not available for a specific reference period | 3.6 | 0.4 |
| July | 212.3 | Note ..: not available for a specific reference period | 2.9 | -0.5 |
| August | 210.2 | Note ..: not available for a specific reference period | 1.8 | -1.0 |
| September | 210.5 | Note ..: not available for a specific reference period | 2.2 | 0.1 |
| October | 210.6 | Note ..: not available for a specific reference period | 2.0 | 0.0 |
| November | 211.8 | Note ..: not available for a specific reference period | 2.4 | 0.6 |
| December | 212.8 | Note ..: not available for a specific reference period | 3.2 | 0.5 |
| 2020 | ||||
| January | 217.9 | Note ..: not available for a specific reference period | 4.3 | 2.4 |
| February | 217.1 | Note ..: not available for a specific reference period | 3.8 | -0.4 |
| March | 215.7 | Note ..: not available for a specific reference period | 3.2 | -0.6 |
| April | 210.4 | 210.4 | -0.1 | -2.5 |
| May | Note ..: not available for a specific reference period | 208.5 | -2.2 | -1.2 |
| June | Note ..: not available for a specific reference period | 206.1 | -3.4 | -0.2 |
| July | Note ..: not available for a specific reference period | 204.5 | -3.7 | -0.4 |
| August | Note ..: not available for a specific reference period | 202.5 | -3.7 | -0.5 |
| September | Note ..: not available for a specific reference period | 204.0 | -3.1 | 0.7 |
| October | Note ..: not available for a specific reference period | 204.9 | -2.7 | 1.1 |
| November | Note ..: not available for a specific reference period | 208.2 | -1.7 | 1.0 |
| December | Note ..: not available for a specific reference period | 211.0 | -0.9 | 1.8 |
|
.. not available for a specific reference period Source: Statistics Canada, Table 18-10-0072-01, Couriers and messengers services price index, monthly. |
||||
- Date modified: