
 StatCan COVID-19: Data to Insights for a Better Canada COVID-19 Impact Analysis and 2020 Outlook: Wholesale Services Price Index

Archived Content
Information identified as archived is provided for reference, research or recordkeeping purposes. It is not subject to the Government of Canada Web Standards and has not been altered or updated since it was archived. Please "contact us" to request a format other than those available.
Text begins
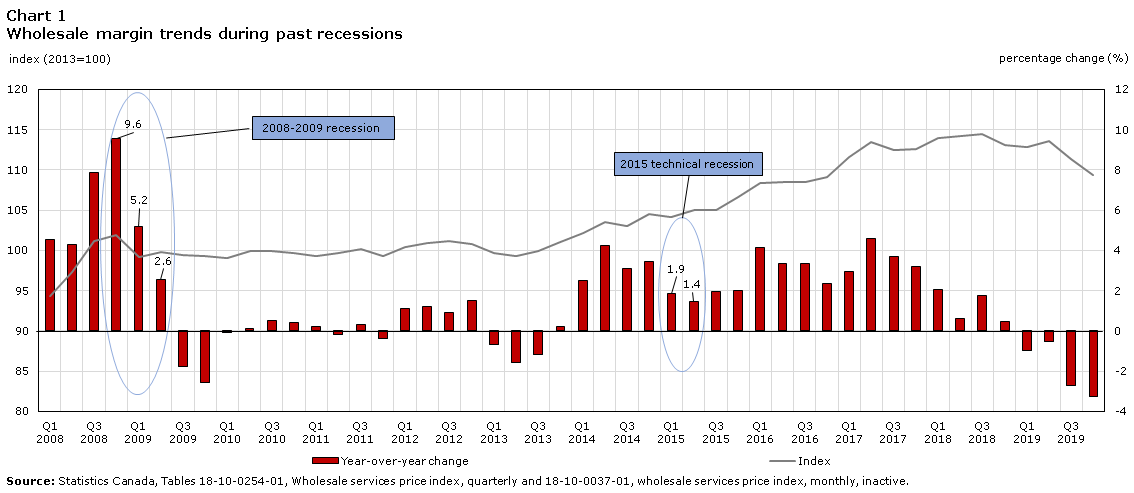
The Wholesale Services Price Index (WSPI) represents the change in the price of wholesale services, which is defined as the margin price, the difference between the purchase price and the selling price of the product being priced.
- Historically, the growth of wholesale margins slowed during past recessions but remained positive.
- Margins post-2009 recession were lower than before the recession (cumulative decline of 1.8%).
Wholesale Trade accounts for around 5-6% of GDP (5.3% in 2018). Note
Data table for Chart 1
| Index | Year-over-year change | |
|---|---|---|
| (2013=100) | percent | |
| 2008 | ||
| Quarter 1 | 94.3 | 4.5 |
| Quarter 2 | 97.3 | 4.3 |
| Quarter 3 | 101.2 | 7.9 |
| Quarter 4 | 101.9 | 9.6 |
| 2009 | ||
| Quarter 1 | 99.2 | 5.2 |
| Quarter 2 | 99.8 | 2.6 |
| Quarter 3 | 99.4 | -1.8 |
| Quarter 4 | 99.3 | -2.6 |
| 2010 | ||
| Quarter 1 | 99.1 | -0.1 |
| Quarter 2 | 99.9 | 0.1 |
| Quarter 3 | 99.9 | 0.5 |
| Quarter 4 | 99.7 | 0.4 |
| 2011 | ||
| Quarter 1 | 99.3 | 0.2 |
| Quarter 2 | 99.7 | -0.2 |
| Quarter 3 | 100.2 | 0.3 |
| Quarter 4 | 99.3 | -0.4 |
| 2012 | ||
| Quarter 1 | 100.4 | 1.1 |
| Quarter 2 | 100.9 | 1.2 |
| Quarter 3 | 101.1 | 0.9 |
| Quarter 4 | 100.8 | 1.5 |
| 2013 | ||
| Quarter 1 | 99.7 | -0.7 |
| Quarter 2 | 99.3 | -1.6 |
| Quarter 3 | 99.9 | -1.2 |
| Quarter 4 | 101.0 | 0.2 |
| 2014 | ||
| Quarter 1 | 102.2 | 2.5 |
| Quarter 2 | 103.5 | 4.2 |
| Quarter 3 | 103.0 | 3.1 |
| Quarter 4 | 104.5 | 3.5 |
| 2015 | ||
| Quarter 1 | 104.1 | 1.9 |
| Quarter 2 | 105.0 | 1.4 |
| Quarter 3 | 105.0 | 1.9 |
| Quarter 4 | 106.6 | 2.0 |
| 2016 | ||
| Quarter 1 | 108.4 | 4.1 |
| Quarter 2 | 108.5 | 3.3 |
| Quarter 3 | 108.5 | 3.3 |
| Quarter 4 | 109.1 | 2.3 |
| 2017 | ||
| Quarter 1 | 111.6 | 3.0 |
| Quarter 2 | 113.5 | 4.6 |
| Quarter 3 | 112.5 | 3.7 |
| Quarter 4 | 112.6 | 3.2 |
| 2018 | ||
| Quarter 1 | 113.9 | 2.1 |
| Quarter 2 | 114.2 | 0.6 |
| Quarter 3 | 114.5 | 1.8 |
| Quarter 4 | 113.1 | 0.4 |
| 2019 | ||
| Quarter 1 | 112.8 | -1.0 |
| Quarter 2 | 113.6 | -0.5 |
| Quarter 3 | 111.4 | -2.7 |
| Quarter 4 | 109.4 | -3.3 |
| Source: Statistics Canada, Tables 18-10-0254-01, Wholesale services price index, quarterly and 18-10-0037-01, wholesale services price index, monthly, inactive. | ||
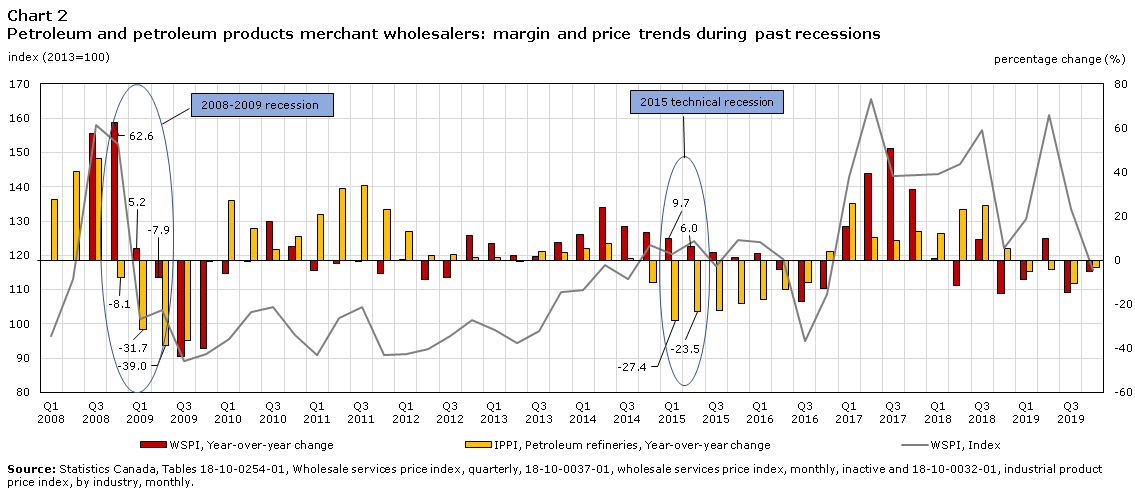
Recession response varies vastly between subsectors
Margins for petroleum and petroleum products merchant wholesalers contracted sharply in 2008-2009 but were resilient in 2015, even though the purchase and selling prices plummeted in both periods (Chart 2).
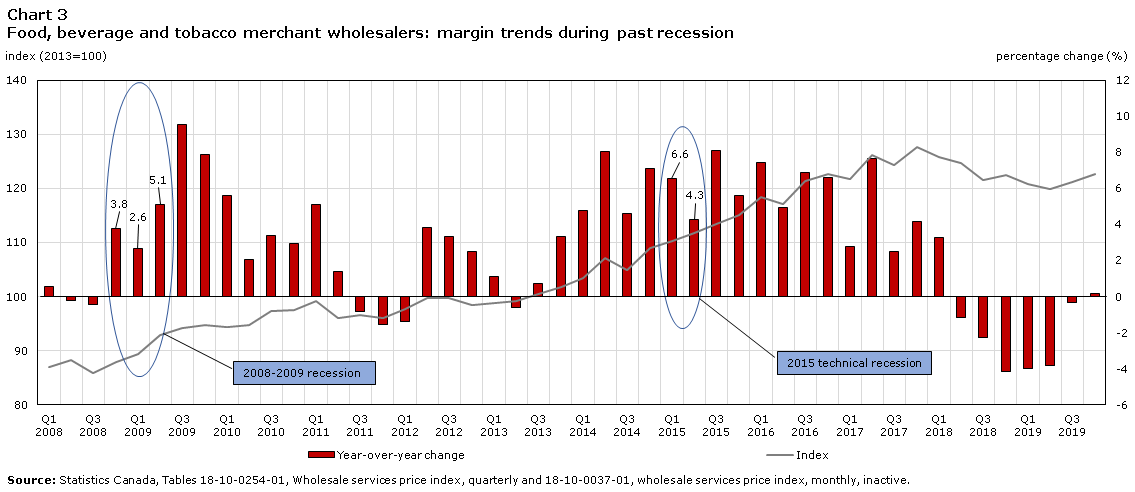
Margins for food, beverage and tobacco merchant wholesalers remained strong during both recessions (Chart 3).
Data table for Chart 2
| WSPI, Index | WSPI, Year-over-year change | IPPI, Petroleum refineries, Year-over-year change | |
|---|---|---|---|
| (2013=100) | percent | ||
| 2008 | |||
| Quarter 1 | 96.5 | Note ..: not available for a specific reference period | 27.5 |
| Quarter 2 | 113.0 | Note ..: not available for a specific reference period | 40.1 |
| Quarter 3 | 158.1 | 57.6 | 46.0 |
| Quarter 4 | 152.5 | 62.6 | -8.1 |
| 2009 | |||
| Quarter 1 | 101.5 | 5.2 | -31.7 |
| Quarter 2 | 104.1 | -7.9 | -39.0 |
| Quarter 3 | 89.2 | -43.6 | -36.6 |
| Quarter 4 | 91.1 | -40.3 | -0.4 |
| 2010 | |||
| Quarter 1 | 95.5 | -5.9 | 27.0 |
| Quarter 2 | 103.4 | -0.7 | 14.4 |
| Quarter 3 | 104.9 | 17.6 | 5.0 |
| Quarter 4 | 96.6 | 6.0 | 10.8 |
| 2011 | |||
| Quarter 1 | 90.8 | -4.9 | 20.6 |
| Quarter 2 | 101.8 | -1.5 | 32.5 |
| Quarter 3 | 104.8 | -0.1 | 33.9 |
| Quarter 4 | 90.9 | -5.9 | 22.8 |
| 2012 | |||
| Quarter 1 | 91.2 | 0.4 | 12.9 |
| Quarter 2 | 92.7 | -8.9 | 2.1 |
| Quarter 3 | 96.5 | -7.9 | 2.7 |
| Quarter 4 | 101.1 | 11.2 | 1.1 |
| 2013 | |||
| Quarter 1 | 98.2 | 7.7 | 1.2 |
| Quarter 2 | 94.5 | 1.9 | -0.2 |
| Quarter 3 | 97.9 | 1.5 | 3.8 |
| Quarter 4 | 109.4 | 8.2 | 3.5 |
| 2014 | |||
| Quarter 1 | 109.8 | 11.8 | 5.3 |
| Quarter 2 | 117.2 | 24.0 | 7.6 |
| Quarter 3 | 113.0 | 15.4 | 0.6 |
| Quarter 4 | 122.9 | 12.3 | -10.0 |
| 2015 | |||
| Quarter 1 | 120.5 | 9.7 | -27.4 |
| Quarter 2 | 124.2 | 6.0 | -23.5 |
| Quarter 3 | 116.9 | 3.5 | -23.0 |
| Quarter 4 | 124.6 | 1.4 | -19.8 |
| 2016 | |||
| Quarter 1 | 124.0 | 2.9 | -18.0 |
| Quarter 2 | 119.0 | -4.2 | -13.1 |
| Quarter 3 | 94.9 | -18.8 | -9.9 |
| Quarter 4 | 108.8 | -12.7 | 3.8 |
| 2017 | |||
| Quarter 1 | 142.8 | 15.2 | 25.6 |
| Quarter 2 | 165.7 | 39.2 | 10.3 |
| Quarter 3 | 143.1 | 50.8 | 9.1 |
| Quarter 4 | 143.5 | 31.9 | 13.2 |
| 2018 | |||
| Quarter 1 | 143.6 | 0.6 | 12.1 |
| Quarter 2 | 146.7 | -11.5 | 23.0 |
| Quarter 3 | 156.6 | 9.4 | 24.8 |
| Quarter 4 | 122.0 | -15.0 | 5.5 |
| 2019 | |||
| Quarter 1 | 130.7 | -9.0 | -5.1 |
| Quarter 2 | 161.0 | 9.7 | -4.4 |
| Quarter 3 | 133.4 | -14.8 | -10.5 |
| Quarter 4 | 115.6 | -5.2 | -3.2 |
|
.. not available for a specific reference period Source: Statistics Canada, Tables 18-10-0254-01, Wholesale services price index, quarterly, 18-10-0037-01, wholesale services price index, monthly, inactive and 18-10-0032-01, industrial product price index, by industry, monthly. |
|||
Data table for Chart 3
| Index | Year-over-year change | |
|---|---|---|
| (2013=100) | percent | |
| 2008 | ||
| Quarter 1 | 87.0 | 0.6 |
| Quarter 2 | 88.3 | -0.2 |
| Quarter 3 | 85.9 | -0.5 |
| Quarter 4 | 87.8 | 3.8 |
| 2009 | ||
| Quarter 1 | 89.3 | 2.6 |
| Quarter 2 | 92.8 | 5.1 |
| Quarter 3 | 94.1 | 9.5 |
| Quarter 4 | 94.7 | 7.9 |
| 2010 | ||
| Quarter 1 | 94.3 | 5.6 |
| Quarter 2 | 94.7 | 2.0 |
| Quarter 3 | 97.3 | 3.4 |
| Quarter 4 | 97.5 | 3.0 |
| 2011 | ||
| Quarter 1 | 99.1 | 5.1 |
| Quarter 2 | 96.0 | 1.4 |
| Quarter 3 | 96.5 | -0.8 |
| Quarter 4 | 96.0 | -1.5 |
| 2012 | ||
| Quarter 1 | 97.7 | -1.4 |
| Quarter 2 | 99.7 | 3.9 |
| Quarter 3 | 99.7 | 3.3 |
| Quarter 4 | 98.4 | 2.5 |
| 2013 | ||
| Quarter 1 | 98.8 | 1.1 |
| Quarter 2 | 99.1 | -0.6 |
| Quarter 3 | 100.4 | 0.7 |
| Quarter 4 | 101.7 | 3.4 |
| 2014 | ||
| Quarter 1 | 103.5 | 4.8 |
| Quarter 2 | 107.1 | 8.1 |
| Quarter 3 | 105.0 | 4.6 |
| Quarter 4 | 108.9 | 7.1 |
| 2015 | ||
| Quarter 1 | 110.3 | 6.6 |
| Quarter 2 | 111.7 | 4.3 |
| Quarter 3 | 113.5 | 8.1 |
| Quarter 4 | 115.0 | 5.6 |
| 2016 | ||
| Quarter 1 | 118.5 | 7.4 |
| Quarter 2 | 117.2 | 4.9 |
| Quarter 3 | 121.3 | 6.9 |
| Quarter 4 | 122.6 | 6.6 |
| 2017 | ||
| Quarter 1 | 121.8 | 2.8 |
| Quarter 2 | 126.2 | 7.7 |
| Quarter 3 | 124.3 | 2.5 |
| Quarter 4 | 127.7 | 4.2 |
| 2018 | ||
| Quarter 1 | 125.8 | 3.3 |
| Quarter 2 | 124.7 | -1.2 |
| Quarter 3 | 121.5 | -2.3 |
| Quarter 4 | 122.4 | -4.2 |
| 2019 | ||
| Quarter 1 | 120.8 | -4.0 |
| Quarter 2 | 119.9 | -3.8 |
| Quarter 3 | 121.1 | -0.3 |
| Quarter 4 | 122.6 | 0.2 |
| Source: Statistics Canada, Tables 18-10-0254-01, Wholesale services price index, quarterly and 18-10-0037-01, wholesale services price index, monthly, inactive. | ||
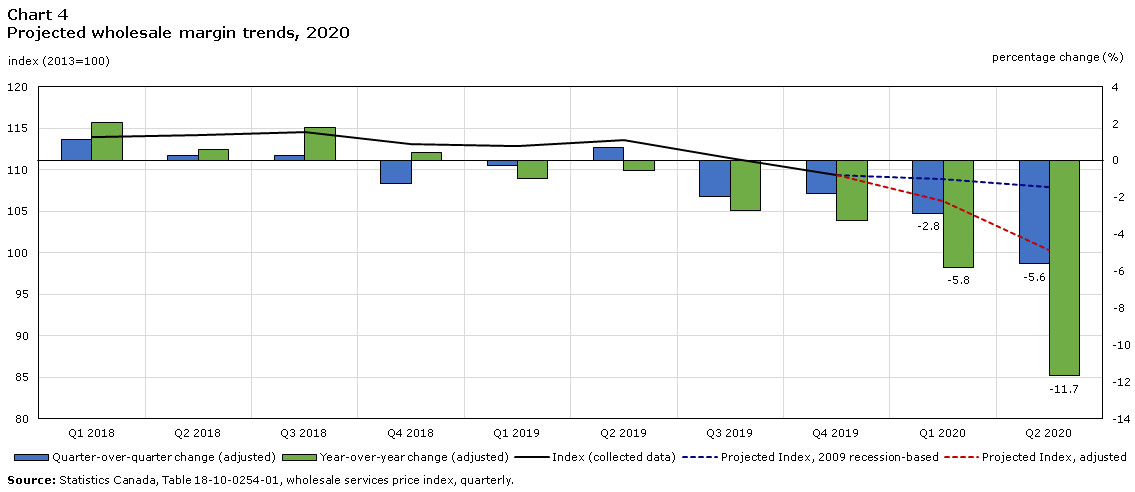
2020 WSPI Margins Outlook
Wholesale margins are expected to decline more in 2020 than in 2009 as COVID-19 containment measures are predicted to lead to significant reductions in economic activity, supply chain disruptions and increased costs for manufacturers and processors.
Most of the impact will be felt in Q2 2020. Subsector trends may vary significantly depending on different containment measures in response to the COVID-19 pandemic.
Data table for Chart 4
| Index (collected data) | Projected Index, 2009 recession-based | Projected Index, adjusted | Quarter-over-quarter change (adjusted) | Year-over-year change (adjusted) | |
|---|---|---|---|---|---|
| (2013=100) | percent | ||||
| 2018 | |||||
| Quarter 1 | 113.9 | Note ..: not available for a specific reference period | Note ..: not available for a specific reference period | 1.2 | 2.1 |
| Quarter 2 | 114.2 | Note ..: not available for a specific reference period | Note ..: not available for a specific reference period | 0.3 | 0.6 |
| Quarter 3 | 114.5 | Note ..: not available for a specific reference period | Note ..: not available for a specific reference period | 0.3 | 1.8 |
| Quarter 4 | 113.1 | Note ..: not available for a specific reference period | Note ..: not available for a specific reference period | -1.2 | 0.4 |
| 2019 | |||||
| Quarter 1 | 112.8 | Note ..: not available for a specific reference period | Note ..: not available for a specific reference period | -0.3 | -1.0 |
| Quarter 2 | 113.6 | Note ..: not available for a specific reference period | Note ..: not available for a specific reference period | 0.7 | -0.5 |
| Quarter 3 | 111.4 | Note ..: not available for a specific reference period | Note ..: not available for a specific reference period | -1.9 | -2.7 |
| Quarter 4 | 109.4 | Note ..: not available for a specific reference period | Note ..: not available for a specific reference period | -1.8 | -3.3 |
| 2020 | |||||
| Quarter 1 | Note ..: not available for a specific reference period | 108.9 | 106.3 | -2.8 | -5.8 |
| Quarter 2 | Note ..: not available for a specific reference period | 107.9 | 100.4 | -5.6 | -11.7 |
|
.. not available for a specific reference period Source: Statistics Canada, Table 18-10-0254-01, wholesale services price index, quarterly. |
|||||
Start of text box
Quarter 1 2020
- Quarter-over-quarter (%): ↓[-0.5 , -2.8]
- Year-over-year (%): ↓[-3.5 , -5.8]
Quarter 2 2020
- Quarter-over-quarter (%): ↓[-0.9 , -5.6]
- Year-over-year (%): ↓[-5.0 , -11.7]
Petroleum and petroleum products merchant wholesalers
- Crude prices expected to remain low, due to reduced world demand.
- Petroleum margins are very volatile but can be expected to decline overall, as production cost is above selling prices.
Food, beverage and tobacco merchant wholesalers
- Prices are expected to continue rising into 2020.
- Margins expected to rise overall, bringing year-over-year movements back into positive territory, after declines in 2018 and 2019.
End of text box
Methodology
The 2009 economic recession serves as the benchmark of the impact analysis. The response pattern of WSPI to the 2009 recession were used to project Q1 and Q2 2020 estimates. Subject-matter analysts also applied adjustments taking into account the 2020 GDP forecast and economic conditions under COVID-19 pandemic.
Contact information
For more information, or to enquire about the concepts, methods or data quality of this release, contact us (toll-free 1-800-263-1136; 514-283-8300; infostats@statcan.gc.ca) or Media Relations (613-951-4636; mediahotline@statcan.gc.ca).
- Date modified: