
 StatCan COVID-19: Data to Insights for a Better Canada Trade in medical and protective goods, April 2020

Archived Content
Information identified as archived is provided for reference, research or recordkeeping purposes. It is not subject to the Government of Canada Web Standards and has not been altered or updated since it was archived. Please "contact us" to request a format other than those available.
Text begins
As an update to Trade in medical and protective goods recently published by Statistics Canada, the current article provides an overview of Canada’s international merchandise trade in medical and protective goods including April reference month data with a particular focus on trade in personal protective equipment.
Imports of personal protective equipment surge in April 2020
Imports of personal protective equipment, and disinfectant and sterilization products increased in April, while medical equipment and products, and diagnostic products decreased. Imports in all categories were higher in April 2020 compared to the same month in 2019.
Imports of personal protective equipment rose 67.1% to $491 million in April, the steepest month-over-month increase in the past three years. Year-over-year imports were up 62.2%. Imports of face and eye protection surged in April, up $165 million to $200 million. The main contributor to this increase was higher imports of face masks of textile materials from China. Unit values for face and eye protection overall were lower than their average of the previous one-year period. For face masks of textile materials in particular, the unit value was 34.7% lower than the average of the past year.
Following two consecutive monthly decreases, imports of other protective equipment rose 20.0% in April to $248 million, the highest value since August 2019. Year-over-year, imports increased 8.0%. There were higher imports under a Harmonized System (HS) code that includes a variety of made up textile articles, including respirators to be employed in a noxious atmosphere. For January through March, the average value of imports of these articles was $5 million; in April, imports rose to $74 million, mainly from China. Typically, about half of these goods are imported from the United States and a third from China, with the remainder originating in numerous other countries. In comparison, in April 95% originated in China, and 4% from the United States.
Following a 47.2% increase in March, imports of gloves declined 17.0% to $43 million in April. Despite this monthly decrease, imports were 6.2% higher than in April 2019. Rubber surgical gloves, protective rubber gloves for use with protective suits employed in a noxious atmosphere, and other rubber gloves, mittens and mitts were behind the monthly fluctuations in imports.
| Monthly value (millions of dollars) | % change | ||||||
|---|---|---|---|---|---|---|---|
| April 2019 | February 2020 | March 2020 | April 2020 | March 2020 over February 2020 | April 2020 over March 2020 | April 2020 over April 2019 | |
| Total of all products | 2,204.9 | 2,147.0 | 2,514.2 | 2,614.4 | 17.1 | 4.0 | 18.6 |
| Disinfectant and Sterilization Products | 165.2 | 154.1 | 180.3 | 190.4 | 17.0 | 5.6 | 15.3 |
| Disinfectants and Sterilizers | 107.6 | 101.0 | 119.2 | 135.3 | 18.1 | 13.5 | 25.7 |
| Wipes | 57.6 | 53.1 | 61.1 | 55.1 | 15.0 | -9.7 | -4.2 |
| Personal Protective Equipment | 302.7 | 274.6 | 293.9 | 491.2 | 7.0 | 67.1 | 62.2 |
| Face and Eye Protection | 32.5 | 31.5 | 35.2 | 200.1 | 11.9 | 468.1 | 516.3 |
| Gloves | 40.8 | 35.4 | 52.2 | 43.3 | 47.2 | -17.0 | 6.2 |
| Other Protective Equipment | 229.5 | 207.6 | 206.5 | 247.8 | -0.6 | 20.0 | 8.0 |
| Medical Equipment and Products | 1,380.4 | 1,240.9 | 1,506.7 | 1,438.6 | 21.4 | -4.5 | 4.2 |
| Medical Consumables | 147.4 | 140.4 | 158.4 | 125.7 | 12.8 | -20.6 | -14.7 |
| Medical Devices | 234.8 | 231.9 | 279.5 | 220.1 | 20.5 | -21.2 | -6.2 |
| Medicaments | 967.3 | 845.9 | 1,033.8 | 1,066.2 | 22.2 | 3.1 | 10.2 |
| Oxygen Therapy | 31.0 | 22.6 | 35.0 | 26.5 | 55.0 | -24.2 | -14.4 |
| Diagnostic Products | 356.5 | 477.5 | 533.3 | 494.2 | 11.7 | -7.3 | 38.6 |
| Test Kits and Diagnostic Instruments | 344.6 | 465.9 | 520.4 | 480.7 | 11.7 | -7.6 | 39.5 |
| Thermometers | 11.9 | 11.6 | 12.9 | 13.5 | 11.5 | 4.4 | 13.7 |
Following an increase in March, imports of disinfectant and sterilization products rose 5.6% in April, on higher imports of disinfectants and sterilizers. Year-over-year imports were up 15.3%.
Imports of medical equipment and products declined 4.5% in April, following their typical seasonal pattern. Lower imports of medical devices, medical consumables, and oxygen therapy were partially offset by higher imports of medicaments.
In April, imports of diagnostic products decreased 7.3%, with lower imports of test kits and diagnostic instruments from Ireland and the United States. Imports of diagnostic products have shown continued strong year-over-year growth in the past three years.

Data table for Chart 1
| Month | Disinfectant and sterilization products | Personal protective equipment | Medical equipment and products | Diagnostic products |
|---|---|---|---|---|
| index (2018 average monthly import value = 100) | ||||
| 2019 | ||||
| January | 104 | 106 | 103 | 105 |
| February | 98 | 94 | 104 | 115 |
| March | 109 | 99 | 128 | 107 |
| April | 105 | 104 | 114 | 113 |
| May | 106 | 110 | 116 | 117 |
| June | 115 | 111 | 91 | 118 |
| July | 104 | 128 | 121 | 146 |
| August | 112 | 119 | 106 | 148 |
| September | 99 | 108 | 105 | 120 |
| October | 111 | 111 | 112 | 145 |
| November | 97 | 90 | 109 | 151 |
| December | 85 | 94 | 106 | 135 |
| 2020 | ||||
| January | 96 | 99 | 98 | 152 |
| February | 98 | 95 | 102 | 151 |
| March | 115 | 101 | 124 | 169 |
| April | 122 | 169 | 119 | 156 |
|
Source: Statistics Canada, Canadian International Merchandise Trade Program. |
||||
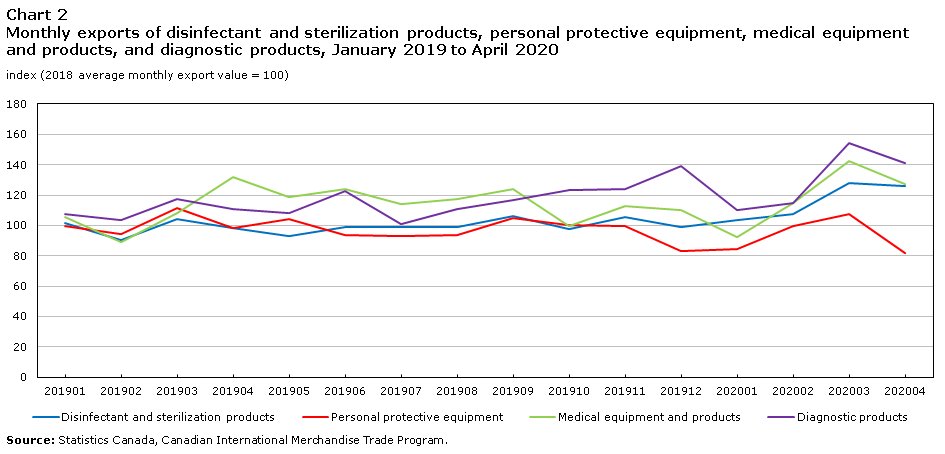
Medical and protective goods exports decline in April 2020 following increases in March
Exports of medical equipment and products, personal protective equipment, diagnostic products, and disinfectant and sterilization products declined in April, each having increased in March.
Following two consecutive monthly increases, exports of medical equipment and products decreased 10.6% to $1.1 billion in April. Year-over-year exports were down 3.2%. In April, there were lower exports of medicaments, medical devices, and medical consumables. Exports of medical consumables have been steadily decreasing over the past several months, particularly on a year-over-year basis. Partially offsetting the declines in this category, exports of oxygen therapy rose 27.8% in April and were higher year-over-year.
| Monthly value (millions of dollars) | % change | ||||||
|---|---|---|---|---|---|---|---|
| April 2019 | February 2020 | March 2020 | April 2020 | March 2020 over February 2020 | April 2020 over March 2020 | April 2020 over April 2019 | |
| Total of all products | 1,547.5 | 1,410.6 | 1,725.0 | 1,529.3 | 22.3 | -11.3 | -1.2 |
| Disinfectant and Sterilization Products | 84.4 | 92.3 | 109.7 | 107.9 | 18.9 | -1.7 | 27.8 |
| Disinfectants and Sterilizers | 68.5 | 75.2 | 89.0 | 92.4 | 18.4 | 3.9 | 34.9 |
| Wipes | 15.9 | 17.1 | 20.7 | 15.4 | 21.2 | -25.6 | -3.2 |
| Personal Protective Equipment | 180.9 | 183.3 | 197.6 | 151.1 | 7.8 | -23.5 | -16.5 |
| Face and Eye Protection | 26.7 | 28.2 | 30.0 | 36.5 | 6.4 | 21.5 | 36.5 |
| Gloves | 4.8 | 6.1 | 5.1 | 6.8 | -16.9 | 34.6 | 43.7 |
| Other Protective Equipment | 149.5 | 149.0 | 162.5 | 107.8 | 9.0 | -33.6 | -27.9 |
| Medical Equipment and Products | 1,185.6 | 1,034.8 | 1,283.5 | 1,147.3 | 24.0 | -10.6 | -3.2 |
| Medical Consumables | 90.9 | 27.9 | 29.8 | 29.5 | 6.6 | -1.1 | -67.6 |
| Medical Devices | 114.9 | 153.3 | 175.5 | 132.5 | 14.5 | -24.5 | 15.3 |
| Medicaments | 967.0 | 841.3 | 1,064.8 | 968.2 | 26.6 | -9.1 | 0.1 |
| Oxygen Therapy | 12.7 | 12.3 | 13.5 | 17.2 | 9.5 | 27.8 | 35.1 |
| Diagnostic Products | 96.5 | 100.1 | 134.1 | 123.0 | 34.0 | -8.3 | 27.4 |
| Test Kits and Diagnostic Instruments | 91.1 | 94.0 | 127.9 | 116.3 | 36.1 | -9.1 | 27.6 |
| Thermometers | 5.4 | 6.1 | 6.2 | 6.7 | 2.4 | 7.7 | 24.0 |
Exports of personal protective equipment declined 23.5% in April and were 16.5% lower year-over-year. Lower exports of other protective equipment were partially offset by higher exports of face and eye protection, and gloves, mainly to the United States.
Following an increase in March, exports of diagnostic products fell 8.3% in April, but were up year-over-year on higher exports of test kits and diagnostic instruments, and thermometers.
Exports of disinfectant and sterilization products decreased 1.7% in April, following three consecutive monthly increases. Despite the monthly decline, exports in April were higher than in the same month in 2019.
Data table for Chart 2
| Month | Disinfectant and sterilization products | Personal protective equipment | Medical equipment and products | Diagnostic products |
|---|---|---|---|---|
| index (2018 average monthly import value = 100) | ||||
| 2019 | ||||
| January | 101 | 100 | 106 | 107 |
| February | 91 | 95 | 89 | 104 |
| March | 104 | 111 | 108 | 117 |
| April | 98 | 98 | 132 | 111 |
| May | 93 | 104 | 119 | 108 |
| June | 99 | 94 | 124 | 123 |
| July | 99 | 93 | 114 | 101 |
| August | 99 | 94 | 117 | 111 |
| September | 106 | 105 | 124 | 117 |
| October | 97 | 100 | 100 | 123 |
| November | 105 | 99 | 113 | 124 |
| December | 99 | 83 | 110 | 139 |
| 2020 | ||||
| January | 104 | 84 | 92 | 110 |
| February | 108 | 99 | 115 | 115 |
| March | 128 | 107 | 142 | 154 |
| April | 126 | 82 | 127 | 141 |
|
Source: Statistics Canada, Canadian International Merchandise Trade Program. |
||||
Methodology
The data in the analysis are on a customs basis and are not seasonally adjusted.
Unit values are calculated by dividing the value by the quantity of Harmonized System (HS) codes that require units of measure in the Customs Tariff and the Canadian Export Classification. They provide some insight into the price charged or paid per item. They reflect the mix of items that happen to be traded under an HS code within that particular month. The mix of goods traded under an HS code can change from month to month, which will impact the unit value. For example, an HS code for masks could reflect trade in high quality medical masks in one month, then in the following month reflect a shift towards trade in less expensive paper masks. In this case, the unit price will go down from one month to the next as a result of a change in the product mix as opposed to change in the price paid for the goods.
Additionally, while quantity data undergo quality assurance processing and review, it is possible that aggregate quantities may include inaccurately reported data and therefore some caution needs to be used in interpreting average unit prices. It is also possible that the import price does not reflect the price paid by government authorities or hospitals, as the import may have been arranged by a wholesaler or an intermediary.
In general, the value for duty of imported goods must be equivalent to the transaction value or the price actually paid. The transaction value of imported goods includes all transportation and associated costs incurred up to the point of direct shipment to Canada. Therefore, Canada's imports are valued Free on Board (FOB), place of direct shipment to Canada. It excludes freight and insurance costs in bringing the goods to Canada from the point of direct shipment.
Canada's exports are valued at FOB place of exit, including domestic freight charges to that point but net of discounts and allowances.
The categorization of goods used in this article was developed by Statistics Canada for the purpose of analysis. It was developed based on the Harmonized System (HS) classification guidelines produced by the World Customs Organization and the World Health Organization. The Canadian Border Services Agency’s Customs Notice 20-12, outlining applicable HS codes that can be used for the importation of such goods into Canada, was also considered in the development of these categories.
Note that many of the HS codes are broadly defined and therefore may include goods unrelated to the category into which they are placed. Additionally, data for trade under these categories may include goods that were not relevant to trade in response to the COVID-19 pandemic.
Note
The source of these data is the Canadian International Merchandise Trade Program. Customs basis, not seasonally adjusted data by HS classification at the 6-digit level and country are available in the Canadian International Merchandise Trade database (table 65F0013X). Data at the 8-digit level for exports and 10-digit level for imports are available upon request.
- Date modified: