
 StatCan COVID-19: Data to Insights for a Better CanadaThe impact of COVID-19 on the gig economy: Short- and long-term concerns

Archived Content
Information identified as archived is provided for reference, research or recordkeeping purposes. It is not subject to the Government of Canada Web Standards and has not been altered or updated since it was archived. Please "contact us" to request a format other than those available.
by Sung-Hee Jeon and Yuri Ostrovsky
A recent study (Jeon et al. 2019) revealed several important aspects of the gig economy in Canada. The study found that gig workers (GW)—self-employed freelancers, on-demand online workers and day labourers—represented about 8%-10% of all Canadian workers in 2016, and were about equally split between those who did gig work to supplement their wage employment and those who did not earn any wages or salaries and therefore relied primarily on their gig earnings. The gig earnings of the majority of GWs did not exceed five thousand dollars per year. Yet, for more than a quarter of GWs, their gig earnings represented all their annual earnings and more than 89% of their total annual income.
The study also highlighted various methodological uncertainties and the lack of necessary up-to-date data that would allow for tracking the gig economy in real time.Note This problem became particularly acute during the current COVID-19 pandemic. Despite the significant share of GWs in the Canadian labour force, the impact of the COVID-19 pandemic on them is very difficult to assess because GWs cannot be identified in any of the main sources of employment data. Unlike traditional wage employees, GWs enter various non-standard work arrangements to complete specific tasks or work for a specific period of time and, therefore, their work loss is not captured by standard employment or wage indicators.
The more immediate impact of COVID-19 on the financial well-being of GWs will likely depend on their characteristics such as age, place of residence, and the industry of their work. For instance, gig income is not the main income source for pension age GWs, and its loss will likely be mitigated by the continuing receipt of pension benefits. For young and prime working age GWs, the income loss is likely to be far more consequential. As self-employed, GWs with no paid employment (about half of all GWs) are ineligible for regular EI benefits and, despite the existence of EI special benefits for self-employed people (e.g., parental and sickness benefits), very few GWs may be eligible for such benefits during the COVID-19 pandemic. However, GWs who earned $5,000 or more in 2019 should be eligible for Canada Emergency Response Benefits ($500 a week).Note
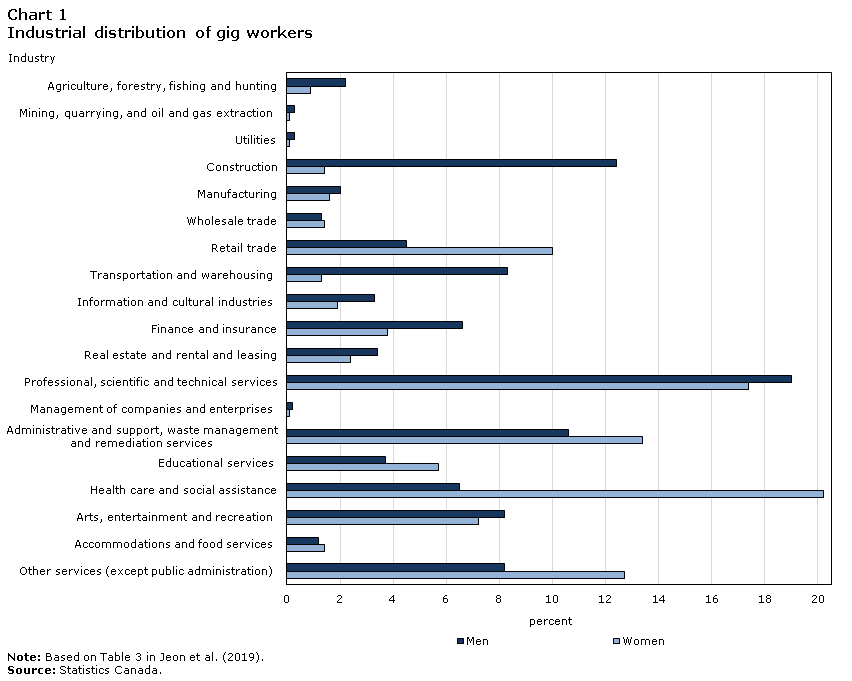
Much will depend on the nature of the gig work. Jeon et al. (2019) showed that about 19.0% of male GWs and 17.4% of female GWs provided professional, scientific and technical services (Chart 1). Many of these individuals may be able to continue to provide such services even in the present economic environment. In contrast, many GWs in arts and entertainment (8.2% of male GWs and 7.2% of female GWs) may find it considerably more difficult to continue their business activities as social distancing is likely to remain in place for some time. GWs in service industries that require face-to-face interactions with customers will have a harder time dealing with the economic fallout of the COVID-19 pandemic than GWs employed in other industries. Male GWs in transportation (8.3% of all male GWs), a substantial share of whom are Uber and Lyft partners, may be unable to continue their work either because these companies limit their operations or because of the reduction in the number of riders. Similar challenges are faced by female GWs in retail trade (10.0% of all female GWs), administrative and support services (e.g., tour operators, providers of cleaning services) (13.4%), and other services (e.g., cooks, maids, nannies) (12.7%)—the industries representing more than a third of all female GWs and experiencing large employment losses (Statistics Canada, 2020).Note
Data table for Chart 1
| 2-digit NAICS industry | Men | Women |
|---|---|---|
| percent | ||
| Agriculture, forestry, fishing and hunting | 2.2 | 0.9 |
| Mining, quarrying, and oil and gas extraction | 0.3 | 0.1 |
| Utilities | 0.3 | 0.1 |
| Construction | 12.4 | 1.4 |
| Manufacturing | 2.0 | 1.6 |
| Wholesale trade | 1.3 | 1.4 |
| Retail trade | 4.5 | 10.0 |
| Transportation and warehousing | 8.3 | 1.3 |
| Information and cultural industries | 3.3 | 1.9 |
| Finance and insurance | 6.6 | 3.8 |
| Real estate and rental and leasing | 3.4 | 2.4 |
| Professional, scientific and technical services | 19.0 | 17.4 |
| Management of companies and enterprises | 0.2 | 0.1 |
| Administrative and support, waste management and remediation services |
10.6 | 13.4 |
| Educational services | 3.7 | 5.7 |
| Health care and social assistance | 6.5 | 20.2 |
| Arts, entertainment and recreation | 8.2 | 7.2 |
| Accommodations and food services | 1.2 | 1.4 |
| Other services (except public administration) | 8.2 | 12.7 |
|
Note: Based on Table 3 in Jeon et al. (2019). Source: Statistics Canada. |
||
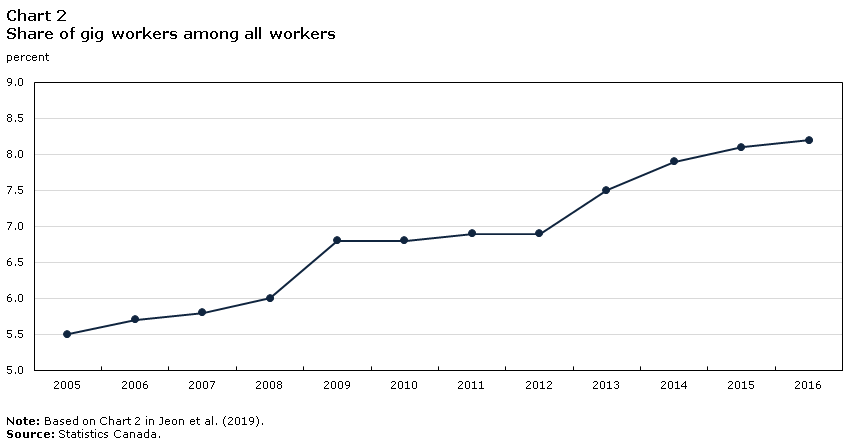
In addition to the short-term concerns, there are important questions related to how the gig economy will evolve in the aftermath of the COVID-19 pandemic. Jeon et al. (2019) showed that the size of the gig economy increased from 6.0% in 2008 to 6.8% in 2009 as some of those who lost their wage employment during the recession were “pushed” into self-employment (Chart 2). Whether a similar trend will occur in the aftermath of the COVID-19 pandemic will likely depend on the speed and intensity of the post-COVID-19 overall economic recovery. Another important question is whether the current pandemic will facilitate the expansion of online platforms and crowdsourcing marketplaces potentially leading to the increase in the size of the gig economy. The size of the gig economy increased rapidly at the time of the proliferation of online platforms in Canada in the early 2010s (from 6.9% in 2012 to 7.5% in 2013) but the rate of growth declined in the following years (Chart 2). The main challenge for analysts in the coming years is to continue to improve the methodology and timeliness of measuring the gig economy in Canada and assessing the financial well-being of GWs and their families.
Data table for Chart 2
| Year | Percentage |
|---|---|
| 2005 | 5.5 |
| 2006 | 5.7 |
| 2007 | 5.8 |
| 2008 | 6.0 |
| 2009 | 6.8 |
| 2010 | 6.8 |
| 2011 | 6.9 |
| 2012 | 6.9 |
| 2013 | 7.5 |
| 2014 | 7.9 |
| 2015 | 8.1 |
| 2016 | 8.2 |
|
Note: Based on Chart 2 in Jeon et al. (2019). Source: Statistics Canada. |
|
References
Jeon, S.-H., Huju Liu and Yuri Ostrovsky (2019). Measuring the Gig Economy in Canada using Administrative Data. Analytical Studies Branch Research Paper Series. Catalogue number: 11F0019M No. 437. Ottawa: Statistics Canada.
Statistics Canada (2020). “Labour Force Survey, April 2020.” The Daily. Ottawa: Statistics Canada. Accessed on May 8, 2020.
Related articles
Jeon, S.-H., Huju Liu and Yuri Ostrovsky (2019). Measuring the Gig Economy in Canada using Administrative Data. Analytical Studies Branch Research Paper Series. Catalogue number: 11F0019M No. 437. Ottawa: Statistics Canada.
- Date modified: