
 StatCan COVID-19: Data to Insights for a Better CanadaCOVID-19 pandemic: People unable to converse in English or French

Archived Content
Information identified as archived is provided for reference, research or recordkeeping purposes. It is not subject to the Government of Canada Web Standards and has not been altered or updated since it was archived. Please "contact us" to request a format other than those available.
by Nicolas Bastien and Étienne Lemyre
In light of the current COVID-19 pandemic, it is essential that public health authorities be able to share information with the public. However, there are people who cannot understand this information because they don’t know English or French. Most of them can probably rely on relatives, family members or friends to help them during the pandemic but, due to physical distancing restrictions, many may have limited access to those who can help them interpret the information provided by the public health authorities.
In 2016, 649,000 people, or 1.9% of the Canadian population, reported being unable to conduct a conversation in English or French. High levels of immigration since the 2016 Census may have contributed to a higher number of people who don’t know English or French at the moment.
In 2016, close to three-quarters lived in Ontario (50.4%) or British Columbia (23.7%) (Table 1). Most of the people who could not conduct a conversation in English or French were older adults (40.1% were 65 years or older) or preschool children (aged 0 to 4: 15.3%). Moreover, women were overrepresented (59.0%) among this population.
| Province | Population | Breakdown by province |
|---|---|---|
| number | percent | |
| Newfoundland and Labrador | 815 | 0.1 |
| Prince Edward Island | 1,250 | 0.2 |
| Nova Scotia | 2,730 | 0.4 |
| New Brunswick | 2,370 | 0.4 |
| Quebec | 75,060 | 11.6 |
| Ontario | 326,935 | 50.4 |
| Manitoba | 16,285 | 2.5 |
| Saskatchewan | 7,945 | 1.2 |
| Alberta | 59,280 | 9.1 |
| British Columbia | 153,905 | 23.7 |
| Yukon | 140 | 0.0 |
| Northwest Territories | 195 | 0.0 |
| Nunavut | 2,045 | 0.3 |
| Total | 648,955 | 100.0 |
| Source: Statistics Canada. Census of population, 2016. Table 98-400-X2016054. | ||
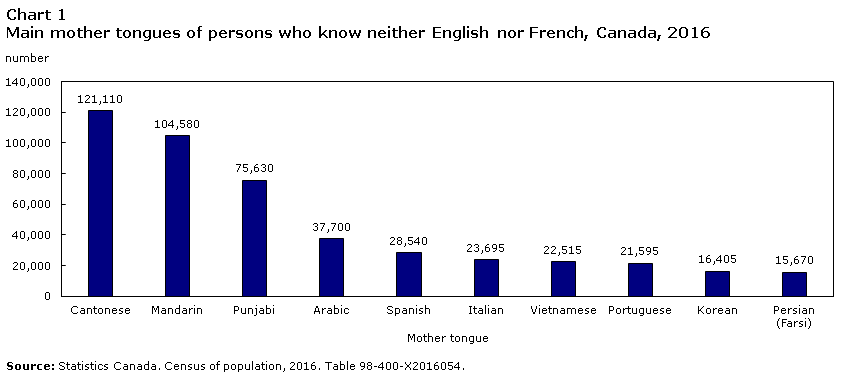
The main mother tongues of these individuals were Cantonese, Mandarin, Punjabi, Arabic, Spanish, Italian, Vietnamese, Portuguese, Korean and Persian (Farsi) (Chart 1). Of the people who reported being unable to conduct a conversation in English or French, 37.5% had a Chinese language as their mother tongue.
Data table for Chart 1
| Mother tongue | Population who knows neither English nor French |
|---|---|
| number | |
| Cantonese | 121,110 |
| Mandarin | 104,580 |
| Punjabi | 75,630 |
| Arabic | 37,700 |
| Spanish | 28,540 |
| Italian | 23,695 |
| Vietnamese | 22,515 |
| Portuguese | 21,595 |
| Korean | 16,405 |
| Persian (Farsi) | 15,670 |
| Source: Statistics Canada. Census of population, 2016. Table 98-400-X2016054. | |
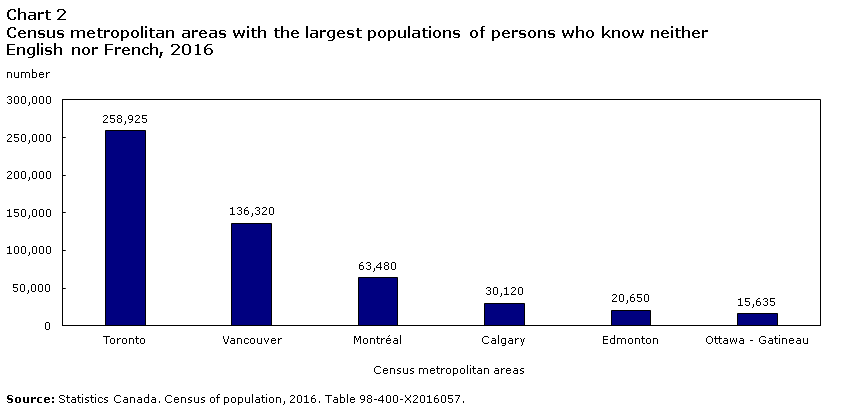
In 2016, the population with no knowledge of English or French was primarily found in large cities. There were six census metropolitan areas (CMAs) with at least 15,000 people who knew neither official language (Chart 2). Of these, the Vancouver (5.6%) and Toronto (4.4%) CMAs had relatively high shares of people in this situation.
Data table for Chart 2
| Census metropolitan areas | Population who knows neither English nor French |
|---|---|
| number | |
| Toronto | 258,925 |
| Vancouver | 136,320 |
| Montréal | 63,480 |
| Calgary | 30,120 |
| Edmonton | 20,650 |
| Ottawa - Gatineau | 15,635 |
| Source: Statistics Canada. Census of population, 2016. Table 98-400-X2016057. | |
In the Toronto CMA in 2016, the number of people who knew neither English nor French was somewhat higher in the municipality of Markham, in the northern part of Scarborough (Scarborough–Agincourt and Scarborough North wards), and in Chinatown (Spadina–Fort York and University–Rosedale wards) (Map 1). In several census tracts in these areas, people who could not conduct a conversation in English or French made up over 15% of the total population.
In the Vancouver CMA, this population was higher in the municipalities of Richmond and Surrey and in East Vancouver neighbourhoods (Hastings-Sunrise, Kensington-Cedar Cottage, Renfrew-Collingwood, Victoria-Fraserview and Killarney).
In the Montréal CMA, they lived mainly in the Villeray–Saint-Michel–Parc-Extension borough and in the Chinatown area of the Ville-Marie borough.

Description of Map 1
This map shows the percentage of the population who does not know English or French in each census tract of the Montréal, Toronto and Vancouver census metropolitan areas.
On this map, we use six colours to differentiate the values. Light grey represents census tracts for which no data are available. In this group, there are 19 census tracts in the Montréal census metropolitan area, 3 census tracts in the Toronto census metropolitan area, and 6 census tracts in the Vancouver census metropolitan area.
Yellow represents census tracts where less than 1% of the total population did not know English or French. In this group, there are 493 census tracts in the Montréal census metropolitan area, 158 census tracts in the Toronto census metropolitan area, and 68 census tracts in the Vancouver census metropolitan area.
Light green identifies census tracts where between 1% to less than 2% of the total population knows neither English nor French. In this group, there are 202 census tracts in the Montréal census metropolitan area, 214 census tracts in the Toronto census metropolitan area, and 79 census tracts in the Vancouver census metropolitan area.
Dark green represents census tracts where between 2% to less than 5% of the total population did not know English or French. In this group, there are 196 census tracts in the Montréal census metropolitan area, 436 census tracts in the Toronto census metropolitan area, and 110 census tracts in the Vancouver census metropolitan area.
Light blue identifies census tracts where between 5% to less than 10% of the total population did not know English or French. In this group, there are 54 census tracts in the Montréal census metropolitan area, 261 census tracts in the Toronto census metropolitan area, and 145 census tracts in the Vancouver census metropolitan area.
Dark blue represents census tracts where 10% or more of the total population do not know English or French. In this group, there are 6 census tracts in the Montréal census metropolitan area, 79 census tracts in the Toronto census metropolitan area, and 70 census tracts in the Vancouver census metropolitan area.
The borders of each census subdivision are delineated by a grey line. The borders of each borough in Montréal, ward in Toronto and neighbourhood in Vancouver are delineated by a red line.
Each census tract is assigned a colour based on the table below.
Most people who reported being unable to conduct a conversation in English or French lived in a household where at least one member spoke at least one of Canada’s two official languages. However, in 2016, over a quarter of this population, or nearly 175,000 people, lived in a private household where no one aged 15 years or older could conduct a conversation in English or French. These people may be particularly vulnerable in a pandemic if they are unable to understand the information provided by the public health authorities.
In 2016, 88,000 households in Canada were in this situation, and there were children under 18 years of age in 17.0% of those households. However, three-quarters of these households were made up of women living alone (34.3%), couples without children (30.2%), or men living alone (11.5%). In more than half of these households (56.0%), all occupants were aged 65 years or older.
Data sources
The data in this article are taken from 100% 2016 Census data. The data on people are from tables 98-400-X2016054 and 98-400-X2016057. Household data cover private households, excluding those enumerated abroad, where no one aged 15 years or older can conduct a conversation in English or French.
References
Additional data tables on the people who cannot conduct a conversation in English or French can be found on this page: 2016 Census data tables – language.
Additional information on people who cannot conduct a conversation in English or French can also be found in Immigration and language in Canada, 2011 and 2016. This document presents a broad statistical portrait of immigrants using certain language characteristics as well as the main countries of birth, for each province and territory and the six largest CMAs.
- Date modified: