
 StatCan COVID-19: Data to Insights for a Better CanadaTrade in medical and protective goods

Archived Content
Information identified as archived is provided for reference, research or recordkeeping purposes. It is not subject to the Government of Canada Web Standards and has not been altered or updated since it was archived. Please "contact us" to request a format other than those available.
Statistics Canada is monitoring the impact of the COVID-19 pandemic on Canada’s international merchandise trade statistics. There is particular interest in trade in products required for the prevention, testing and treatment of the illness, such as disinfectants and sterilization products, personal protective equipment, medical equipment and products, and diagnostic products.
A review of recent trends in exports and imports of these goods provides a basis for understanding the potential impact of the pandemic on Canada’s international merchandise trade. To this end, Statistics Canada has produced a special data compilation to examine trade in specific categories of relevant products.
The period of review for this analysis is January 2017 to March 2020; the data are on a customs basis and are not seasonally adjusted. Monthly movements in trade can result from seasonal factors, therefore the focus in the current analysis is on year-to-date data (in this case, comparing January to March aggregate values from this year to previous years). Monthly trade values are included where relevant.
Exports of medical and protective goods rise in 2020
Year-to-date exports of medical equipment and products, diagnostic products, and disinfectants and sterilization products rose notably in 2020, while personal protective equipment exports were down in comparison to the first quarter of 2019.
| January 2020 | February 2020 | March 2020 | January to February | February to March | 2019 | 2020 | 2019 to 2020 | |
|---|---|---|---|---|---|---|---|---|
| monthly value (millions of dollars) | % change | year-to-date value (millions of dollars) | % change | |||||
| Total of all products | 1,169.9 | 1,407.3 | 1,724.7 | 20.3 | 22.5 | 3,827.7 | 4,301.9 | 12.4 |
| Disinfectants and sterilization products | 88.9 | 91.9 | 109.7 | 3.3 | 19.4 | 253.9 | 290.5 | 14.4 |
| Disinfectants and sterilizers | 72.2 | 74.8 | 89.0 | 3.6 | 18.9 | 205.8 | 235.9 | 14.6 |
| Wipes | 16.7 | 17.1 | 20.7 | 2.0 | 21.4 | 48.1 | 54.6 | 13.4 |
| Personal protective equipment | 155.1 | 182.8 | 197.5 | 17.9 | 8.0 | 563.2 | 535.4 | -4.9 |
| Face and eye protection | 22.9 | 27.9 | 30.0 | 21.7 | 7.4 | 78.2 | 80.8 | 3.4 |
| Gloves | 3.0 | 6.1 | 5.1 | 104.8 | -16.8 | 15.4 | 14.2 | -8.0 |
| Other protective equipment | 129.2 | 148.8 | 162.4 | 15.2 | 9.1 | 469.6 | 440.4 | -6.2 |
| Medical equipment and products | 829.9 | 1,033.2 | 1,283.5 | 24.5 | 24.2 | 2,724.4 | 3,146.6 | 15.5 |
| Medical consumables | 29.6 | 27.9 | 29.8 | -5.8 | 6.8 | 210.8 | 87.3 | -58.6 |
| Medical devices | 157.4 | 152.8 | 175.5 | -2.9 | 14.9 | 345.4 | 485.7 | 40.6 |
| Medicaments | 629.8 | 840.2 | 1,064.7 | 33.4 | 26.7 | 2,131.1 | 2,534.7 | 18.9 |
| Oxygen therapy | 13.2 | 12.3 | 13.5 | -6.8 | 9.5 | 37.1 | 39.0 | 5.0 |
| Diagnostic products | 96.0 | 99.5 | 134.0 | 3.6 | 34.8 | 286.2 | 329.4 | 15.1 |
| Test kits and diagnostic instruments | 90.5 | 93.5 | 127.8 | 3.4 | 36.6 | 268.0 | 311.8 | 16.4 |
| Thermometers | 5.5 | 5.9 | 6.2 | 7.6 | 5.0 | 18.2 | 17.6 | -3.2 |
In 2020, year-to-date exports of medical equipment and products rose 15.5% to $3.1 billion, the highest quarterly value since the third quarter of 2019. Exports were mainly destined for the United States and Italy. Exports rose 24.2% to $1.3 billion in March. In the first quarter of 2020, there were higher exports of medicaments, medical devices, and oxygen therapy, which were partially offset by lower exports of medical consumables. Exports of medicaments rose on increases in medicaments containing antibiotics to the United States as well as other unclassified medicaments to Italy. For medical devices, there were higher exports of instruments and appliances used in medical or veterinary sciences to the United States and the Netherlands. The decline in medical consumables was mainly the result of lower exports of needles, catheters, cannulae and the like to the United States and the Netherlands.
Year-to-date exports of diagnostic products were up 15.1% to $329 million in 2020. In March, exports were up 34.8% to reach $134 million. Year-to-date exports of test kits and diagnostic instruments increased 16.4% in 2020.
Exports of disinfectants and sterilization products increased 14.4% to $291 million in the first quarter of 2020 in comparison with the same period in 2019. In 2020, exports rose each month of the first quarter, most notably in March, up 19.4% to $110 million. During this period, there were higher exports of disinfectants and sterilizers to the United States and China, and wipes to the United States.
In contrast, personal protective equipment exports declined 4.9% to $535 million year-to-date in 2020. Lower exports to the United States (-$25.1 million) were moderated by an increase in exports to China (+$7.7 million). While exports increased each month during the quarter, monthly values were lower than those in early 2019. Exports of other protective equipment (-6.2%) and gloves (-8.0%) decreased, while face and eye protection (+3.4%) increased.

Data table for Chart 1
| Month | Disinfectant and sterilization products | Personal protective equipment | Medical equipment and products | Diagnostic products |
|---|---|---|---|---|
| dollars | ||||
| 201701 | 74,261,301 | 157,994,161 | 823,774,865 | 70,469,293 |
| 201702 | 76,842,623 | 153,338,185 | 607,468,261 | 67,314,751 |
| 201703 | 103,590,053 | 180,436,883 | 797,767,986 | 86,505,814 |
| 201704 | 79,409,633 | 174,374,453 | 615,977,194 | 78,412,245 |
| 201705 | 80,693,544 | 184,379,497 | 697,202,278 | 98,174,327 |
| 201706 | 81,681,120 | 195,822,688 | 730,451,443 | 88,100,906 |
| 201707 | 90,917,317 | 166,594,074 | 633,411,573 | 78,337,607 |
| 201708 | 77,308,397 | 169,112,813 | 611,623,801 | 72,735,918 |
| 201709 | 82,541,223 | 181,318,087 | 773,857,713 | 83,838,690 |
| 201710 | 78,970,765 | 186,666,900 | 769,062,026 | 80,273,312 |
| 201711 | 85,543,175 | 187,707,882 | 869,320,559 | 81,207,575 |
| 201712 | 74,485,360 | 155,125,321 | 713,503,169 | 82,886,502 |
| 201801 | 74,426,829 | 168,506,271 | 745,033,960 | 76,770,360 |
| 201802 | 74,178,524 | 167,554,667 | 786,519,721 | 71,212,197 |
| 201803 | 91,096,823 | 189,694,922 | 843,765,401 | 92,389,634 |
| 201804 | 87,057,243 | 184,221,160 | 923,039,886 | 81,096,710 |
| 201805 | 85,042,562 | 195,542,944 | 880,791,443 | 83,648,003 |
| 201806 | 87,338,989 | 186,604,898 | 993,381,155 | 102,646,576 |
| 201807 | 83,958,073 | 181,364,246 | 897,133,147 | 92,852,688 |
| 201808 | 98,685,960 | 186,055,793 | 922,430,156 | 76,216,301 |
| 201809 | 77,910,234 | 195,034,868 | 896,002,773 | 92,214,779 |
| 201810 | 88,046,409 | 203,187,804 | 1,045,665,369 | 90,376,799 |
| 201811 | 87,390,492 | 189,029,739 | 1,001,716,305 | 92,962,035 |
| 201812 | 94,500,285 | 164,950,901 | 873,717,999 | 92,908,414 |
| 201901 | 87,056,719 | 184,098,766 | 952,818,584 | 93,572,784 |
| 201902 | 77,662,326 | 174,182,638 | 799,660,117 | 90,366,868 |
| 201903 | 89,204,397 | 204,883,380 | 971,936,470 | 102,225,702 |
| 201904 | 84,437,642 | 180,927,813 | 1,185,563,620 | 96,537,117 |
| 201905 | 79,875,795 | 192,232,917 | 1,069,180,222 | 94,280,078 |
| 201906 | 85,015,888 | 172,452,238 | 1,118,547,336 | 106,923,031 |
| 201907 | 85,014,754 | 171,920,529 | 1,025,756,864 | 87,891,650 |
| 201908 | 85,141,597 | 172,577,722 | 1,057,711,788 | 96,355,960 |
| 201909 | 90,938,075 | 193,546,696 | 1,117,435,357 | 101,931,902 |
| 201910 | 83,593,203 | 184,891,120 | 899,446,281 | 107,510,302 |
| 201911 | 90,410,004 | 183,149,220 | 1,014,535,215 | 107,852,112 |
| 201912 | 84,686,018 | 153,794,968 | 992,992,615 | 121,120,915 |
| 202001 | 88,922,796 | 155,096,865 | 829,935,702 | 95,957,631 |
| 202002 | 91,889,785 | 182,811,589 | 1,033,180,204 | 99,451,702 |
| 202003 | 109,690,037 | 197,476,555 | 1,283,500,099 | 134,018,615 |
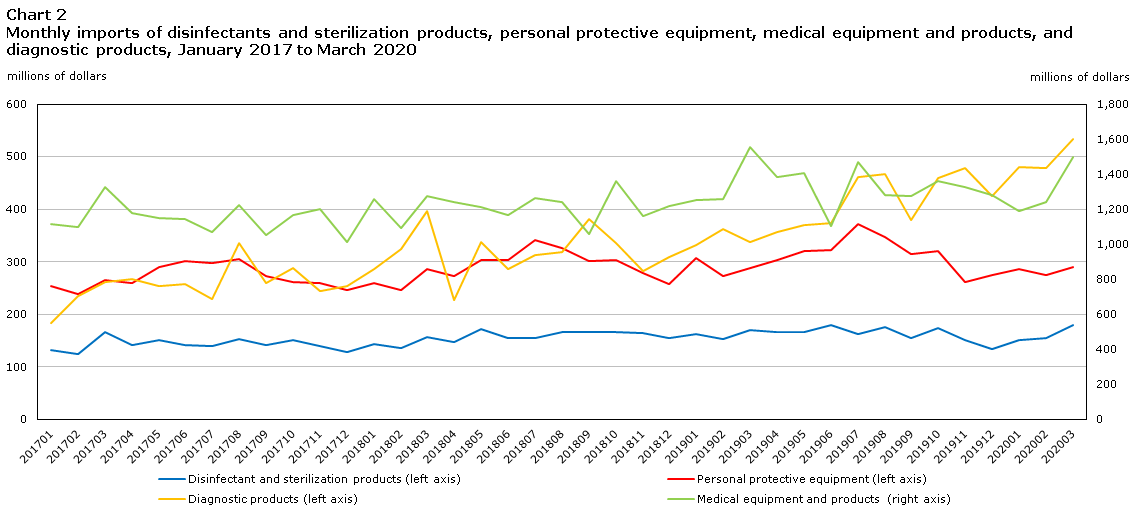
Three of four medical and protective goods categories lower for imports in 2020
In 2020, year-to-date imports of medical equipment and products, personal protective equipment, and disinfectants and sterilization products were lower than in 2019. In contrast, imports of diagnostic products rose substantially in 2020.
| January 2020 | February 2020 | March 2020 | January to February | February to March | 2019 | 2020 | 2019 to 2020 | |
|---|---|---|---|---|---|---|---|---|
| monthly value (millions of dollars) | % change | year-to-date value (millions of dollars) | % change | |||||
| Total of all products | 2,103.0 | 2,146.9 | 2,497.7 | 2.1 | 16.3 | 6,447.9 | 6,747.6 | 4.6 |
| Disinfectants and sterilization products | 149.8 | 154.1 | 178.8 | 2.9 | 16.1 | 486.8 | 482.7 | -0.8 |
| Disinfectants and sterilizers | 97.6 | 101.0 | 118.1 | 3.5 | 17.0 | 320.6 | 316.6 | -1.2 |
| Wipes | 52.2 | 53.1 | 60.7 | 1.7 | 14.3 | 166.2 | 166.1 | -0.1 |
| Personal protective equipment | 285.6 | 274.5 | 288.7 | -3.9 | 5.2 | 865.3 | 848.8 | -1.9 |
| Face and eye protection | 32.4 | 31.5 | 35.1 | -2.7 | 11.5 | 84.9 | 99.0 | 16.5 |
| Gloves | 40.6 | 35.4 | 50.8 | -12.8 | 43.7 | 116.3 | 126.8 | 9.0 |
| Other protective equipment | 212.6 | 207.6 | 202.8 | -2.4 | -2.3 | 664.1 | 623.0 | -6.2 |
| Medical equipment and products | 1,187.4 | 1,240.9 | 1,497.2 | 4.5 | 20.7 | 4,063.4 | 3,925.4 | -3.4 |
| Medical consumables | 148.6 | 140.4 | 155.4 | -5.5 | 10.7 | 425.5 | 444.4 | 4.5 |
| Medical devices | 220.8 | 232.0 | 273.4 | 5.0 | 17.9 | 729.5 | 726.2 | -0.5 |
| Medicaments | 791.1 | 846.0 | 1,033.6 | 6.9 | 22.2 | 2,829.4 | 2,670.6 | -5.6 |
| Oxygen therapy | 26.9 | 22.6 | 34.8 | -16.1 | 54.2 | 79.1 | 84.3 | 6.5 |
| Diagnostic products | 480.2 | 477.4 | 532.9 | -0.6 | 11.6 | 1,032.3 | 1,490.6 | 44.4 |
| Test kits and diagnostic instruments | 469.4 | 465.9 | 520.2 | -0.8 | 11.6 | 996.0 | 1,455.5 | 46.1 |
| Thermometers | 10.8 | 11.6 | 12.8 | 6.9 | 10.7 | 36.3 | 35.2 | -3.1 |
Year-to-date imports of medical equipment and products were down 3.4% to $3.9 billion. In 2020, imports of medicaments decreased 5.6%, as lower imports of medicaments primarily for the eyes, ears or respiratory system as well as other medicaments for human use were partially offset by higher imports of medicaments containing corticosteroid hormones. Moderating the decrease in medicaments, year-to-date imports of medical consumables (+4.5%) and oxygen therapy (+6.5%) increased, mainly in March.
Imports of personal protective equipment declined 1.9% to $849 million year-to-date compared with 2019. Lower imports of other protective equipment (-6.2%) were moderated by higher imports of face and eye protection (+16.5%) and gloves (+9.0%).
Imports of disinfectants and sterilization products were down 0.8% to $483 million in the first quarter of 2020 in comparison with the same period in 2019.
In contrast, imports of diagnostic products increased 44.4% to $1.5 billion in the first quarter of 2020 compared with 2019. Year-to-date imports in 2020 rose mainly on higher imports of test kits and diagnostic instruments from Switzerland and the United States. There were strong increases in this category of goods over the past two years.
Data table for Chart 2
| Month | Disinfectant and sterilization products | Personal protective equipment | Medical equipment and products | Diagnostic products |
|---|---|---|---|---|
| dollars | ||||
| 201701 | 132,152,758 | 254,030,303 | 1,112,395,390 | 182,786,929 |
| 201702 | 124,191,540 | 238,714,045 | 1,097,845,120 | 234,880,964 |
| 201703 | 165,222,092 | 265,256,305 | 1,328,011,989 | 261,678,938 |
| 201704 | 140,965,985 | 259,537,602 | 1,175,931,938 | 266,018,758 |
| 201705 | 150,337,904 | 289,797,100 | 1,149,854,262 | 254,166,953 |
| 201706 | 141,423,057 | 300,398,735 | 1,143,101,979 | 256,358,900 |
| 201707 | 139,222,029 | 297,067,370 | 1,069,069,711 | 228,515,839 |
| 201708 | 152,369,769 | 305,739,355 | 1,220,419,312 | 335,741,023 |
| 201709 | 140,243,927 | 271,641,190 | 1,050,845,640 | 258,437,384 |
| 201710 | 150,905,268 | 261,160,632 | 1,168,112,458 | 287,389,162 |
| 201711 | 139,290,470 | 259,208,062 | 1,202,773,131 | 244,169,185 |
| 201712 | 128,742,085 | 245,830,216 | 1,013,953,613 | 254,138,648 |
| 201801 | 143,833,343 | 259,256,490 | 1,257,069,175 | 286,307,681 |
| 201802 | 136,022,337 | 246,756,123 | 1,094,223,904 | 324,603,263 |
| 201803 | 157,158,683 | 285,641,417 | 1,272,600,642 | 396,215,873 |
| 201804 | 146,960,417 | 273,402,465 | 1,240,417,513 | 225,905,472 |
| 201805 | 170,938,042 | 302,760,674 | 1,211,402,703 | 336,635,585 |
| 201806 | 154,393,316 | 303,499,459 | 1,164,942,883 | 286,747,890 |
| 201807 | 154,119,511 | 341,318,858 | 1,265,578,445 | 312,044,395 |
| 201808 | 165,719,843 | 326,548,322 | 1,242,747,485 | 317,676,656 |
| 201809 | 166,134,370 | 300,125,097 | 1,057,020,313 | 380,404,416 |
| 201810 | 166,176,773 | 303,192,647 | 1,358,307,658 | 335,315,853 |
| 201811 | 164,241,754 | 278,475,134 | 1,160,423,889 | 281,567,412 |
| 201812 | 154,109,821 | 257,403,088 | 1,215,689,343 | 309,046,312 |
| 201901 | 162,829,515 | 306,194,568 | 1,253,320,912 | 332,390,874 |
| 201902 | 153,460,236 | 271,984,323 | 1,254,741,699 | 362,167,721 |
| 201903 | 170,522,251 | 287,153,497 | 1,555,372,800 | 337,761,777 |
| 201904 | 165,194,951 | 302,740,961 | 1,380,449,141 | 356,480,889 |
| 201905 | 166,227,322 | 320,108,908 | 1,404,675,384 | 370,031,785 |
| 201906 | 179,611,309 | 321,895,971 | 1,100,847,574 | 372,590,467 |
| 201907 | 162,836,747 | 371,057,536 | 1,467,803,012 | 461,242,273 |
| 201908 | 175,381,175 | 346,040,896 | 1,279,490,814 | 466,563,532 |
| 201909 | 155,245,435 | 313,593,046 | 1,273,721,479 | 378,517,808 |
| 201910 | 173,203,206 | 320,320,222 | 1,358,962,312 | 459,138,324 |
| 201911 | 151,253,252 | 261,391,636 | 1,323,499,008 | 477,806,852 |
| 201912 | 133,108,011 | 273,825,670 | 1,281,663,804 | 425,677,460 |
| 202001 | 149,797,176 | 285,586,954 | 1,187,362,236 | 480,249,098 |
| 202002 | 154,076,096 | 274,492,028 | 1,240,884,770 | 477,446,343 |
| 202003 | 178,820,168 | 288,717,075 | 1,497,190,425 | 532,948,265 |
Methodology
The categorization of goods used in this article was developed by Statistics Canada for the purpose of analysis. It was developed based on the Harmonized System (HS) classification guidelines produced by the World Customs Organization and the World Health Organization. The Canadian Border Services Agency’s Customs Notice 20-12, outlining applicable HS codes that can be used for the importation of such goods into Canada, was also considered in the development of these categories.
Note that many of the HS codes are broadly defined and therefore may include goods unrelated to the category into which they are placed. Additionally, data for trade under these categories may include goods that were not relevant to trade in response to the COVID-19 pandemic.
Notes
The source of these data is the Canadian International Merchandise Trade Program. Customs basis, not seasonally adjusted data by HS classification and country are available in the Canadian International Merchandise Trade database (table 65F0013X).
- Date modified: