
Rural Statistics in Canada
Rural Canada Business Profiles Metadata and User Guide, 2023
Text begins
Introduction
Small and medium-sized enterprises (SMEs) play a central role in the Canadian economy, serving as key drivers of growth across rural and small town (RST)Note and functional urban areas. In RST contexts, as elsewhere, SMEs are essential for job creation and contribute significantly to local economic and social well-being.
The Rural Canada Business Profiles (RCBP) database provides data on the number and key financial indicators of SMEs across RST and functional urban areas in Canada. While the RCBP database follows a methodology similar to the Financial Performance Data (FPD),Note it distinguishes itself through its integration of the RST and functional urban area classification. The RCBP database includes data beginning with the 2017 reference year.
The RCBP database serves as a versatile analytical tool for benchmarking and analysis for a wide range of stakeholders, including businesses, governments, academia, community organizations and the public.
This document presents the structure, data sources, methods and classification concepts used in the production of the RCBP database.
1 Database structure and contents
The RCBP database contains two sets of calculations, revenue-based and profit margin-based, with data presented by quartiles according to revenue or profit margins. Key variables in the RCBP database fall into the following categories:
- Counts of businesses
- Revenue breakdowns
- Expense breakdowns
- Balance sheetNote items (assets, liabilities, equity breakdowns)
- Financial ratios
Data are arranged, where feasible, by:
- Small or medium-sized business by annual revenue
- Various levels of geography (Canada, region, province/territory)
- RST and functional urban areas
- Industry
- Incorporation status
- Profitable and non-profitable businesses
The definitions of small and medium-sized businesses and other classifications or concepts are provided in section 5.
Cross-tabulations are provided for some of the classifications. All regions across Canada and all industries,Note except finance and insurance (NAICS 52) and public administration (NAICS 91), are included. A quality indicator is provided for each value.
All variables in the RCBP database, other than counts, are calculated based on revenue or profit and presented in separate revenue-based or profit-based data tables, respectively. Revenue-based calculations refer to arranging businesses of the applicable groupingNote by their revenue in ascending order and then dividing them into four quartiles. Profit-based calculations refer to the same procedure using profits. Variable values are provided as quartiles and aggregate values.
To illustrate the structure of the database, Figure 1 provides an overview of the different classifications and variables available in the RCBP database.
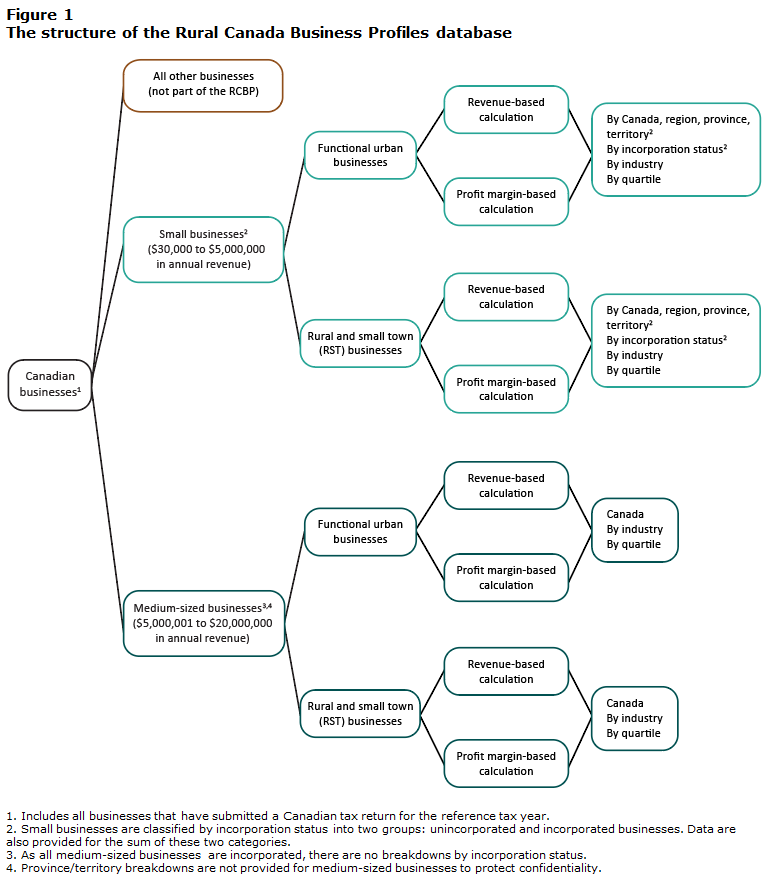
Description for Figure 1
This figure presents a five-level hierarchical classification used in the Rural Canada Business Profiles (RCBP) database. The hierarchy is presented as a tree diagram that flows from left to right. Each box (or node) in the figure contains a label and lines connect each node to its subdivisions at the next level.
Level 1
The diagram begins with a single root node labelled “Canadian businesses”.
Level 2
At the second level, “Canadian businesses” is divided into three groups:
- Small businesses ($30,000 to $5,000,000 in annual revenue)
- Medium-sized businesses ($5,000,001 to $20,000,000 in annual revenue)
- All other businesses (not part of the RCBP)
The third group does not subdivide further.
Level 3
Small businesses and medium-sized businesses are each divided into rural and small town (RST) businesses and functional urban businesses. There are four nodes at this level, one RST businesses node and one functional urban businesses node for each business size group.
Level 4
Each node from Level 3 is divided into two calculation types, revenue-based calculations and profit margin-based calculations. There are eight nodes at this level, one of each calculation type under each RST businesses and functional urban businesses node.
Level 5
Each level 4 node connects to a final node describing the classifications used for producing the calculations. For small businesses, the classifications shown are Canada, region, province or territory, incorporation status, industry and quartile. For medium-sized businesses, the classifications shown are Canada, industry and quartile.
Notes displayed below the figure
Note 1 applies to the Level 1 root node: “Includes all businesses that have submitted a Canadian tax return for the reference tax year.”
Note 2 applies to the Level 2 small businesses node: “Small businesses are classified by incorporation status into two groups: unincorporated and incorporated businesses. Data are also provided for the sum of these two categories.”
Note 3 applies to the Level 2 medium-sized businesses node: “As all medium-sized businesses are incorporated, there are no breakdowns by incorporation status.”
Note 4 applies to the Level 2 medium-sized businesses node: “Province/territory breakdowns are not provided for medium-sized businesses to protect confidentiality.”
2 Data sources
2.1 Canada Revenue Agency business tax returns data
The Canada Revenue Agency (CRA) collects and compiles business income tax returns (T1Note and T2Note ) filed by Canadian businesses. The CRA shares this information with Statistics Canada. The RCBP database uses these annual data to produce variable values for target reference years.
The RCBP database uses data from two tax forms (see section 5.6 for further details):
- T1: T1 tax returns are filed annually by unincorporated businesses.
- T2: T2 tax returns are filed annually by small and medium-sized incorporated businesses. T2 data available at Statistics Canada include geographical and industrial classifications.
2.2 Statistics Canada’s Business Register
Statistics Canada’s Business Register (BR) is a comprehensive and up-to-date list of businesses in Canada. It contains business information such as location, business number (BN)Note , and a unique operating entity number (OEN). The BR also contains a business’s CRA tax returns data, such as revenues and expenses.
3 Reference period
Each reference period of the RCBP database starts on January 1 and ends on December 31 of the same calendar year.
4 In-scope businesses
The RCBP database includes all businesses that:
- Were active in the reference year and filed a T1 or T2 CRA tax return.
- Had annual revenues of $30,000 to $20,000,000 (inclusive).
- Had geographic and industrial classifications information available in the BR.
5 Compilation methodology
This section provides an overview of the methodology used to compile the RCBP database from the source data files. The data tables are organized by the classification structure presented in Figure 1.
5.1 Merging data sources
The CRA tax data are merged with Statistics Canada’s BR data using a common unique identifier. The CRA BN is used for this purpose. A Statistics Canada unique identifier associated with each BN, known as the OEN, is then used in subsequent data processing steps.
5.2 Classification of businesses with subsidiary businesses or multiple locations
In the RCBP database, businesses with one or more subsidiaries or with more than one location were classified according to the industry, location and size of the parent business. Variable values reflect those for the entire business structure.
5.3 Classification by total annual revenues
Businesses included in the RCBP database are classified as small businesses or medium-sized businesses. This is based on a business’s total annual revenue.
- Small businesses: All businesses operating in Canada reporting total annual revenues between $30,000 and $5,000,000 (inclusive).
- Medium-sized businesses: All businesses operating in Canada reporting total annual revenues between $5,000,001 and $20,000,000 (inclusive). Due to the small number of medium-sized businesses, the RCBP database only provides national level data to protect the confidentiality of these businesses. RST area and functional urban area breakdowns at the Canada level are provided, but not for provinces or territories.
5.4 Classification by geography and geographic levels
Statistics Canada’s Standard Geographical Classification (SGC)Note was used for geographic categorization. Businesses were classified based on the location of their operations. For businesses with multiple locations, classification was determined by the location of the parent establishment.
Small businesses were tabulated at the following geographic levels (in addition to RST area or functional urban area):
- Canada
- Province or territory
- Regions: Atlantic (includes Prince Edward Island, Newfoundland and Labrador, Nova Scotia and New Brunswick); Prairies (includes Manitoba, Saskatchewan and Alberta); Territories (includes Nunavut, Northwest Territories and the Yukon)
Medium-sized businesses were tabulated only at the Canada level (in addition to RST area or functional urban area).
5.5 Rural and small town area or functional urban area classification
The definition of "rural and small town (RST) area" and "functional urban area" adheres to Statistics Canada's SGC. Businesses within census metropolitan areas (CMAs) or census agglomerations (CAs) are categorized as functional urban area, while those outside CMAs/CAs are designated rural and small town area. The 2017 to 2021 iteration of the RCBP database aligns with the 2016 SGC. From the 2022 reference year onwards, geographies align with the 2021 SGC.
The Statistics Canada BR contains the location of each business. Each business was classified as part of a RST area or functional urban area based on the census subdivision (CSD) of its location:
- RST: A business located in a CSD outside a CMA/CA
- Functional urban: A business located in a CSD within a CMA/CA
5.6 Classification by incorporation status
Small businesses were classified into three sub-groups according to their incorporation status:
- Unincorporated businesses, i.e., businesses that filed a T1 tax return
- Incorporated businesses, i.e., businesses that filed a T2 tax return
The RCBP database provides additional data tables for all small businesses, aggregated by combining T1 and T2 small business filer datasets.
All medium-sized businesses are incorporated.
The following provides a brief description of unincorporated and incorporated businesses.
- Unincorporated businesses: These businesses are usually sole proprietorships or partnership companies. The owner(s) personally bear(s) all liabilities of the business.
- A sole proprietorshipNote is owned by one individual. It is the simplest kind of business structure. The owner of a sole proprietorship has sole responsibility for making decisions, receives all the profits, claims all losses, and does not have separate legal status from the business. A sole proprietor assumes all the risks of the business. The risks extend even to the owner’s personal property and assets.
- A partnershipNote is an association or relationship between two or more individuals, corporations, trusts, or partnerships that join to carry on a trade or business. Each partner contributes money, labour, property, or skills to the partnership. In return, each partner is entitled to a share of the profits or losses of the business. The business profits (or losses) are usually divided among the partners based on the partnership agreement.
- Incorporated businesses: An incorporated business, or a corporation, is a separate legal entity from the business owner(s). Incorporation of a business limits the liability of its owner(s). When incorporated, a business becomes a separate legal entity, and the corporation, not the owner(s), is generally liable for its debts and obligations.
- Some other advantages to incorporating a business include the ability to borrow money in the business’s name, access to credit available to corporations, the ability to own property in the business’s name and a set of options for continuity of the business as the ownership changes.
5.7 Classification by industry and industry levels
Businesses in the Statistics Canada BR are classified by industry using the North American Industry Classification System (NAICS). For the RCBP database, businesses are classified according to the 2017 NAICSNote codes for the 2017 to 2021 reference periods and the 2022 NAICSNote for the 2022 reference period onward.
The NAICS structure is hierarchical, with codes ranging from 2 to 6 digits depending on the level of detail (Table 1). The RCBP data tables are presented at the sector (2 digit) and sub-sector (3 digit) levels. All industry sectors are included except for Finance and insurance (NAICS 52) and Public administration (NAICS 91) (sector and sub-sector level).
| Code | Hierarchical level |
|---|---|
| 11 | Sector |
| 111 | Subsector |
| 1111 | Industry group |
| 11111 | Industry |
| 111110 | Canadian industry |
For businesses with operations in multiple industries, the RCBP database reports information by the industry of the parent business.
5.8 Presentation by quartiles
Values are presented as averages for all businesses and for quartiles based on annual revenues and annual profits.
5.9 Imputation
Imputation is the process of assigning values to records with missing or inconsistent data based on information from records with more complete data. This generally occurs in two situations: (1) when a value is not reported or (2) when the reported value is deemed to be outside the limits of statistically consistent values. Quality indicators (see section 5.10) measure the extent to which imputation contributes to a given value.
5.10 Quality Indicators
Imputed values can affect the accuracy of aggregates that include the affected businesses. To indicate the reliability of each aggregate, a letter-based quality indicator is provided. The letters carry the following interpretation:
- A: Excellent
- B: Very good
- C: Good
- D: Acceptable
- E: Use with caution
5.11 Disclosure control and confidentiality protection
Statistics Canada is prohibited by law from releasing any data which would divulge information obtained under the Statistics ActNote that relates to any identifiable person, business or organization without the prior knowledge or the consent in writing of that person, business or organization. Various confidentiality rules are applied to all data that are released or published to prevent the publication or disclosure of any information deemed confidential. If necessary, data are suppressed to prevent direct or residual disclosure of identifiable data.
To protect the confidentiality of contributing businesses, certain values are suppressed in the RCBP database. Data suppression is applied using a hierarchy-aware privacy program developed by Statistics Canada (G-Confid). This process results in two types of suppression:
- Primary suppression: Applied when a small number of businesses contribute to a cell value or when a cell value is dominated by one or more businesses.
- Secondary suppression: Applied to additional cells to prevent derivation of primary-suppressed values, allowing higher-level aggregates to be published. For example, if a value of a variable for a single industry in a RST area of a province is suppressed, another industry in the same province is also suppressed to maintain confidentiality.
Data cells suppressed in the RCBP database for confidentiality reasons are represented by a lowercase ‘x’.
6 Revision strategy and possible future release of subsequent reference years
Data released in the RCBP database for a given reference year are final and are not subject to updates or revisions. The RCBP database is updated annually as new tax data become available.
7 Downloading the Rural Canada Business Profiles
The RCBP database is provided as a series of twenty-four (24) data tables, offering add/remove functionality and multiple download format options.
Contents of downloadable tables
Small businesses, revenue-based calculation
- Table 33-10-0577-01: Rural Canada Business Profile, total revenue and other revenue variables of small businesses by industry, location indicator and incorporation status; revenue-based calculations
- Table 33-10-0578-01: Rural Canada Business Profile, expense items as a percent of total revenue of small businesses by industry, location indicator and incorporation status; revenue-based calculations
- Table 33-10-0579-01: Rural Canada Business Profile, expense items of small businesses by industry, location indicator and incorporation status; revenue-based calculations
- Table 33-10-0580-01: Rural Canada Business Profile, balance sheet items of incorporated small businesses by industry and location indicator; revenue-based calculations
- Table 33-10-0581-01: Rural Canada Business Profile, financial ratios of incorporated small businesses by industry and location indicator; revenue-based calculations
- Table 33-10-0582-01: Rural Canada Business Profile, financial ratios of small businesses by industry, location indicator and incorporation status; revenue-based calculations
- Table 33-10-0583-01: Rural Canada Business Profile, business items for profitable and non-profitable small businesses by industry and location indicator; revenue-based calculations
Small businesses, profit margin-based calculation
- Table 33-10-0584-01: Rural Canada Business Profile, total revenue and other revenue variables of small businesses by industry, location indicator and incorporation status; profit margin-based calculations
- Table 33-10-0585-01: Rural Canada Business Profile, expense items as a percent of total revenue of small businesses by industry, location indicator and incorporation status; profit margin-based calculations
- Table 33-10-0586-01: Rural Canada Business Profile, expense items of small businesses by industry, location indicator and incorporation status; profit margin-based calculations
- Table 33-10-0587-01: Rural Canada Business Profile, balance sheet items of incorporated small businesses by industry and location indicator; profit margin-based calculations
- Table 33-10-0588-01: Rural Canada Business Profile, financial ratios of incorporated small businesses by industry and location indicator; profit margin-based calculations
- Table 33-10-0589-01: Rural Canada Business Profile, financial ratios of small businesses by industry, location indicator and incorporation status; profit margin-based calculations
- Table 33-10-0590-01: Rural Canada Business Profile, business items for profitable and non-profitable small businesses by industry and location indicator; profit margin-based calculations
Medium-sized businesses, revenue-based calculation
- Table 33-10-0591-01: Rural Canada Business Profile, total revenue and other revenue variables of incorporated medium businesses by industry and location indicator; revenue-based calculations
- Table 33-10-0592-01: Rural Canada Business Profile, expense items as a percent of total revenue of incorporated medium businesses by industry and location indicator; revenue-based calculations
- Table 33-10-0593-01: Rural Canada Business Profile, expense items of incorporated medium businesses by industry and location indicator; revenue-based calculations
- Table 33-10-0594-01: Rural Canada Business Profile, balance sheet items of incorporated medium businesses by industry and location indicator; revenue-based calculations
- Table 33-10-0595-01: Rural Canada Business Profile, financial ratios of incorporated medium businesses by industry and location indicator; revenue-based calculations
Medium-sized businesses, profit margin-based calculation
- Table 33-10-0596-01: Rural Canada Business Profile, total revenue and other revenue variables of incorporated medium businesses by industry and location indicator; profit margin-based calculations
- Table 33-10-0597-01: Rural Canada Business Profile, expense items as a percent of total revenue of incorporated medium businesses by industry and location indicator; profit margin-based calculations
- Table 33-10-0598-01: Rural Canada Business Profile, expense items of incorporated medium businesses by industry and location indicator; profit margin-based calculations
- Table 33-10-0599-01: Rural Canada Business Profile, balance sheet items of incorporated medium businesses by industry and location indicator; profit margin-based calculations
- Table 33-10-0600-01: Rural Canada Business Profile, financial ratios of incorporated medium businesses by industry and location indicator; profit margin-based calculations
8 Data dictionary
| Variable/item | Description |
|---|---|
| Accounts receivable | This category includes all claims against debtors arising from the sale of goods and services and any other miscellaneous claims with respect to non-trade transactions. It excludes loan receivables and amounts receivable from related parties. |
| Advertising and promotion | This category includes all advertising expenses, such as promotions, signs, window dressings and catalogues. |
| All other revenues | This category includes revenue from interest, dividends, commissions, rent and other sources of revenue. |
| Amortization and depletion | This category includes allocation of the cost of revenue-producing assets (that is expected to last more than a year) among the life of the asset. The items that correspond to this definition are amortization on capital assets and the amount of amortization on capital cost. |
| Averages | The Financial Performance Data (FPD) provides financial data (income statement and balance sheet items), presented as averages based on industry by each quartile grouping. |
| Closing inventory | This is the value of inventory at the end of the reporting period. |
| Collection period for accounts receivable | Estimate of the average number of days it takes to collect receivables from the day of the transaction. It is calculated as (accounts receivable) / (average daily revenue). Average daily revenue is calculated as (total revenue) / (365 days). This ratio measures liquidity by indicating the effectiveness of the credit and debt collection activities of the business. Increases in the collection period indicate an increasing time lag between credit sales and cash realization. This ratio is not very relevant for financial, construction and real estate industries. It can also be calculated as (365 days) / (accounts receivable turnover). Accounts receivable turnover is calculated as (sales revenue on account) / (average trade accounts receivable). |
| Cost of sales (direct expenses) | This category includes direct costs incurred by businesses from the process of selling goods. This item is calculated as wages and benefits + purchases, materials and subcontracts + opening inventory - closing inventory. |
| Current bank loans | This category includes all short-term loans and notes payable to Canadian banks and foreign bank subsidiaries, with the exception of loans from foreign banks, loans secured by real estate mortgages, bankers’ acceptances, bank mortgages and the current portion of long-term bank loans. |
| Current debt to equity | This ratio is calculated as (current liabilities * 100) / (equity). This percentage is a measure of liquidity, which indicates a firm’s relative ability to pay its short-term debts. The lower the positive ratio, the more liquid the business. This ratio also provides information on the capital structure of a business and the extent to which a firm’s capital is financed through current debt. This ratio is relevant for all industries. |
| Current ratio | This ratio indicates the firm’s ability to pay liabilities with current assets. It is calculated as (total current assets) / (total current liabilities). The larger the ratio, the more liquid the business. It is not very relevant for financial, construction and real estate industries. This ratio is also known as the "working capital ratio". |
| Debt ratio | This ratio is calculated as (total liabilities) / (total assets). It is a solvency ratio indicating a firm’s ability to pay its long-term debts. It reports the amount of debt outstanding in relation to the amount of capital. The lower the ratio, the more solvent the business. |
| Debt to equity ratio | This ratio is calculated as (total liabilities) / (total equity). This is a solvency ratio that indicates a firm’s ability to pay its long-term debts. The lower the positive ratio, the more solvent the business. The debt to equity ratio also provides information on the capital structure of a business—the extent to which a firm’s capital is financed through debt. This ratio is relevant for all industries. |
| Delivery, shipping and warehouse expenses | This category includes expenses for delivery, shipping, courier and distribution services used by businesses, with the exception of those in the transportation industry, which are included in purchases and materials. |
| Functional urban business | A business located within a census metropolitan area (CMA) or census agglomeration (CA). |
| Gross margin | This margin is calculated as (sales of goods and services - costs of sales * 100) / (sales of goods and services). This percentage provides a relative measure of the profitability or profit margin. |
| Insurance | This category includes all types of insurance, such as bonding, car insurance, fire and liability insurance, and premium expenses. |
| Interest and bank fees | This category includes all interest expenses and discounts paid by the business, such as real estate mortgages, chattel mortgages, mortgage bonds, advances and demand loans, and bank interest. |
| Interest coverage ratio | This ratio is calculated as (net profit + interest and bank fees) / (interest and bank fees). It represents the average number of times that interest owing is earned and, therefore, indicates the debt risk of a business. The larger the ratio, the more able a firm is to cover its interest obligations on the debt. This ratio is not very relevant for financial industries. It is also known as “times interest earned ratio.” |
| Labour and commissions | This category includes remuneration paid to the employees of the business not shown in the cost of sales (direct expenses) that include salaries and wages. |
| Long-term assets | This category includes all other assets not recorded elsewhere, such as long-term bonds. |
| Long-term liabilities | This category includes all obligations that are not reasonably expected to be liquidated within the normal operating cycle of the business but, instead, are payable at some date beyond that time. It includes obligations such as long‑term bank loans and notes payable to Canadian chartered banks and foreign subsidiaries, with the exception of loans secured by real estate mortgages, loans from foreign banks, bank mortgages and other long‑term liabilities. |
| Net fixed assets to equity | This ratio is calculated as (net fixed assets * 100) / (equity). Net fixed assets represent long-term investments. This percentage indicates the relative capital investment structure. |
| Net profit or loss | The profit or loss resulting from normal business operations recorded before income taxes, extraordinary items and other income unrelated to normal operations. For unincorporated firms, the owners’ or partners’ salaries and withdrawals are included. |
| Net profit to equity | This ratio is calculated as (net profit * 100) / (equity). This percentage indicates the profitability of a business. It relates the business income to the amount of investment committed to earning that income. This percentage is also known as “return on investment” or “return on equity.” The higher the ratio, the relatively better the profitability. |
| Net tangible and intangible assets | The tangible or intangible property held by businesses for use in the production or supply of goods and services or for rental to third parties in the regular operations of the business. It excludes assets intended for sale. Examples of such items are facilities, equipment, patents, goodwill, etc. The valuation of net fixed assets is recorded net of accumulated depreciation, amortization and depletion. |
| Non-profitable businesses | Businesses for which expenses exceed revenue. |
| North American Industry Classification System (NAICS) | Statistics Canada’s standardized coding system for grouping businesses engaged in similar types of activity into non-overlapping industry categories. The first two digits designate the sector, the third digit designates the subsector, the fourth digit designates the industry group and the fifth digit designates the industry. |
| Opening inventory | The value of inventory carried over from the previous reporting period and used to calculate average inventory. It also helps determine the cost of goods sold and includes tangible assets held for sale in the ordinary course of business, goods in the process of production for such sale or materials to be consumed in the production of goods and services for sale. It excludes assets held for rental purposes. |
| Operating expenses (indirect expenses) | This category includes all expenses incurred in the course of running the business. It includes remuneration paid as labour and commissions, amortization and depletion, repair and maintenance costs, utility fees and telephone and telecommunication fees, rent, interest and bank fees, professional and business fees, advertising and promotional costs, delivery fees and shipping and warehouse expenses, insurance costs, and other indirect expenses. |
| Other current assets | This category includes all current assets not accounted for in accounts receivable and closing inventory. |
| Other indirect expenses | This category includes all other expenses, such as bad debts, laundry and cleaning expenses, beverage licences, business charges and taxes, interest on taxes, fines and penalties, business taxes, permits, membership expenses, crew share expenses, fishing gear expenses, insurance expenses, meal and entertainment expenses, net and trap expenses, office expenses, office stationery and supply expenses, property tax expenses, salt bait and ice expenses, travel expenses, vehicle expenses, and other expenses. |
| Percentage of businesses reporting | Percentage of businesses represented in the sample reporting an expense item on their tax return. |
| Professional and business fees | This category includes all expenditures for external professional advice or services, such as accounting fees, legal fees, management fees and incorporation fees. |
| Profitable businesses | Businesses for which revenue is equal to or exceeds expenses during the reference period. |
| Purchases, materials and subcontracts | This category includes purchases used to produce revenue for product sales, land costs, land purchased for resale and other recorded direct costs, including costs incurred by businesses that hire outside firms to perform special trade tasks. |
| Quality indicators | These indicators provide data users with information on the accuracy of published estimates. Although, as for a census, estimates are not subject to sampling error, the quality of displayed values is still subject to other factors, including imputation. Imputation is a process whereby records with missing data are assigned values based on the data of records with more complete data. It is performed in two cases: when a data point reported by a business is judged to fall outside the limits of statistically coherent values or when a business fails to itemize all or part of the required information. Imputation methods used by Statistics Canada include, but are not limited to, historical imputation, donor imputation and generic-to-detail allocation. The quality indicators below represent a measure of the amount of imputation contributing towards a given value. A (excellent); B (very good); C (good); D (acceptable); E (use with caution). |
| Quartiles | Quartiles are the whole of the small and medium-sized businesses that operate within the selected industry distributed into four groups (quartiles) of the same size based on levels of revenue or profit margin generated. Each profile contains groupings within the whole revenue or profit margin range. To define the quartiles, the businesses are first ranked from the lowest to the highest operating revenue or profit margin. Then, the sample is divided into four parts: a bottom quartile, a lower-middle quartile, an upper-middle quartile and a top quartile. The bottom quartile consists of the 25% of businesses with the lowest reported operating revenue or profit margin. The lower-middle quartile consists of the 25% of businesses with reported operating revenue above the cut-off for the bottom quartile and below the median revenue or profit margin level. The upper-middle quartile consists of the 25% of businesses with reported operating revenue or a profit margin above the median revenue level and below the cut-off for the top quartile. The top quartile consists of the 25% of businesses with the highest reported operating revenue or profit margin. |
| Rent | This category includes all rental expenditures paid to other companies or agencies for the use of land, offices, buildings, machinery and equipment, but excludes capital leases. |
| Repairs and maintenance | This category includes costs related to new or replacement parts or to the restoration of facilities and machinery to keep properties in good working condition. |
| Return on total assets | This return is calculated as (net profit + interest and bank fees) * 100 / (total assets). Also known as “return on total investment,” it is a relative measure of profitability and is defined as the rate of return earned on the investment of total assets by a business. It reflects the combined effect of both the operating and the financing or investing activities of a business. The higher the percentage, the better the profitability. |
| Revenue to closing inventory ratio | This ratio is calculated as (total revenue) / (closing inventory). This is an efficiency ratio that indicates the average liquidity of the inventory or whether a business has over- or under-stocked inventory. This ratio is also known as “inventory turnover” and is often calculated using “cost of sales (direct expenses)” rather than “total revenue.” This ratio is not very relevant for financial, construction and real estate industries. |
| Revenue to equity ratio | This ratio is calculated as (total revenue) / (equity). It indicates the profitability of a business, relating the total business revenue to the amount of investment incurred to earn this income. This ratio provides an indication of the economic productivity of capital. |
| Rural and small town business | A business that is located outside a census metropolitan area (CMA) or a census agglomeration (CA). |
| Sales of goods and services | This category includes revenue from the sales of goods and services. |
| Total assets | All resources controlled by a business as a result of past transactions or events from which future economic benefits may be obtained. |
| Total current assets | The total of cash and other resources expected to be liquidated, sold or consumed within one year or within the normal operating cycle of the business, whichever is longer. |
| Total current liabilities | Obligations expected to be paid within one year or within the normal operating cycle, whichever is longer. Current liabilities are generally paid out of current assets or through the creation of other current liabilities. Examples of such liabilities include accounts payable and advances from customers. |
| Total equity | The net worth of a business and includes elements such as the value of common and preferred shares and earned, contributed and other surpluses. |
| Total expenses | This category includes all expenses incurred by a firm to generate revenues in the normal operation of the business. This item corresponds directly to the total expenses on tax forms. |
| Total liabilities | Obligations of a business arising from past transactions or events, the settlement of which may result in the transfer of assets, provision of services or other yielding of future economic benefits. |
| Total revenue | This category includes average revenue from the sale of goods and services, interest, dividends, commissions, rent and other sources of revenue. It excludes capital gains or losses, extraordinary gains or losses and equity in net income of related parties. |
| Utilities and telephone or telecommunication services | This category includes expenses for heat, lighting, water, and telephone and telecommunication services for the location where the business operates, as well as expenses for the electricity or fuel used to power its factory or plant. |
| Wages and benefits | This category includes wages and benefits paid to employees that are shown in the cost of sales (direct expenses). |
- Date modified: