
Portrait of Youth in Canada: Data Report
Chapter 3: Youth and Education in Canada
Skip to text
Text begins
Highlights
- Young Canadians are highly educated and compare favourably to their counterparts in other Organisation for Economic Co-operation and Development (OECD) countries in terms of educational attainment, literacy and numeracy.
- Young women are achieving a university credential in higher proportions than young men. Young South Asian and Chinese adults also have the highest proportions of bachelor’s degree or higher attainment compared to other population groups.
- At least half of postsecondary graduates reported that they took on debt to finance their studies. Student debt levels have remained fairly constant over the past 15 years or so, with the exception of those studying in professional degrees.
- Once they reach the labour market, postsecondary graduates have higher employment levels, and higher average and median incomes. This has remained true even with an increasing proportion of young people completing a postsecondary education.
- Higher levels of education are associated with higher median cumulative earnings. In Canada, the cumulative earnings premium associated with a postsecondary education is far greater than average student debt levels.
Introduction
Younger Canadians are more likely than previous generations to have completed a postsecondary education. In 2019, 73% of young Canadians aged 25 to 34 had attained a postsecondary qualification, rising from 59% in 2000.
These levels are rising faster in certain groups than in others. For example, this chapter will show that some population groups are particularly likely to complete a university degree or diploma, while others are not. In addition, educational attainment varies by sex, with young women obtaining university credentials in higher proportions than young men.
Using Statistics Canada data, this chapter provides a broad overview of the educational situation of Canadian youth. It focuses not only on the general level of education for young Canadians, but also on which groups are driving these rising educational levels. In addition, this chapter examines the literacy and numeracy skills of young Canadians, and how they compare with their counterparts in other OECD countries. Finally, it looks at some of the costs and benefits of acquiring a postsecondary education in Canada, including how these credentials have been rewarded on the labour market (higher employment rates, higher earnings, etc.). Education among First Nations, Métis and Inuit youth will be examined in a forthcoming dedicated chapter on Indigenous youth, which will include a broad range of demographic, health and socio-economic statistics.
The COVID-19 pandemic, and the resulting school and business closures that began in March 2020, have had enormous effects on the lives of young Canadians. Chapter 2 of this report, “Youth employment in Canada,” showed for example that because of the job losses the pandemic triggered, the percentage of young men and young women neither in school nor employed increased substantially from 2019 to 2020. The school and business closures have also affected postsecondary students, in terms of their academic experiences with many classes moving online and in terms of their ability to finance their studies. Looking forward, the pandemic may also affect the outcomes for students once they graduate and enter the labour market, and this chapter also presents some of these short-term and potential long-term effects.
Educational attainment
Younger adults have higher educational attainment than older adults, but these patterns differ by sex
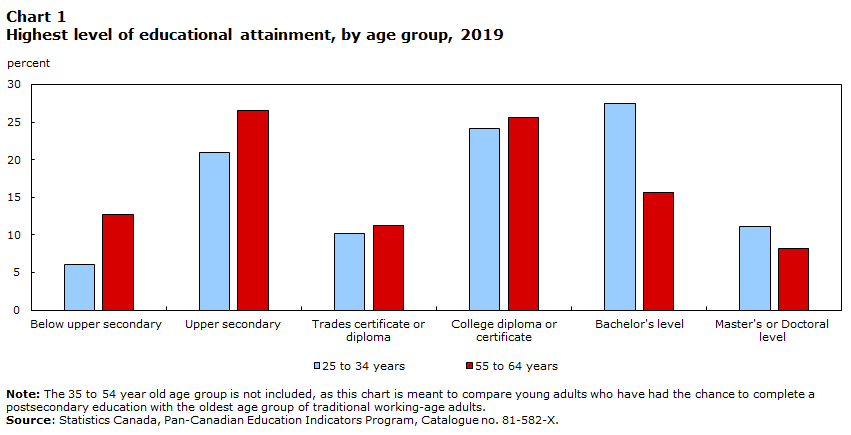
Almost three quarters or 73% of young Canadians aged 25 to 34 have a postsecondary qualification. Younger Canadians are more likely than older Canadians to have a postsecondary education, and this is mostly due to differences in degree attainment (Chart 1). A higher proportion of younger Canadians aged 25 to 34 have attained a bachelor’s, master’s or doctoral degree compared to older Canadians aged 55 to 64 (39% versus 24%). Meanwhile, the proportion of younger Canadians who have attained a college or CEGEP certificate or diploma as their highest credential is fairly similar to that of older Canadians (26% versus 24%).Note Finally, the proportion attaining a trades certificate or diploma (including apprenticeship) as their highest credential is also similar (10% for younger Canadians, 11% for older ones).
Data table for Chart 1
| Age Group | ||
|---|---|---|
| 25 to 34 years | 55 to 64 years | |
| percent | ||
| Level of educational attainment | ||
| Below upper secondary | 6.0 | 12.7 |
| Upper secondary | 21.0 | 26.5 |
| Trades certificate or diploma | 10.2 | 11.2 |
| College diploma or certificate | 24.2 | 25.6 |
| Bachelor's level | 27.5 | 15.7 |
| Master's or Doctoral level | 11.1 | 8.2 |
|
Note: The 35 to 54 year old age group is not included, as this chart is meant to compare young adults who have had the chance to complete a postsecondary education with the oldest age group of traditional working-age adults. Source: Statistics Canada, Pan-Canadian Education Indicators Program, Catalogue no. 81-582-X. |
||
Notably, only a small proportion of Canadians aged 25 to 34 have neither a high school diploma nor a postsecondary credential (6%), which is less than half of the comparable proportion for older Canadians (13%).
While education levels are generally higher among young men and women than their older counterparts, there are some variations by sex (Chart 2). In particular, the gap between the older and younger age groups is much larger among women.
Specifically, 44% of young women have a university degree, compared to 24% of older women. By comparison, the gap in university attainment is much smaller among men, with 33% of young men and 24% of older men having a university degree. In addition, the proportion of younger women obtaining a masters or doctorate is higher (13%) than for older women (8%), but this proportion is the same for younger and older men (9%).
Almost a quarter (24%) of young men have high school as their highest level of education, which is very similar to the proportion of older men who have gone as far as high school (25%). In contrast, only 18% of young women have high school as their highest level of education, compared to 28% of older women.

Data table for Chart 2
| Sex and age group | ||||
|---|---|---|---|---|
| Male 25 to 34 years | Male 55 to 64 years | Female 25 to 34 years | Female 55 to 64 years | |
| percent | ||||
| Level of educational attainment | ||||
| Below upper secondary | 7.4 | 14.0 | 4.6 | 11.4 |
| Upper secondary | 24.0 | 24.7 | 17.8 | 28.3 |
| Trades certificate or diploma | 13.9 | 15.5 | 6.3 | 7.0 |
| College diploma or certificate | 21.7 | 21.6 | 26.9 | 29.6 |
| Bachelor's level | 23.8 | 15.2 | 31.4 | 16.3 |
| Master's or Doctoral level | 9.3 | 9.1 | 13.1 | 7.4 |
|
Note: The 35 to 54 year old age group is not included, as this chart is meant to compare young adults who have had the chance to complete a postsecondary education with the oldest age group of traditional working-age adults. Source: Statistics Canada, Pan-Canadian Education Indicators Program, Catalogue no. 81-582-X. |
||||
A higher proportion of young Canadians have a college diploma or university degree than the OECD average, mainly due to college diplomas
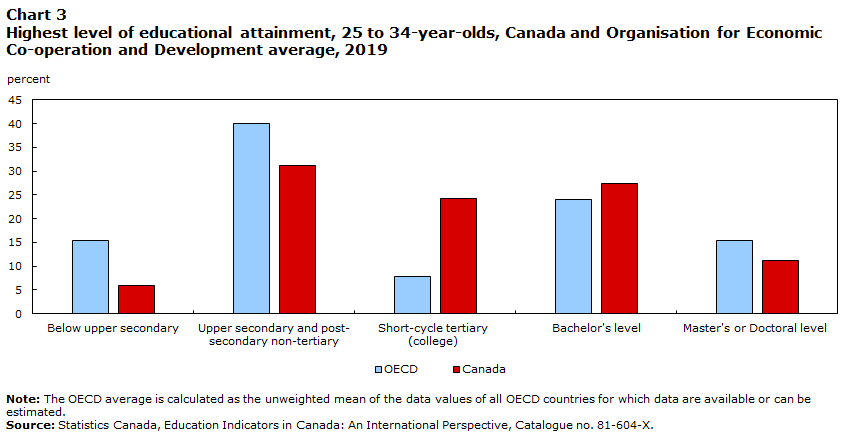
Overall, young Canadians have a higher level of education than other youth across OECD countries. The proportion of young Canadian adults who have no high school diploma is lower (6%) than the OECD average (15%), and the proportion of younger Canadians who have attained a college or university education is higher than the comparable OECD average (Chart 3). Specifically, 63% of young Canadians have obtained either of these credentials versus 45%Note of young individuals across OECD countries.
This is mainly due to the high proportion of young Canadians who have attained a college education. The proportion of younger Canadians with a college diploma is three times the OECD average (24% versus 8%), reflecting the importance of this sector in Canada. Conversely, the proportion of young Canadians who have a bachelor’s degree is closer to the OECD average (28% versus 24%), while the proportion of young Canadians who have a master’s degree or doctorate is lower (11% versus 15%).
Data table for Chart 3
| OECD | Canada | |
|---|---|---|
| percent | ||
| Level of educational attainment | ||
| Below upper secondary | 15.4 | 6.0 |
| Upper secondary and post-secondary non-tertiary | 40.1 | 31.1 |
| Short-cycle tertiary (college) | 7.8 | 24.2 |
| Bachelor's level | 24.1 | 27.5 |
| Master's or Doctoral level | 15.3 | 11.1 |
|
Note: The OECD average is calculated as the unweighted mean of the data values of all OECD countries for which data are available or can be estimated. Source: Statistics Canada, Education Indicators in Canada: An International Perspective, Catalogue no. 81-604-X. |
||
Highest level of education varies by population group, with youth not in a group designated as a visible minority and Black youth least likely to have a postsecondary educational qualification
As source countries for immigrants have shifted, with more immigration from Asia, Africa and Latin America than from Europe over the last few decades, the composition of the Canadian population has become more diverse. Previous studies have found that in general, the children of immigrants out-perform both their parents and non-immigrants in terms of educational attainment.Note However, there is variation within children of immigrants by population group. For example, Black youth were less likely than other population groups to have a postsecondary certificate, diploma or degree in 2016.Note
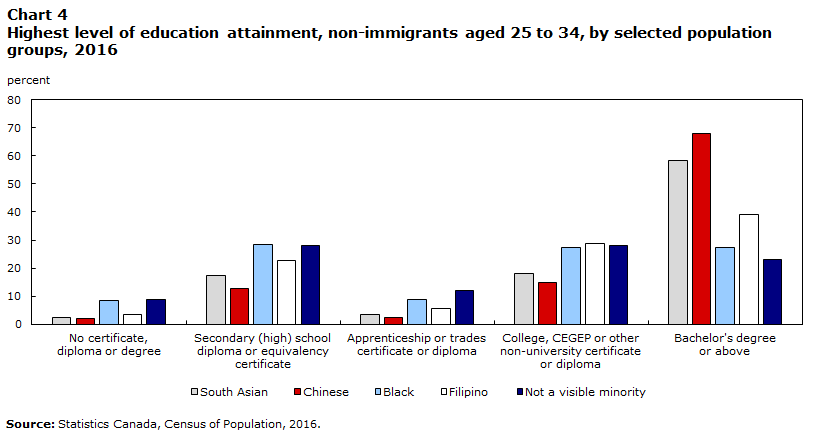
Chart 4 highlights this diversity among population groups. For example, in 2016, non-immigrant young South Asian and Chinese adults had the highest attainment of a bachelor’s degree or higher, at 58% and 68% respectively, as well as the smallest proportions that did not complete high school. These two groups are also the least likely to have a high school diploma, apprenticeship qualification or college diploma as their highest level of education, since many in these two groups obtain a bachelor’s degree or higher.
Data table for Chart 4
| Level of educational attainment | |||||
|---|---|---|---|---|---|
| No certificate, diploma or degree |
Secondary (high) school diploma or equivalency certificate |
Apprenticeship or trades certificate or diploma |
College, CEGEP or other non-university certificate or diploma |
Bachelor's degree or above | |
| percent | |||||
| Visible minority | |||||
| South Asian | 2.5 | 17.5 | 3.4 | 18.1 | 58.4 |
| Chinese | 1.9 | 12.6 | 2.5 | 15.0 | 68.0 |
| Black | 8.3 | 28.5 | 8.7 | 27.4 | 27.2 |
| Filipino | 3.4 | 22.8 | 5.6 | 28.9 | 39.2 |
| Not a visible minority | 8.9 | 28.1 | 12.0 | 27.9 | 23.0 |
| Source: Statistics Canada, Census of Population, 2016. | |||||
Conversely, the proportion of Black youth (8%) and youth who are not a member of a population group designated as visible minority (9%) who have not attained a high school diploma is notably higher than for other groups. This is also true for high school as the highest level of education (28% for both groups). Conversely, Black youth and youth who are not member of a population group designated as visible minority are considerably less likely than other groups to have obtained a university degree (27% and 23%, respectively).
Canada has a high level of intergenerational mobility in education, but challenges remain
It is well-established that one of the strongest predictors of educational attainment is the education level of one’s parents. This is for a number of reasons: more highly educated parents are better able to help their children navigate education systems, can support their children’s learning, may act as role models, place higher expectations on their children, and tend to be in a better economic position.
One way to look at a person’s chances given the characteristics of their parents is to look at the degree to which children obtain a higher level of education than their parents (i.e., intergenerational mobility in education). Results from the Programme for International Assessment of Adult Competencies suggest that in Canada, compared to other OECD countries, there is a fairly high level of intergenerational mobility in education for adults whose parents did not have either a college diploma or university degree.Note In 2011, slightly more than half (52%) of Canadians whose parents had completed at least high school, but not college or university, had attained a college or university diploma or degree. Only Korea had a larger proportion of its population achieving this type of mobility among the participating OECD member countries.
Another way to examine whether there is equitable access to a postsecondary education is to examine whether the postsecondary participation rate of young people from lower-income families is increasing. One recent studyNote presents evidence from tax files, suggesting that while the proportion of 19 year-old youth enrolling in postsecondary education increased for all income quintiles (groups of 20%) over the last two decades, participation rates have increased somewhat more quickly for youth from the lowest income quintile, especially in relative terms. Between 2001 and 2017, the postsecondary enrolment rate for youth at the bottom quintile increased by 28% (from 34% to 43%) compared to an increase of 10% (from 71% to 77%) for youth in the top income quintile.
However, a substantial gap remains. In 2017, there was still a significant difference in postsecondary enrolment for 19-year-olds in the top and bottom income quintiles—77% to 43%. While it may be tempting to conclude that this gap is related to differences in financial constraints, a previous Statistics Canada study found that only a very small portion of the gap in university enrolment across family income categories was due to this factor. The vast majority of the gap could be explained by differences in the educational attainment of the parents, academic performance of the children, and parental expectations placed upon them.Note
Start of text box
How has the COVID-19 pandemic affected postsecondary students?
From April 19 to May 1, 2020, Statistics Canada conducted online crowdsourcing data collectionNote with over 100,000 students to learn how the pandemic was impacting their academic, labour market and financial situations.Note The pandemic led to the physical closure of colleges and universities across Canada and a shift to other ways of delivering courses, most notably online learning. At that early stage of the pandemic, 57% of participants reported that their academic work placements or courses were either delayed, postponed or cancelled.Note
One of the largest impacts of the pandemic was on the employment plans of postsecondary students. Young people in particular were hit hard by the disruptions in the labour market, and the responses of the crowdsourcing respondents reflected this, with many participants either losing their jobs or seeing their job prospects disappear. Of the respondents who had a job in March 2020 that they planned to continue, a slight majority had either been laid off temporarily (34%) or lost their job (21%) two months later. A further 26% reported working reduced hours. Less than a quarter (24%) were working as planned.
These changes in job prospects were reflected in the concerns that many student participants reported about their employment situation. Overall, 58% indicated that they were very or extremely concerned about losing their job in the future, and 67% were very or extremely concerned about having no job prospects in the near future. Not surprisingly, many students worried about how they would pay for future education-related expenses.
In terms of participation in education, figures from the first school semester in 2020/2021 (September to December) show participation rates that are similar to those observed in the same time period before the pandemic (Chart 5).Note Overall, 50% of Canadian youth aged 18 to 24 were attending school in September 2020, compared to 48% in 2019. The proportion of young men studying in September 2020 was exactly the same as it was one year before (43%), while the participation rate for young women was higher at 57% in September 2020 versus 54% one year before.Note A recent study found that this was due to young women’s higher participation rates in postsecondary education at the start of the 2020 school year when compared with one year before.Note

Data table for Chart 5
| September 2019 | September 2020 | |
|---|---|---|
| percent | ||
| Total | 48.2 | 49.6 |
| Male | 43.2 | 43.0 |
| Female | 53.6 | 56.7 |
| Source: Statistics Canada, Labour Force Survey, 2019 and 2020. | ||
End of text box
Literacy and numeracy
Canadian 15-year-olds among the highest performers in the world in reading and math
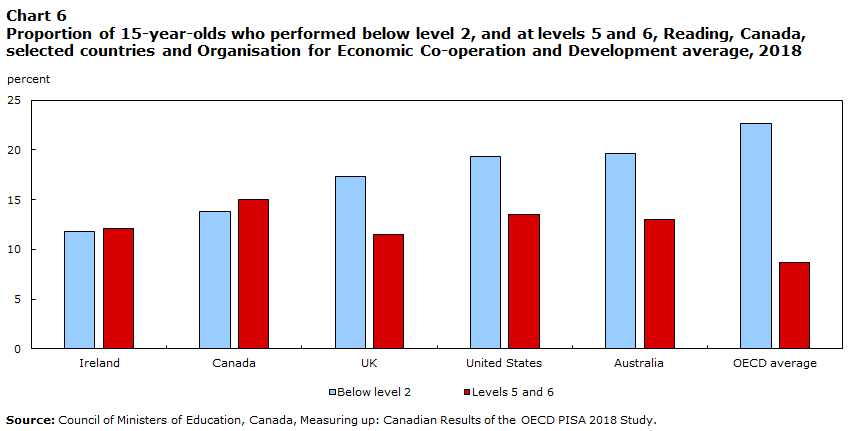
A higher proportion of young Canadians have attained a postsecondary qualification than the OECD average. But how do secondary students compare with their OECD counterparts in terms of literacy and numeracy skills? The Programme for International Student Assessment (PISA) is an international survey administered every three years to 15-year-olds around the world that directly measures student performance in reading, math and science.Note In 2018, PISA results showed that Canadian students fared well compared to the OECD average (Chart 6). While 14% of Canadian students did not meet the minimum proficiency in reading, this was well below the OECD average of 23% (and also lower than in the United Kingdom, the United States and Australia).Note In addition, the proportion of Canadian students who achieved the highest levels of proficiency in reading was third highest among all OECD countries at 15%, behind Beijing, Shanghai, Jiangsu, Zhejiang (BSJZ) (China) and Singapore. The comparable figure for all OECD countries combined was 9%.
Data table for Chart 6
| Reading level | ||
|---|---|---|
| Below level 2 | Levels 5 and 6 | |
| percent | ||
| Ireland | 11.8 | 12.1 |
| Canada | 13.8 | 15.0 |
| UK | 17.3 | 11.5 |
| United States | 19.3 | 13.5 |
| Australia | 19.6 | 13.0 |
| OECD average | 22.6 | 8.7 |
| Source: Council of Ministers of Education, Canada, Measuring up: Canadian Results of the OECD PISA 2018 Study. | ||
Canadian students also perform well in mathematics compared to the OECD average (Chart 7). While 16% of Canadian students do not meet the minimum proficiency in mathematics, almost one quarter (24%) of students in OECD countries are in the same situation. Canada was ahead of the United Kingdom, Australia, and the United States on this front. Canada also has a higher proportion of high-performing math students (15%) than these countries, and the OECD as a whole (11%), but a much smaller proportion than is observed in BSJZ China (44%), Singapore (37%) and Hong Kong (29%). Notably, students in Quebec perform particularly well in math (21% achieve the highest levels of proficiency).

Data table for Chart 7
| Mathematics level | ||
|---|---|---|
| Below level 2 | Levels 5 and 6 | |
| percent | ||
| BSJZ ChinaData table for Chart 7 Note 1 | 2.4 | 44.3 |
| Japan | 11.5 | 18.3 |
| Canada | 16.3 | 15.3 |
| UK | 19.2 | 12.9 |
| Australia | 22.4 | 10.5 |
| United States | 27.1 | 8.3 |
| OECD average | 24.0 | 10.9 |
|
||
PISA also allows analysis of math and reading scores by socioeconomic status (SES). In PISA 2018, across all OECD countries, socioeconomically advantaged students (defined as those in the top quarter of SES) outperformed the disadvantaged students (defined as those in the bottom quarter of SES). In Canada, the difference in average score in Canada between the advantaged versus the disadvantaged students is smaller (68 points) than the difference observed at the OECD average (89 points). However, as this measure is relative, it may reflect the fact that there is less inequality in general in Canada than in other OECD countries.
Among all age groups, young adults aged 25 to 34 have the highest levels of literacy and numeracy
The Programme for the International Assessment of Adult Competencies (PIAAC) is another study that measures literacy and numeracy skills, in this case among adults between the ages of 16 and 65.
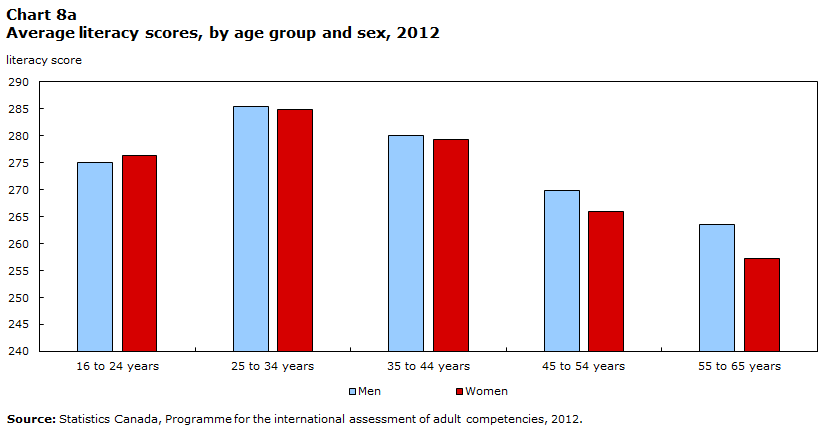
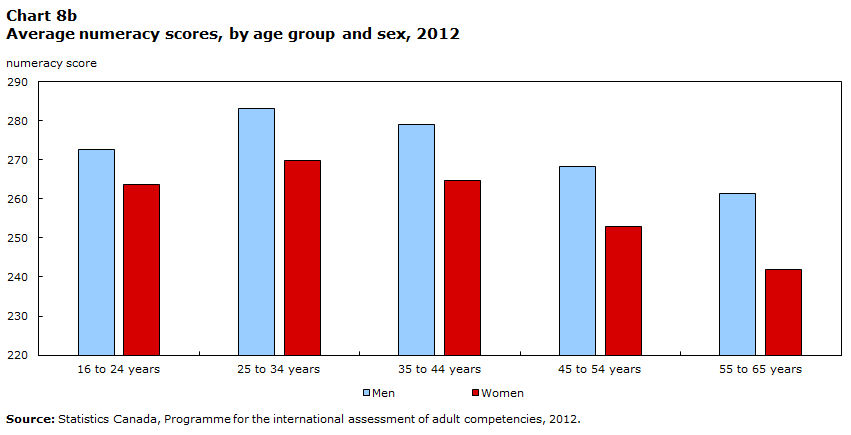
Results from PIAAC show that among all of the age groups, young Canadians aged 25 to 34 have the highest average scores in both literacy and numeracy (Chart 8a and Chart 8b, respectively)—slightly ahead of the 35 to 44 age group.Note The 25 to 34 age group that has the highest proportion that reaches at least level 3 in both literacy and numeracy, meaning that they are able to understand longer, more complex texts with multiple pieces of information.Note For example, 53% of adults aged 25 to 34 possess this level of numeracy, compared to 34% of those aged 55 to 65. This could be because this age group finished their formal schooling more recently and still retain these skills or because a higher of proportion of people in this age range have completed postsecondary education. It could also reflect improvements in the schooling system over time, or a combination of all these factors.
While young men and women have very similar performance in literacy (with both men and women aged 25 to 34 having scores of 285.4 and 284.8 respectively), young men have a higher average score in numeracy at 283.1 compared to 269.9 for young women. This difference between sexes in numeracy scores is also observed for all other age groups.
Data table for Chart 8a
| Men | Women | |
|---|---|---|
| literacy score | ||
| Age group | ||
| 16 to 24 years | 275.1 | 276.4 |
| 25 to 34 years | 285.4 | 284.8 |
| 35 to 44 years | 280.0 | 279.3 |
| 45 to 54 years | 269.9 | 266.0 |
| 55 to 65 years | 263.6 | 257.3 |
| Source: Statistics Canada, Programme for the international assessment of adult competencies, 2012. | ||
Data table for Chart 8b
| Men | Women | |
|---|---|---|
| numeracy score | ||
| Age group | ||
| 16 to 24 years | 272.7 | 263.7 |
| 25 to 34 years | 283.1 | 269.9 |
| 35 to 44 years | 279.1 | 264.7 |
| 45 to 54 years | 268.3 | 253.0 |
| 55 to 65 years | 261.3 | 241.8 |
| Source: Statistics Canada, Programme for the international assessment of adult competencies, 2012. | ||
Young Canadian men aged 16 to 30 compare favourably to other countries in numeracy, and both young men and young women compare favourably in literacy
Table 1 summarizes how young Canadians aged 16 to 30 compare with their counterparts in other countries that participated in the PIAAC in terms of average scores.Note
| Male numeracy | Male literacy | Female numeracy | Female literacy | |
|---|---|---|---|---|
| Average score is statistically above Canada (English)Table 1 Note 1 | Finland, Japan, Netherlands, Singapore, Belgium (Flanders), Austria, Sweden |
Japan, Finland, Netherlands, Korea, Singapore |
Finland, Singapore, Japan, Netherlands, Belgium (Flanders), Czech Republic, Korea, Estonia, Lithuania, Sweden, Slovakia, Denmark, Austria, Germany, Slovenia |
Finland, Japan, Netherlands, Korea, Estonia |
| Average score is not statistically different from Canada (English) | Czech Republic, Germany, Lithuania, Korea, Estonia, Denmark, Slovakia, Norway, Hungary, Australia, Slovenia, New Zealand, France, Russia, Poland, Northern Ireland, England, Cyprus |
Belgium (Flanders), Sweden, Estonia, Australia, Czech Republic, Germany, Austria, New Zealand, Poland, Norway, Slovakia, Denmark, Lithuania, France, United States, Hungary, Ireland, Northern Ireland, England |
Hungary, Norway, Russia, Poland, Cyprus, Australia, New Zealand, France, Northern Ireland |
Belgium (Flanders), Singapore, Sweden, Poland, Australia, Norway, Czech Republic, Denmark, Germany, New Zealand, Lithuania, France, United States, Austria, Slovakia, Slovenia, Russia, Hungary, Cyprus |
| Average score is statistically below Canada (English) | Ireland, United States, Spain, Italy, Israel, Greece, Kazakhstan, Turkey, Chile, Mexico, Peru, Ecuador |
Slovenia, Cyprus, Russia, Spain, Israel, Italy, Greece, Kazakhstan, Turkey, Chile, Mexico, Peru, Ecuador |
Israel, Ireland, United States, Italy, England, Spain, Greece, Kazakhstan, Turkey, Mexico, Chile, Peru, Ecuador |
Ireland, Northern Ireland, Israel, England, Italy, Spain, Greece, Kazakhstan, Turkey, Mexico, Chile, Peru, Ecuador |
|
||||
Start of text box
The academic effects of COVID-19 on postsecondary studentsNote
As mentioned above, from April 19 to May 1 2020, Statistics Canada conducted an online crowdsourcing data collection of over 100,000 students to find out how they felt the pandemic was impacting their academic, labour market and financial situation.Note At this point in the pandemic, just over a quarter (26%) of students reported that their courses were either postponed or cancelled, due to the public health measures implemented to combat the spread of the COVID-19 pandemic. This proportion was similar among those who were studying towards a college or CEGEP diploma (25%), an undergraduate degree (26%) or a master’s or professional degree (28%) but lower among doctoral candidates (14%).
This disruption also varied by field of study (Chart 9). It was highest for those studying in services (56%), trades (53%) or health care (41%). This was probably because these fields of study are more likely to include job placements or course work that requires hands-on instruction that cannot be delivered online.

Data table for Chart 9
| percent | |
|---|---|
| Field of study | |
| Arts, humanities and social sciences | 25.0 |
| Business and administration | 18.0 |
| Health care | 41.0 |
| Education | 25.0 |
| Law | 25.0 |
| Science | 24.0 |
| Engineering and engineering technology | 18.0 |
| Math and computer science | 18.0 |
| Services | 56.0 |
| Trades | 53.0 |
| Source: Statistics Canada, Impacts of the COVID-19 pandemic on postsecondary students, 2020. | |
Almost all of the participants at this point in the pandemic reported that some or all of their courses had been moved online, with small proportions reporting that none of their courses had moved online (2%) or that they were not taking courses, as they were working on a thesis or on a work placement (6%).
The move to online learning, however, was not smooth for everyone. Among participants who reported that their courses had moved online, 7% reported that they were unable to complete some or all of these courses. This proportion was slightly higher for those studying towards a college or CEGEP diploma (9%) compared with those studying at the undergraduate level (7%), a master’s or professional degree (6%) or a doctorate (6%). Notably, among participants studying towards the trades, this proportion was higher at 13%.
End of text box
Student debt has remained steady over the past 15 years, except for professional degree-holders
In order to finance their postsecondary studies, young people often take out student loans. In 2018, just over half (54%) of graduates aged 15 to 30 years old graduated with student debt. This proportion was slightly higher for women (55%) than it was for men (52%), and slightly lower for youth belonging to groups designated as visible minorities (51%), especially Black youth (47%). The average student debt owed at graduation for those with debt was $23,000. This figure was slightly higher for women ($24,000) and graduates designated as visible minorities ($25,000) but lower for Black graduates ($19,700).Note
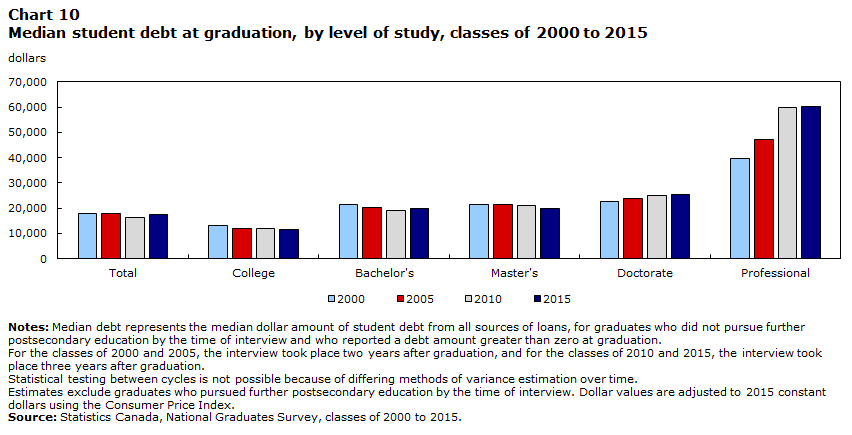
A recent studyNote has shown that both the proportion of graduates with debt and their average debt has remained relatively stable since 2000, with the exception of professional degree graduates, which have seen a gradual increase in median student debt over this period (Chart 10). This is related to the increasing costs of these programs. By 2014/2015, tuition fees for programs such as dentistry ($18,118), medicine ($12,987), pharmacy ($11,273) and law ($10,563) were much higher than those for all other fields of study ($5,998).
Data table for Chart 10
| Year of graduation | ||||
|---|---|---|---|---|
| 2000 | 2005 | 2010 | 2015 | |
| dollars | ||||
| Level of study | ||||
| Total | 17,914 | 17,745 | 16,241 | 17,496 |
| College | 13,270 | 11,830 | 11,917 | 11,467 |
| Bachelor's | 21,232 | 20,111 | 19,164 | 20,004 |
| Master's | 21,232 | 21,294 | 20,832 | 19,735 |
| Doctorate | 22,559 | 23,660 | 24,951 | 25,401 |
| Professional | 39,810 | 47,320 | 59,687 | 60,287 |
|
Notes: Median debt represents the median dollar amount of student debt from all sources of loans, for graduates who did not pursue further postsecondary education by the time of interview and who reported a debt amount greater than zero at graduation. For the classes of 2000 and 2005, the interview took place two years after graduation, and for the classes of 2010 and 2015, the interview took place three years after graduation. Statistical testing between cycles is not possible because of differing methods of variance estimation over time. Estimates exclude graduates who pursued further postsecondary education by the time of interview. Dollar values are adjusted to 2015 constant dollars using the Consumer Price Index. Source: Statistics Canada, National Graduates Survey, classes of 2000 to 2015. |
||||
A higher proportion of postsecondary-educated young adults are employed
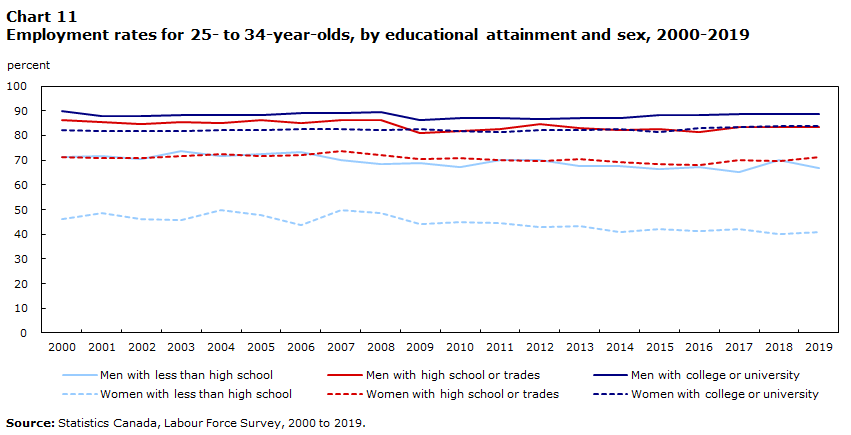
As the proportion of young adults with a postsecondary education has risen, just over half have taken on student debt to finance their studies. Spending time in school rather than in the labour market, and acquiring debt to do so in many cases, may be a sensible investment if the payoff justifies the cost. Chart 11 suggests that this is the case, showing employment rates among Canadians aged 25 to 34. While there has been some variation in the employment rates over time for all of the groups presented in Chart 11, the differences between employment rates by level of education are mostly constant over time, with employment rates rising as education level does.
One exception is women without a high school diploma, whose employment levels have dropped from a high of 50% in 2004 to 41% in 2019. For these women, the difference between their employment rates and the employment rates of women at other education levels has widened.
Data table for Chart 11
| Level of educational attainment and sex | ||||||
|---|---|---|---|---|---|---|
| Men with less than high school | Men with high school or trades | Men with college or university | Women with less than high school | Women with high school or trades | Women with college or university | |
| percent | ||||||
| Year | ||||||
| 2000 | 71.2 | 86.2 | 89.7 | 46.1 | 71.3 | 82.3 |
| 2001 | 71.8 | 85.6 | 88.1 | 48.5 | 71.0 | 81.8 |
| 2002 | 70.3 | 84.5 | 87.9 | 46.1 | 71.1 | 81.8 |
| 2003 | 73.6 | 85.5 | 88.1 | 45.9 | 71.6 | 81.9 |
| 2004 | 71.9 | 85.1 | 88.4 | 49.7 | 72.6 | 82.2 |
| 2005 | 72.3 | 86.2 | 88.1 | 47.6 | 71.7 | 82.1 |
| 2006 | 73.4 | 85.2 | 88.9 | 43.8 | 72.1 | 82.7 |
| 2007 | 70.1 | 86.2 | 89.0 | 49.7 | 73.7 | 82.7 |
| 2008 | 68.3 | 86.3 | 89.4 | 48.6 | 72.2 | 82.3 |
| 2009 | 68.7 | 80.9 | 86.4 | 44.3 | 70.5 | 82.7 |
| 2010 | 67.1 | 81.7 | 87.1 | 45.0 | 70.8 | 81.7 |
| 2011 | 70.1 | 82.8 | 87.0 | 44.4 | 70.1 | 81.4 |
| 2012 | 70.1 | 84.5 | 86.7 | 43.0 | 69.8 | 82.3 |
| 2013 | 67.6 | 83.2 | 87.1 | 43.3 | 70.6 | 82.2 |
| 2014 | 67.6 | 82.2 | 87.0 | 41.0 | 69.3 | 82.8 |
| 2015 | 66.5 | 82.6 | 88.4 | 42.3 | 68.3 | 81.5 |
| 2016 | 67.1 | 81.3 | 88.3 | 41.4 | 68.2 | 83.2 |
| 2017 | 65.2 | 83.3 | 88.7 | 42.1 | 70.0 | 83.5 |
| 2018 | 70.1 | 83.5 | 88.6 | 40.0 | 69.8 | 83.9 |
| 2019 | 67.0 | 83.3 | 88.5 | 40.8 | 71.1 | 83.7 |
| Source: Statistics Canada, Labour Force Survey, 2000 to 2019. | ||||||
Chart 11 also shows a significant difference in employment rates for men and women. Taking the most recent year (2019) as an example, the difference between sexes is largest for young adults who do not have a high school diploma—67% of men without a high school diploma were employed, compared to 41% of women. While college or university educated men also have higher employment rates (89%) than their similarly educated female counterparts (84%), the difference is smaller.
Earning trajectories for postsecondary graduates still higher
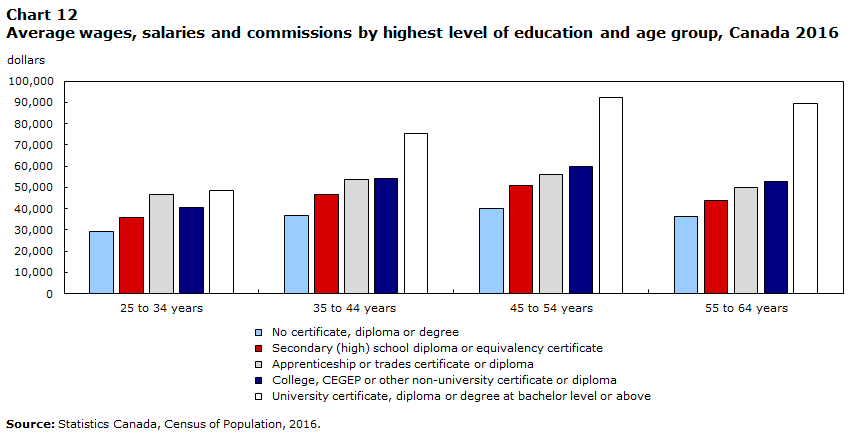
Not only do postsecondary graduates have higher employment rates, but they also have higher average earnings. As seen in Chart 12, there is a positive association between educational attainment and earnings. In addition, the earnings premium associated with a university education is higher among older workers. For example, university educated workers aged 55 to 64 earn on average $52,782 more than high school graduates in the same age group. By contrast, university graduates aged 25 to 34 earned on average $18,868 more than similarly aged secondary school graduates.Note
With an increasing proportion of young people holding a postsecondary credential, there could be an over-supply of postsecondary graduates on the labour market, and potentially lower income trajectories. However, a recent longitudinal analysisNote of the earnings of young people who have entered the labour market more recently than a previous cohort reveals that this has not been the case.
The study found that when comparing young postsecondary graduates who were 26 to 35 years old in 2001 versus graduates who were the same age in 1991, the more recent cohort had higher median cumulative earnings.Note This proved to be true at all postsecondary levels and across most major disciplines.
Charts 13 and 14 present the median annual earnings for individuals with a high school diploma and individuals with a bachelor’s degree during a 15-year follow up period (until they reached 40 to 49 years of age). Annual earnings during each of those 15 years were greater among the more recent cohort of male bachelor’s degree graduates, while no substantial differences are observed between the two cohorts of male high school graduates. For women, earnings were higher among the more recent cohort for high school graduates and bachelor’s degree graduates, although the difference was larger among bachelor’s degree graduates. The study notes that men earned more than women across all education levels and fields of study. While many factors could be responsible for this earnings difference, it is important to note that individuals who did not work or who worked part-time were included in the sample and therefore these differences in earnings will be sensitive to differences in hours worked.
Data table for Chart 12
| Level of educational attainment | |||||
|---|---|---|---|---|---|
| No certificate, diploma or degree | Secondary (high) school diploma or equivalency certificate |
Apprenticeship or trades certificate or diploma |
College, CEGEP or other non-university certificate or diploma |
University certificate, diploma or degree at bachelor level or above |
|
| dollars | |||||
| Age group | |||||
| 25 to 34 years | 29,420 | 35,706 | 46,737 | 40,728 | 48,288 |
| 35 to 44 years | 36,693 | 46,638 | 53,605 | 53,931 | 75,315 |
| 45 to 54 years | 39,808 | 50,869 | 55,937 | 59,957 | 92,486 |
| 55 to 64 years | 36,462 | 43,846 | 50,116 | 52,596 | 89,244 |
| Source: Statistics Canada, Census of Population, 2016. | |||||

Data table for Chart 13
| Years since start of cohort | |||||||||||||||
|---|---|---|---|---|---|---|---|---|---|---|---|---|---|---|---|
| 0 | 1 | 2 | 3 | 4 | 5 | 6 | 7 | 8 | 9 | 10 | 11 | 12 | 13 | 14 | |
| 2015 constant dollars | |||||||||||||||
| Cohort and sex | |||||||||||||||
| 1991 cohort men | 41,885 | 42,954 | 43,446 | 45,137 | 45,748 | 46,141 | 47,111 | 48,625 | 49,261 | 50,162 | 50,135 | 50,694 | 50,561 | 51,251 | 51,498 |
| 2001 cohort men | 41,643 | 42,891 | 43,907 | 45,315 | 46,409 | 47,440 | 48,532 | 49,264 | 48,225 | 49,308 | 50,054 | 50,854 | 51,712 | 52,124 | 52,076 |
| 1991 cohort women | 15,472 | 15,674 | 15,429 | 16,049 | 16,754 | 17,297 | 18,688 | 20,594 | 21,804 | 23,306 | 24,152 | 25,006 | 25,504 | 26,441 | 26,814 |
| 2001 cohort women | 17,680 | 17,880 | 18,653 | 19,290 | 19,763 | 21,086 | 22,327 | 23,337 | 23,982 | 24,921 | 25,660 | 26,483 | 27,250 | 27,775 | 28,490 |
| Source: Statistics Canada, Census of Population - T1 Personal Master files. | |||||||||||||||

Data table for Chart 14
| Years since start of cohort | |||||||||||||||
|---|---|---|---|---|---|---|---|---|---|---|---|---|---|---|---|
| 0 | 1 | 2 | 3 | 4 | 5 | 6 | 7 | 8 | 9 | 10 | 11 | 12 | 13 | 14 | |
| 2015 constant dollars | |||||||||||||||
| Cohort and sex | |||||||||||||||
| 1991 cohort men | 64,023 | 67,164 | 68,698 | 71,692 | 73,705 | 75,786 | 78,262 | 81,437 | 84,438 | 87,329 | 89,008 | 90,192 | 90,562 | 92,008 | 93,783 |
| 2001 cohort men | 67,710 | 71,145 | 73,512 | 77,406 | 80,456 | 83,279 | 85,846 | 88,410 | 89,948 | 90,704 | 91,902 | 93,020 | 95,110 | 95,518 | 96,213 |
| 1991 cohort women | 40,951 | 41,660 | 41,467 | 42,490 | 43,356 | 44,729 | 45,724 | 48,726 | 50,422 | 52,479 | 52,952 | 54,766 | 55,820 | 57,173 | 58,634 |
| 2001 cohort women | 45,482 | 45,403 | 46,305 | 47,536 | 48,484 | 50,339 | 52,457 | 54,844 | 57,519 | 59,265 | 60,819 | 62,548 | 64,824 | 65,830 | 67,500 |
| Source: Statistics Canada, Census of Population - T1 Personal Master files. | |||||||||||||||
In general, higher levels of education are associated with higher median cumulative earnings. For example, male bachelor’s degree graduates in the more recent cohort earned $1,292,247 over the 15-year period. By contrast, male high school graduates earned $723,499 (a difference of $568,748). For women in the same education categories, the gap was $472,270. These earnings differences ($568,748 and $472,270) are substantially larger than the average debt levels at graduation among postsecondary graduates ($23,000 among those with debt, and roughly half that among all graduates when those with no debt are included). Moreover, the cumulative earnings differences shown in the study typically only cover about half of a typical career.Note
Start of text box
The financial impacts of COVID-19 on recent graduates: potential earnings lossesNote
In the wake of the COVID-19 pandemic and the lockdowns that followed to curb the spread of the virus, there has been an economic slowdown in Canada. Normally during recessions, new entrants to the labour market experience the greatest rises in unemployment rates. A less than favourable start to one’s career may have implications not only in the short term, but also in the long term, as graduates may not be matched favourably to jobs at the outset of their career.
Early in the pandemic, a study examined what might happen to the earnings of the class of 2020 depending on the youth unemployment rate during the entirety of 2020. It found that if the rate remained close to the historic highs registered during the early part of the pandemic (i.e., 28%), then the class of 2020 could lose $25,000 or more over the next five years. However, if the youth unemployment rate was somewhat lower at 19% (where it is right now), potential losses could range from $8,000 to $15,000. The study also found that female graduates may be hit harder than their male counterparts, as could high school graduates compared to postsecondary graduates.
End of text box
Conclusion
The proportion of young Canadians aged 25 to 34 who have a postsecondary qualification is at an all-time high of 73%. In addition, this age group has the highest average literacy and numeracy scores, compared with all other age groups. Young Canadians are highly educated and compare favourably to their counterparts in other OECD countries in terms of both educational attainment and literacy.
However, significant differences remain in levels of education among population groups. For example, the proportion of youth not in a group designated as a visible minority (9%) and Black youth (8%) who have not attained a high school diploma is higher than for other groups such as South Asian (3%) and Chinese youth (2%). In addition, while both sexes have experienced an increase in university attainment, it is more pronounced among young women. Finally, while there have also been some gains in postsecondary participation for youth from the lowest income quintiles, and it has been faster than the gains for those at higher income quintiles, a substantial gap still remains between these groups.
In order to finance their studies, at least half of postsecondary graduates reported that they took on debt. These student debt levels have remained fairly constant over the past 15 years or so, with the exception of those studying in professional degrees, who registered increasing average debt levels over the same time period.
Nevertheless, once they reach the labour market, postsecondary graduates have higher employment levels and higher average and median incomes. This has remained true even with an increasing proportion of young people attaining a postsecondary education. In general, the cumulative earnings premium associated with a postsecondary education is far greater than the average student debt levels.
The COVID-19 pandemic has proven to have multiple effects on Canadian youth and their postsecondary education experiences. Young people who were in postsecondary education during the pandemic had their classes quickly moved online, and for those whose fields of study did not allow for online study (for example, disciplines that require a work or lab component) this has proved to be particularly challenging. Financially, with fewer opportunities to earn money, young people have indicated that they are concerned about how they will finance their education. Finally, with an uncertain near-term economic future, young graduates arriving on the labour market in this environment may see earnings losses, which may continue years after the end of the pandemic and the economic crisis in its wake.
- Date modified: