
Portrait of Youth in Canada: Data Report
Chapter 2: Youth employment in Canada
Skip to text
Text begins
Start of text box
- Young Canadians have had diverse trajectories in the labour market over the last four decades.
- From the early 1980s to 2019, young women substantially increased their presence in the labour market and saw strong wage growth when employed full-time.
- In contrast, the percentage of young men who are employed and the pay rates of young men in full-time jobs were fairly similar in 2019 and in the early 1980s.
- While young men and young women had fairly similar employment rates in 2019, young women still earned—despite their higher educational attainment—lower wages than young men.
- Compared with their less educated counterparts, highly educated young Canadians were more likely to have a job in 2019, were more likely to hold full-time permanent paid positions, and were paid higher wages.
- For both young men and young women, employment has become more precarious since the late 1980s.
End of text box
Introduction
The Canadian labour market has seen many changes over the last few decades. Digital technologies have changed the content of a number of jobs. International trade with emerging countries has risen. As a result of automation, international competition, and firms deciding to relocate abroad, the share of jobs in manufacturing has dropped. Unionization rates have fallen. Minimum wages have fluctuated. Women, especially those over 40, have entered the labour market in growing numbers. Men and—to a greater extent—women have increased their educational attainment. The Internet has allowed increased numbers of employers and job seekers to connect with each other and has also fostered the emergence of gig employment. Recent developments in artificial intelligence have led to the growing use of robots in many industries.
In this evolving context, how have young Canadians—those aged 15 to 30—fared in the labour market? How have the types of jobs they hold and the pay rates they receive changed over time? Which groups were doing fairly well in 2019, prior to the COVID-19 pandemic? Using Statistics Canada data, this chapter provides answers to these questions. Comparisons to older Canadians and trends over the last four decades are provided for context. When possible, labour market indicators are also examined by sex, education, and immigration status. Employment among First Nations, Métis and Inuit youth will be examined in a forthcoming dedicated chapter on Indigenous youth, which will include a broad range of demographic, health and socio-economic statistics on First Nations, Métis and Inuit youth.
In March 2020, physical distancing and school and business closures were put in place to slow the spread of COVID-19. In the spring of 2021, Canada is facing a third wave of new cases, and public health measures aimed at containing the virus continue to affect the Canadian labour market. Given these developments, it is important to examine the impact of these measures while discussing youth employment. For this reason, this chapter also highlights some of the short-term consequences that COVID-19 has had on youth employment.
Youth aged 15 to 30 are less likely to have a job than older canadians
Part of the difference is due to youth school enrollment
The percentage of Canadians who are employed varies across age groups. Overall, Canadian youth aged 15 to 30 are less likely to have a job than older Canadians. In 2019, the employment rate of young Canadians—the percentage of the youth population who is employed—was 67.3%, lower than that of their counterparts aged 31 to 44 (83.7%) or aged 45 to 54 (83.6%) (Chart 1).Note 1
Several factors underlie lower employment rates for youth. Young Canadians participate less often in the labour market, largely because they often attend school on a full-time basis. When they do participate in the labour market, they are more likely to be unemployed. This is the case for several reasons. Because they often have been hired last, young workers are often the first workers to be laid off when firms need to downsize. Young Canadians are also at the beginning of their career and often search for new positions that match their skills. This job search process is time-consuming and may require spending some time unemployed. Lastly, because young applicants have accumulated relatively little job experience, employers may not consider young people when they apply for new positions.
Because young Canadians, and particularly those 19 and younger, are significantly less likely to be employed because they are in school full-time, the differences in employment rates narrow substantially when full-time students are excluded. Of all young Canadians not in school full-time, four in five (79.7%) had a job in 2019. The corresponding percentages varied between 84% and 85% for individuals aged 31 to 44 or aged 45 to 54.
Nevertheless, the unemployment rates—the percentage of labour market participants without a job and looking for one—for youth remain higher than those of older individuals, even when full-time students are excluded. This confirms that the lower overall employment rates of young Canadians are not solely because they are more likely to attend school.
While employment rates are lower for youth than for older Canadians, they vary substantially across age groups among young people. Among youth not in school full-time, 60.2% of those aged 15 to 19 were employed in 2019. The corresponding percentage for their counterparts aged 20 to 24 was 79.8%. The employment rate of young individuals aged 25 to 30 was 84.2%, very similar to that observed for individuals aged 31 to 44 (84.9%).

Data table for Chart 1
| All individuals | Excluding full-time students | |||||
|---|---|---|---|---|---|---|
| Employment rate | Participation rate | Unemployment rate | Employment rate | Participation rate | Unemployment rate | |
| percent | ||||||
| 15 to 30 | 67.3 | 73.7 | 8.7 | 79.7 | 87.0 | 8.3 |
| 31 to 44 | 83.7 | 87.8 | 4.6 | 84.9 | 89.0 | 4.6 |
| 45 to 54 | 83.6 | 87.1 | 4.0 | 84.0 | 87.5 | 4.0 |
| 15 to 19 | 43.2 | 50.7 | 14.7 | 60.2 | 71.9 | 16.3 |
| 20 to 24 | 70.2 | 77.1 | 8.9 | 79.8 | 88.1 | 9.5 |
| 25 to 30 | 81.2 | 86.6 | 6.2 | 84.2 | 89.7 | 6.2 |
| Source: Statistics Canada, Labour Force Survey. | ||||||
Youth employment rates vary substantially across education levels
Employment rates also vary across other groups of young Canadians. For example, young Canadian-born individuals were, regardless of their student status, employed slightly more often than young immigrants in 2019 (Chart 2). Young men and young women had virtually identical employment rates overall, but among those not in school full-time, young men had slightly higher employment rates (80.5%) than young women (78.8%).
Far greater differences are observed across education levels, with highly educated youth having higher employment rates than their less educated counterparts. For example, almost nine in ten (88.9%) young bachelor degree holders not in school full-time were employed in 2019. In contrast, only 52.2% of their counterparts with no high school diploma had a job that year.Note 2 Differences across education levels remain substantial when focusing on youth aged 25 to 30.Note 3 They highlight an important fact: in general, highly educated young individuals fare better in the Canadian labour market than their less educated counterparts.Note 4 The same is true for older individuals.Note 5

Data table for Chart 2
| Men | Women | Less than high school | High school | Post-secondary certificate or diploma | Bachelor's degree | Above bachelor's degree | Canadian-born | Immigrant | |
|---|---|---|---|---|---|---|---|---|---|
| percent | |||||||||
| All | 67.3 | 67.4 | 39.3 | 64.3 | 82.8 | 83.4 | 81.7 | 68.7 | 64.5 |
| Excluding full-time students | 80.5 | 78.8 | 52.2 | 75.4 | 87.9 | 88.9 | 87.1 | 80.6 | 77.2 |
| Source: Statistics Canada, Labour Force Survey. | |||||||||
The employment rates of young men and young women followed different trajectories since the mid-1970s
The employment rates of the young Canadians who were not in school full-time have fluctuated over the last four decades. During the 1981–1982 recession, the 1990–1992 recession and, to a lesser extent, the 2008–2009 recession, the percentage of employed young men fell (Chart 3). Recessions also reduced the employment rates of older men, but the declines for them were smaller.Note 6 Nevertheless, the employment rates of young men who were not full-time students hovered around 80% from 1976 to 2019 and, like those of older men, displayed a slight downward trend. Throughout that period, young men had lower employment rates than older men.

Data table for Chart 3
| Employment rate | Unemployment rate | |||||||||||
|---|---|---|---|---|---|---|---|---|---|---|---|---|
| Men | Women | Men | Women | |||||||||
| 15 to 30 | 31 to 44 | 45 to 54 | 15 to 30 | 31 to 44 | 45 to 54 | 15 to 30 | 31 to 44 | 45 to 54 | 15 to 30 | 31 to 44 | 45 to 54 | |
| percent | ||||||||||||
| 1976 | 83.0 | 92.5 | 89.0 | 58.2 | 49.2 | 45.6 | 10.3 | 4.0 | 3.6 | 10.9 | 6.7 | 5.3 |
| 1977 | 82.0 | 91.6 | 87.9 | 58.8 | 50.7 | 45.4 | 11.5 | 4.6 | 4.4 | 12.1 | 7.4 | 6.4 |
| 1978 | 82.4 | 91.5 | 88.0 | 60.5 | 52.9 | 46.6 | 11.5 | 4.9 | 4.8 | 12.4 | 7.9 | 6.6 |
| 1979 | 83.6 | 92.4 | 88.3 | 62.7 | 54.9 | 48.3 | 10.5 | 4.2 | 4.1 | 11.2 | 7.2 | 6.0 |
| 1980 | 83.1 | 91.8 | 88.2 | 64.3 | 57.2 | 49.9 | 10.9 | 4.6 | 4.2 | 10.8 | 6.5 | 6.2 |
| 1981 | 82.9 | 91.8 | 88.4 | 65.7 | 59.8 | 51.9 | 11.1 | 4.6 | 4.3 | 10.8 | 6.7 | 5.6 |
| 1982 | 75.9 | 87.8 | 85.2 | 63.0 | 59.6 | 51.5 | 17.3 | 8.0 | 6.9 | 14.0 | 9.1 | 7.4 |
| 1983 | 74.5 | 86.7 | 84.9 | 63.7 | 60.3 | 52.9 | 18.7 | 9.0 | 7.6 | 14.8 | 9.7 | 8.1 |
| 1984 | 76.8 | 87.1 | 84.1 | 64.7 | 62.3 | 53.4 | 16.7 | 8.6 | 7.4 | 14.3 | 9.7 | 8.6 |
| 1985 | 78.8 | 87.9 | 84.6 | 67.0 | 63.7 | 56.5 | 14.9 | 7.9 | 6.9 | 13.1 | 9.6 | 7.7 |
| 1986 | 79.9 | 88.7 | 85.9 | 69.0 | 66.7 | 56.2 | 14.0 | 7.1 | 5.9 | 12.2 | 8.6 | 7.4 |
| 1987 | 82.1 | 89.0 | 86.8 | 70.3 | 67.9 | 58.7 | 12.0 | 6.7 | 5.8 | 11.2 | 8.3 | 7.6 |
| 1988 | 83.5 | 89.7 | 86.8 | 71.5 | 70.4 | 61.6 | 10.6 | 5.9 | 4.9 | 10.1 | 7.4 | 6.9 |
| 1989 | 84.0 | 89.3 | 87.0 | 72.4 | 71.5 | 63.5 | 10.2 | 6.0 | 4.9 | 9.6 | 7.5 | 5.9 |
| 1990 | 81.7 | 88.5 | 85.7 | 72.0 | 72.6 | 64.1 | 11.8 | 6.8 | 5.7 | 10.3 | 7.4 | 6.5 |
| 1991 | 76.8 | 86.1 | 84.3 | 70.1 | 71.9 | 64.5 | 16.5 | 8.8 | 7.1 | 12.3 | 8.7 | 8.0 |
| 1992 | 75.1 | 84.1 | 82.8 | 69.0 | 70.7 | 65.5 | 17.5 | 10.3 | 8.1 | 12.8 | 9.3 | 8.1 |
| 1993 | 75.2 | 84.3 | 82.3 | 67.8 | 70.8 | 65.6 | 17.1 | 10.2 | 8.4 | 13.3 | 9.8 | 8.8 |
| 1994 | 76.4 | 85.0 | 82.9 | 68.8 | 71.2 | 66.1 | 15.6 | 9.3 | 8.0 | 12.2 | 9.3 | 7.7 |
| 1995 | 77.6 | 85.5 | 83.3 | 68.9 | 72.2 | 67.2 | 14.1 | 8.5 | 7.1 | 12.0 | 8.3 | 7.2 |
| 1996 | 77.3 | 85.1 | 82.8 | 69.1 | 72.4 | 66.6 | 14.0 | 8.8 | 7.2 | 11.9 | 8.6 | 7.4 |
| 1997 | 78.4 | 86.3 | 83.1 | 69.7 | 73.5 | 68.5 | 13.2 | 7.9 | 6.6 | 11.6 | 8.0 | 6.6 |
| 1998 | 79.3 | 87.1 | 83.2 | 71.5 | 74.4 | 70.1 | 12.4 | 7.0 | 6.3 | 10.5 | 7.0 | 6.0 |
| 1999 | 80.5 | 87.5 | 84.0 | 73.1 | 75.4 | 71.1 | 11.3 | 6.6 | 5.6 | 9.4 | 6.5 | 5.6 |
| 2000 | 81.3 | 88.1 | 84.6 | 73.8 | 76.3 | 71.8 | 10.2 | 5.7 | 5.1 | 8.9 | 5.8 | 5.2 |
| 2001 | 80.6 | 87.7 | 84.2 | 74.6 | 76.4 | 72.6 | 11.0 | 6.3 | 5.4 | 8.6 | 6.2 | 5.4 |
| 2002 | 80.4 | 87.5 | 84.6 | 75.1 | 77.1 | 74.6 | 11.6 | 6.7 | 6.0 | 9.2 | 6.6 | 5.3 |
| 2003 | 80.4 | 87.9 | 84.8 | 75.8 | 77.5 | 75.9 | 11.7 | 6.4 | 5.9 | 9.3 | 6.7 | 5.4 |
| 2004 | 80.4 | 88.4 | 85.6 | 76.2 | 78.3 | 76.5 | 11.4 | 6.0 | 5.2 | 8.8 | 6.3 | 5.0 |
| 2005 | 81.2 | 88.7 | 85.3 | 76.3 | 78.4 | 76.0 | 10.2 | 5.7 | 5.3 | 8.2 | 5.8 | 5.2 |
| 2006 | 81.8 | 88.7 | 85.2 | 77.4 | 78.2 | 76.6 | 9.4 | 5.4 | 4.8 | 7.6 | 5.6 | 4.6 |
| 2007 | 82.3 | 88.8 | 85.3 | 77.5 | 79.4 | 77.5 | 9.3 | 5.2 | 4.7 | 7.2 | 5.2 | 4.4 |
| 2008 | 81.9 | 88.8 | 85.6 | 77.2 | 79.1 | 77.9 | 9.5 | 5.4 | 5.1 | 7.5 | 4.9 | 4.5 |
| 2009 | 77.6 | 85.8 | 83.4 | 75.9 | 78.3 | 77.1 | 13.6 | 8.0 | 7.4 | 9.2 | 6.5 | 5.6 |
| 2010 | 78.0 | 86.4 | 83.5 | 75.6 | 77.8 | 77.6 | 12.6 | 7.1 | 7.0 | 9.5 | 6.9 | 5.7 |
| 2011 | 79.2 | 87.6 | 84.5 | 75.4 | 78.4 | 77.7 | 11.4 | 6.1 | 6.2 | 9.3 | 6.2 | 5.5 |
| 2012 | 79.3 | 88.1 | 83.9 | 75.4 | 78.8 | 78.3 | 11.2 | 5.8 | 6.1 | 9.2 | 5.9 | 5.3 |
| 2013 | 79.4 | 88.1 | 84.3 | 75.8 | 79.8 | 77.9 | 10.9 | 5.7 | 5.9 | 8.9 | 5.4 | 5.5 |
| 2014 | 78.5 | 87.8 | 84.8 | 75.8 | 78.9 | 77.3 | 11.3 | 5.6 | 5.3 | 8.5 | 5.4 | 5.3 |
| 2015 | 79.2 | 88.2 | 84.4 | 75.9 | 78.8 | 78.5 | 11.0 | 5.8 | 5.9 | 8.4 | 5.4 | 5.0 |
| 2016 | 78.9 | 88.0 | 84.3 | 76.8 | 78.6 | 77.8 | 11.2 | 6.0 | 6.1 | 8.3 | 5.4 | 5.1 |
| 2017 | 80.1 | 88.7 | 85.5 | 77.8 | 79.8 | 78.4 | 9.9 | 5.1 | 5.2 | 7.6 | 5.0 | 5.1 |
| 2018 | 80.5 | 89.1 | 85.4 | 78.1 | 79.9 | 79.3 | 9.0 | 4.6 | 4.6 | 7.1 | 4.9 | 4.8 |
| 2019 | 80.5 | 89.1 | 87.2 | 78.8 | 80.6 | 80.8 | 9.2 | 4.7 | 4.1 | 7.4 | 4.4 | 4.0 |
| 2020 | 72.1 | 85.7 | 84.6 | 71.0 | 77.0 | 77.2 | 15.5 | 7.3 | 6.2 | 13.7 | 7.6 | 6.9 |
| Source: Statistics Canada, Labour Force Survey | ||||||||||||
Young women who were not enrolled in school full-time also saw their employment rates fall during recessions, but these declines were less pronounced than those experienced by their male counterparts. While the employment rates of young men showed no discernible trend over the last few decades, the employment rates of young women trended upwards from 1976 to the early 2000s, thanks mainly to their growing participation in the labour market. By 2019, 78.8% of young women were employed, up from 58.2% in 1976. The employment rates of older women increased even more. By 2019, roughly four in five women aged 31 to 54 were employed. Young women and older women displayed fairly similar employment rates that year.
Chart 3 also highlights an important pattern. From 1976 to 2019, the unemployment rate of young men displayed no discernible trend. By 2019, 9.2% of young men not in school full-time were unemployed, a slightly lower percentage than the rate of 10.3% observed in 1976. In contrast, the unemployment rate of young women trended downwards from 1976 to 2019. It stood at 7.4% in 2019, fully 3.5 percentage points lower than its 10.9% value in 1976.
Things changed drastically in the wake of the COVID-19 pandemic. Partly because they were over-represented in industries that were hit hard by the economic lockdowns, such as accommodation and food services or arts, entertainment and recreation, young Canadians were more affected by the 2020 labour market downturn than older Canadians. For example, the employment rates of young women not in school full-time fell by about 8 percentage points, dropping from 78.8% in 2019 to 71.0% in 2020. The corresponding percentages were 80.5% and 72.1% for young men. In contrast, the employment rates of older workers fell by roughly 4 percentage points from 2019 to 2020.
As a result, youth unemployment increased substantially. Young men and young women who were not in school full-time saw their unemployment rates increase by about 6 percentage points from 2019 to 2020 (Chart 3).Note 7 In contrast, their counterparts aged 31 to 44 or aged 45 to 54 saw increases in unemployment rates that varied between 2 and 3 percentage points. By 2020, the unemployment rates of young men and young women stood at 15.5% and 13.7%, respectively. While relatively high, these rates were somewhat lower than their peak values of 18.7% and 14.8%, observed in 1983. Nevertheless, they raise the possibility that young high-school and postsecondary graduates who entered the labour market in 2020 or will do so in 2021 might receive lower earnings in the years following graduation than they would have had in a more dynamic labour market.Note 8
Start of text box
Some young Canadians combine school and work. In 2019, 38.4% of women aged 15 to 19 who were full-time students had a job during school months (defined in this chapter as ranging from January to April and from September to December). Almost one-third (31.6%) of their male counterparts also had a job. In contrast, more than half (54.2%) of female full-time students aged 20 to 24 were employed, compared with 41.7% of male full-time students in the same age group. The percentages of male and female full-time students aged 25 to 30 holding a job amounted to 43.4% and 49.3%, respectively.
Regardless of age, most of the jobs students hold are part-time jobs, i.e., they involve less than 30 hours per week. For example, more than 95% of the jobs held in 2019 by full-time students aged 15 to 19 involved part-time work. In contrast, close to one-third of the jobs held by their counterparts aged 25 to 30 were full-time jobs, i.e., they involved at least 30 hours per week.
End of text box
Young canadians are now employed in precarious jobs to a greater extent than their counterparts were in the late 1980s
Differences in the types of jobs held by young and older Canadians narrow when full-time students are excluded
Young Canadians hold different types of jobs. Along with their older counterparts, the majority of young workers aged 15 to 30 are employees holding full-time permanent jobs, i.e., jobs that involve at least 30 hours per week (full-time) and have no predetermined end date (permanent). In 2019, 54.4% of young workers were in this situation (Chart 4). A second group (39.6%) consisted of other employees who held either part-time jobs—jobs involving less than 30 hours per week—or non-permanent jobs. A minority of young workers, 5.8%, were self-employed. The remainder (0.2%) worked in a family business without pay.
Compared with older workers, young workers are less likely to be self-employed or to be employees holding full-time permanent positions. However, they are much more likely to hold part-time or non-permanent jobs as employees. While 39.6% of young workers were in this group in 2019, the corresponding percentages for older workers amounted to at most 14.0%.
These differences narrow substantially when considering employed individuals who are not full-time students. Among this group, 23.6% of young workers were other employees in 2019, compared with at most 13.4% of older workers.
Likewise, when full-time students are excluded, differences across age groups in the percentage of workers who are employees holding full-time permanent jobs become less pronounced (Chart 4). This is because the proportion of young workers holding such jobs increases from 54.4% to 69.2% when full-time students are excluded. In contrast, between 70% and 72% of older workers hold such jobs, regardless of whether full-time students are excluded.
Whether one considers all workers or only those who are not in school full-time, young workers are less likely to be self-employed than older workers. The differences are of similar magnitude regardless of whether full-time students are excluded from the analysis. They reflect, at least in part, the fact that starting one’s business usually requires having minimal financial or physical assets (e.g., some housing equity) and that because they are at the beginning of their career, young workers have generally had little time to accumulate such assets.
Among youth, job types also differ across age groups. The majority (53.2%) of employed young Canadians aged 15 to 19 who were not in school full-time held part-time or non-permanent jobs as employees in 2019. This is three times the rate observed for their counterparts aged 25 to 30 (17.1%). Conversely, the percentage of employed youth who are employees holding full-time permanent jobs is much higher among the latter group than among the former.Note 9
Data table for Chart 4
| All workers | Excluding full-time students | |||||
|---|---|---|---|---|---|---|
| Self-employed workers | Employees in full-time permanent jobs | Other employees | Self-employed workers | Employees in full-time permanent jobs | Other employees | |
| percent | ||||||
| 15 to 30 | 5.8 | 54.4 | 39.6 | 7.0 | 69.2 | 23.6 |
| 31 to 44 | 14.3 | 71.7 | 14.0 | 14.3 | 72.2 | 13.4 |
| 45 to 54 | 17.6 | 70.0 | 12.3 | 17.6 | 70.2 | 12.1 |
| 15 to 19 | 1.5 | 14.0 | 84.2 | 1.9 | 44.3 | 53.2 |
| 20 to 24 | 3.9 | 49.2 | 46.8 | 4.5 | 64.6 | 30.7 |
| 25 to 30 | 8.6 | 71.3 | 20.0 | 8.8 | 74.0 | 17.1 |
| Source: Statistics Canada, Labour Force Survey. | ||||||
Proportionately fewer young Canadians hold full-time permanent jobs now
The types of jobs held by young workers changed over the last few decades. Proportionately fewer young workers are now employees holding full-time permanent jobs than in the late 1980s. For example, 80.8% of young men not in school held full-time permanent positions as employees in 1989, the first year for which data on permanent jobs are available (Chart 5).Note 10 Ten years later, in 1999, this proportion had dropped to 73.9%. It has changed little from 1999 to 2019. A similar pattern, somewhat more pronounced, is observed among young women.
Data table for Chart 5
| Men in full-time jobs (employees or self-employed) | Women in full-time jobs (employees or self-employed) | |||||
|---|---|---|---|---|---|---|
| 15 to 30 | 31 to 44 | 45 to 54 | 15 to 30 | 31 to 44 | 45 to 54 | |
| percent | ||||||
| 1976 | 97.6 | 98.9 | 98.7 | 87.9 | 75.5 | 76.5 |
| 1989 | 95.5 | 97.8 | 97.1 | 84.2 | 77.0 | 75.9 |
| 1999 | 91.8 | 96.7 | 95.8 | 78.1 | 77.0 | 78.6 |
| 2009 | 90.6 | 95.5 | 94.8 | 79.4 | 80.8 | 80.3 |
| 2019 | 90.3 | 95.5 | 94.9 | 81.7 | 82.7 | 82.5 |
| 2020 | 89.1 | 95.6 | 94.8 | 80.4 | 84.2 | 83.7 |
| percent | ||||||
| 1989 | 80.8 | 75.7 | 72.8 | 77.1 | 63.4 | 65.2 |
| 1999 | 73.9 | 72.6 | 68.1 | 65.3 | 63.8 | 64.3 |
| 2009 | 73.9 | 72.4 | 68.9 | 65.8 | 67.1 | 67.1 |
| 2019 | 73.0 | 75.2 | 71.7 | 67.3 | 69.0 | 68.8 |
| 2020 | 72.8 | 76.4 | 73.7 | 65.0 | 71.6 | 71.0 |
| Source: Statistics Canada, 1989 General Social Survey; Labour Force Survey. | ||||||
This decline in the relative importance of full-time permanent paid jobs has contributed to the decrease in the proportion of young workers employed full-time observed since the late 1980s. However, the proportion of young workers employed full-time—either as employees or as self-employed workers—started falling before the late 1980s. For example, 84.2% of young women not in school were employed full-time in 1989, down from 87.9% in 1976 (Chart 5). A somewhat smaller decline was observed for young men. The end result is that, by 2019, the proportion of young workers employed full-time was, for both sexes, between 6 and 7 percentage points lower than it was in 1976.Note 11
The decline in the relative importance of full-time employment was not unique to youth. Full-time employment became less prevalent for older men as well (Chart 5). In contrast, as they became more career-oriented and started to enter full-time jobs in growing numbers, older women experienced an increase in the proportion of jobs they held full-time.
The decline in the proportion of young workers holding full-time jobs could reflect two scenarios, which are not mutually exclusive: growing preference for part-time work or a greater difficulty finding full-time employment in an evolving labour market. The data support the latter explanation. From 1976 to 2019, the proportion of young men and women employed part-time on an involuntary basis grew far more than the proportion employed part-time voluntarily (Chart 6).Note 12 Hence, the decline in the prevalence of full-time employment observed among youth from 1976 to 2019 largely reflects a greater difficulty finding full-time employment in recent years, compared with the mid-1970s.

Data table for Chart 6
| Men | Women | |||
|---|---|---|---|---|
| involuntary part-time | voluntary part-time | involuntary part-time | voluntary part-time | |
| percentage points | ||||
| 1976 to 1995 | 6.3 | 1.0 | 9.8 | 0.1 |
| 1997 to 2019 | -0.8 | 2.3 | -1.7 | -0.6 |
| Source: Statistics Canada, Labour Force Survey. | ||||
While the COVID-19 pandemic substantially reduced the employment rates of young Canadians, it had a more moderate impact on the types of jobs they hold. From 2019 to 2020, the percentage of young male and female workers employed in full-time jobs fell by about 1 percentage point (Chart 5). The percentage of young men who were employees holding full-time permanent jobs remained almost unchanged during that period. In contrast, the percentage of young women holding full-time permanent paid jobs fell by about 2 percentage points from 2019 to 2020.
Highly educated youth are more likely to hold full-time permanent jobs than their less educated counterparts
The degree to which young workers hold full-time permanent jobs as employees varies across socio-economic characteristics. Considering workers not in school full-time, 68.1% of young men held such jobs in 2019, compared with 61.4% of young women (Chart 7). Young immigrant workers and young Canadian-born workers held these jobs in very similar proportions.
Differences are also observed across education levels. Of all young workers holding a bachelor’s degree and not attending school full-time, more than two-thirds (70.7%) held full-time permanent jobs as employees in 2019. In contrast, less than half (48.9%) of their counterparts with no high school diploma did so.
Data table for Chart 7
| Men | Women | Less than high school | High school | Post-secondary certificate or diploma | Bachelor's degree | Above bachelor's degree | Canadian-born | Immigrant | |
|---|---|---|---|---|---|---|---|---|---|
| percent | |||||||||
| All | 58.2 | 49.2 | 26.2 | 45.4 | 64.9 | 66.2 | 63.3 | 53.9 | 55.2 |
| Excluding full-time students | 68.1 | 61.4 | 48.9 | 58.2 | 70.8 | 70.7 | 68.5 | 65.0 | 65.5 |
| Source: Statistics Canada, Labour Force Survey. | |||||||||
Differences in job types between these two groups largely reflect the fact that young individuals with no high school diploma are over-represented among youth aged 15 to 19, who tend not to hold full-time permanent positions (Chart 4). To provide a more meaningful comparison, it is better to focus on youth aged 25 to 30, a group of individuals who—unlike those aged under 25—have had plenty of time to finish high school or to complete a bachelor’s degree. When comparing these groups, differences are less pronounced but still remain. Among employed youth aged 25 to 30 not in school full-time, 69.5% of those with no high school diploma were employees holding full-time permanent jobs in 2019, compared with 73.6% for their counterparts with a bachelor’s degree.
Young Canadians with no high school diploma are not only much less likely to have a job than young Canadians with a bachelor’s degree, they are also less likely to have a full-time, permanent paid job whenever they are employed.
Start of text box
The numbers shown in this section refer to the main job held by young Canadians, i.e., the job that involves the greatest number of hours per week. However, a minority of youth hold multiple jobs at a given point in time. Labour Force Survey data indicate that, of all young employed women who were not in school full-time, 8.4% held multiple jobs in 2019, up from 1.3% in 1976. For young men, the incidence of multiple job holding increased from 2.3% in 1976 to 5.2% in 2019. For both sexes, most of the increases observed took place before 2000.
A related but distinct phenomenon is gig employment. A recent Statistics Canada study (Jeon, Liu, and Ostrovsky, 2019) shows that gig employment represented 8.2% of total employment in 2016, up from 5.5% in 2005. Seven percent of men aged 25 to 34 were involved in gig work in 2016, compared with 9.3% of women aged 25 to 34. The corresponding percentages for men and women aged 45 to 54 were 7.3% and 9.5%, respectively.
End of text box
Start of text box
The COVID-19 pandemic has led to a large increase in the proportion of employees working from home. In January 2021, 32% of employees aged 15 to 69 worked most of their hours from home, up from 4% in 2016 (Mehdi and Morissette, 2021).
Among employees not in school full-time, the share of total aggregate hours worked from home increased in a fairly similar way for young employees and older employees. It increased from 2.9% in 2016 to 41.8% in April 2020 for young employees aged 15 to 34 and from 4.4% to 45.2% for employees aged 35 to 54 (Chart 8). By February 2021, both groups worked roughly one-third of all their hours from home.

Data table for Chart 8
| 15 to 34 | 35 to 54 | 55 to 64 | |
|---|---|---|---|
| percent | |||
| 2016 | 2.9 | 4.4 | 5.4 |
| 2018 | 3.6 | 5.5 | 5.9 |
| Apr. 2020 | 41.8 | 45.2 | 36.4 |
| May 2020 | 36.8 | 44.5 | 27.5 |
| June 2020 | 26.8 | 35.5 | 32.0 |
| July 2020 | 24.6 | 31.7 | 25.1 |
| Aug. 2020 | 22.3 | 29.3 | 23.1 |
| Sept. 2020 | 23.1 | 28.5 | 22.3 |
| Oct. 2020 | 23.5 | 28.6 | 21.2 |
| Nov. 2020 | 25.9 | 29.2 | 22.5 |
| Dec. 2020 | 27.4 | 31.4 | 24.7 |
| Jan. 2021 | 33.1 | 37.1 | 26.9 |
| Feb. 2021 | 31.1 | 33.6 | 25.8 |
| Sources: Statistics Canada, Labour Force Survey, April 2020 to February 2021, and General Social Survey of 2016 and 2018. | |||
End of text box
Pay rates differ across age groups
Part of the difference in pay rates is associated with the lower experience of youth in the labour market
Like employment rates and job types, pay rates for Canadians vary across age groups. This is true regardless of student status. In 2019, young employees not in school full-time earned an average of $22.63 per hour (Chart 8). The average hourly wage was $30.90 for their counterparts aged 31 to 44 and $31.70 for those aged 45 to 54.
Data table for Chart 9
| All individuals | Excluding full-time students | |||||
|---|---|---|---|---|---|---|
| All employees | Full-time employees | Part-time employees | All employees | Full-time employees | Part-time employees | |
| hourly wage | ||||||
| 15 to 30 | 21.2 | 23.6 | 16.0 | 22.6 | 23.8 | 17.1 |
| 31 to 44 | 30.8 | 31.5 | 24.7 | 30.9 | 31.5 | 24.9 |
| 45 to 54 | 31.7 | 32.5 | 24.1 | 31.7 | 32.5 | 24.2 |
| 15 to 19 | 14.3 | 15.5 | 13.9 | 14.8 | 15.6 | 14.0 |
| 20 to 24 | 18.8 | 20.1 | 16.3 | 19.4 | 20.2 | 16.6 |
| 25 to 30 | 25.7 | 26.4 | 20.4 | 25.9 | 26.4 | 20.7 |
| Source: Statistics Canada, Labour Force Survey. | ||||||
These differences in pay rates partly reflect the fact that young workers are over-represented in part-time jobs and that part-time jobs generally pay less, on an hourly basis, than full-time jobs (Chart 8). However, since young workers tend to earn less than older workers even when employed full-time, the over-representation of young workers in part-time jobs cannot account for the entire wage differences across age groups. Other factors matter.
One important consideration is that young workers are generally at the beginning of their career and have accumulated less experience in the labour market than older workers. Since increased labour market experience is generally associated with higher wages, this gap in labour market experience may account for part of the pay differences between young and older workers. Another explanation is that young workers tend to be under-represented in large firms, which generally pay higher wages than smaller firms.Note 13 Lastly, compared with older workers, a greater proportion of young workers may have yet to find a job that matches their skills well and that offers higher wages in return for the resulting higher productivity.
Pay rates also differ across age groups among youth. Regardless of student status and whether they hold part-time or full-time jobs, young Canadians aged 15 to 19 generally earn less than their older counterparts. For example, those not in school full-time averaged $15.59 per hour in full-time jobs in 2019, compared with $26.43 for young Canadians aged 25 to 30 (Chart 8).
Higher pay among highly educated youth
Differences in pay rates are observed across other groups of young Canadians as well. Even though they were more highly educated than young menNote 14 , young women not in school full-time and employed in full-time jobs earned an average of $22.94 in 2019, about 6% less than the $24.43 earned by young men (Chart 9).
Substantial wage differences are observed between highly educated young Canadians and their less educated counterparts. For example, young bachelor degree holders not in school full-time and holding full-time jobs averaged $27.74 per hour in 2019, but young full-time employees with no high school diploma earned much less, averaging $18.50 per hour. Among youth aged 25 to 30, these two groups averaged $21.53 and $28.96 per hour, respectively. Since young, highly educated individuals have higher employment rates and are more likely to hold full-time permanent paid jobs than their less educated counterparts, these wage differences indicate that the former group enjoys a triple advantage in the labour market.

Data table for Chart 10
| All employees | Full-time employees | |
|---|---|---|
| 2019 dollars | ||
| Men | 23.4 | 24.4 |
| Women | 21.8 | 22.9 |
| Less than high school | 17.1 | 18.5 |
| High school | 18.7 | 19.8 |
| Post-secondary certificate or diploma | 23.2 | 23.9 |
| Bachelor's degree | 27.1 | 27.7 |
| Above bachelor's degree | 30.2 | 30.6 |
| Canadian-born | 22.6 | 23.8 |
| Immigrant | 22.9 | 24.1 |
| Source: Statistics Canada, Labour Force Survey. | ||
Since the early 1980s, pay rates of young women increased substantially while pay rates of young men changed little
Pay rates for young Canadian employees have not grown steadily over the last few decades. Young men aged 17 to 34 employed full-time saw their median real hourly wages drop from 1981 to the late 1990s, remain stagnant up until the mid-2000s, and grow significantly from the mid-2000s to 2009—partly as a result of the oil boom Canada experienced during that periodNote 15 —and from 2017 to 2019 (Chart 10).Note 16 By 2019, their median real hourly wages were about 2% higher than they had been in 1981. In sum, young men employed full-time experienced virtually no wage growth from 1981 to 2019.Note 17
Older men experienced stronger wage growth. From 1981 to 2019, men aged 35 to 44 saw their median real hourly wages grow by 14% while men aged 45 to 54 experienced 17% real wage growth.

Data table for Chart 11
| Men | Women | |||||
|---|---|---|---|---|---|---|
| 17 to 34 | 35 to 44 | 45 to 54 | 17 to 34 | 35 to 44 | 45 to 54 | |
| hourly wage | ||||||
| 1981 | 22.5 | 27.5 | 26.3 | 17.6 | 20.0 | 18.7 |
| 1982 | 22.5 | 28.4 | 27.3 | 17.6 | 20.2 | 19.0 |
| 1983 | 22.5 | 29.2 | 28.2 | 17.7 | 20.4 | 19.3 |
| 1984 | 22.4 | 30.1 | 29.2 | 17.7 | 20.7 | 19.7 |
| 1985 | 21.6 | 30.0 | 29.5 | 17.3 | 20.7 | 19.8 |
| 1986 | 20.7 | 29.8 | 29.8 | 16.9 | 20.7 | 19.9 |
| 1987 | 21.1 | 29.2 | 29.8 | 17.1 | 20.8 | 19.9 |
| 1988 | 22.0 | 30.0 | 30.2 | 17.8 | 21.2 | 19.7 |
| 1989 | 21.8 | 29.3 | 29.6 | 17.8 | 21.1 | 19.8 |
| 1990 | 21.3 | 29.1 | 29.7 | 17.6 | 20.9 | 20.1 |
| 1991 | 21.0 | 28.9 | 29.8 | 17.7 | 21.1 | 20.5 |
| 1992 | 20.8 | 28.8 | 29.8 | 17.7 | 21.4 | 20.9 |
| 1993 | 20.6 | 28.6 | 29.9 | 17.7 | 21.6 | 21.3 |
| 1994 | 20.4 | 28.5 | 29.9 | 17.8 | 21.8 | 21.7 |
| 1995 | 20.1 | 28.3 | 30.0 | 17.8 | 22.0 | 22.1 |
| 1996 | 19.9 | 28.1 | 30.0 | 17.8 | 22.3 | 22.6 |
| 1997 | 19.7 | 28.0 | 30.1 | 17.9 | 22.5 | 23.0 |
| 1998 | 20.0 | 27.6 | 29.8 | 17.9 | 22.2 | 22.7 |
| 1999 | 19.8 | 27.7 | 30.1 | 17.6 | 22.0 | 23.3 |
| 2000 | 20.6 | 27.4 | 29.9 | 17.5 | 21.9 | 23.2 |
| 2001 | 20.9 | 27.8 | 30.1 | 18.1 | 22.2 | 22.9 |
| 2002 | 20.4 | 27.2 | 29.9 | 17.9 | 22.1 | 23.2 |
| 2003 | 19.8 | 26.5 | 29.1 | 18.5 | 22.5 | 22.5 |
| 2004 | 19.5 | 27.1 | 29.2 | 18.0 | 22.5 | 23.3 |
| 2005 | 20.3 | 26.9 | 29.0 | 17.9 | 22.8 | 23.5 |
| 2006 | 20.6 | 27.4 | 28.7 | 18.6 | 22.9 | 23.3 |
| 2007 | 20.5 | 28.1 | 29.3 | 18.8 | 22.8 | 24.0 |
| 2008 | 21.5 | 28.6 | 29.5 | 19.1 | 23.8 | 23.8 |
| 2009 | 21.4 | 29.7 | 29.7 | 20.1 | 25.0 | 24.4 |
| 2010 | 22.2 | 29.2 | 29.8 | 19.8 | 24.8 | 24.5 |
| 2011 | 21.6 | 28.4 | 29.5 | 19.3 | 24.7 | 24.4 |
| 2012 | 22.1 | 28.5 | 29.5 | 20.1 | 24.9 | 24.4 |
| 2013 | 22.1 | 29.7 | 30.3 | 20.0 | 25.6 | 24.8 |
| 2014 | 22.1 | 29.3 | 29.3 | 20.4 | 26.0 | 25.0 |
| 2015 | 22.6 | 30.4 | 31.2 | 20.7 | 26.6 | 25.8 |
| 2016 | 22.3 | 30.7 | 30.6 | 21.2 | 26.5 | 25.1 |
| 2017 | 21.9 | 31.3 | 30.1 | 20.9 | 26.1 | 25.6 |
| 2018 | 22.4 | 30.6 | 30.6 | 20.9 | 26.1 | 25.5 |
| 2019 | 23.0 | 31.2 | 30.8 | 21.5 | 26.9 | 26.1 |
| 2020 | 25.0 | 33.8 | 33.8 | 23.9 | 29.8 | 28.8 |
|
Note: Main job held in May (held in December for 1984). Values for 1982, 1983, 1985 and 1991–1996 are based on interpolations. Sources: Statistics Canada, 1981 Survey of Work History, 1984 Survey of Union Membership, 1986 to 1990 Labour Market Activity Survey, 1997 to 2020 Labour Force Survey. |
||||||
The weaker wage growth experienced by young men from 1981 to 2019 masks offsetting trends that were observed from 1981 to 1999 and from 1999 to 2019. From 1981 to 1999, young men saw their median real hourly wages drop by 12%, whereas men aged 45 to 54 experienced 14% wage growth. The opposite was true afterwards—from 1999 to 2019, median real hourly wages of young men grew 16%, compared with 2% for their counterparts aged 45 to 54, largely as a result of faster wage growth from 1999 to 2011.
Part of the difference in wage growth observed between young men and older men from 1981 to the late 1990s can be attributed to several specific factors. First, the percentage of employees in unionized jobs—which tend to pay higher-than-average wages—fell to a greater extent among young men than among older men during that period. Second, average tenure on the job—another factor associated with higher pay—fell for young men but increased among older men. Lastly, young men moved away from high-paying industries to a greater extent than older men and also entered high-paying occupations to a lesser extent than older men. Taken together, these factors account for roughly 40% of the difference in wage growth observed between young men and older men from 1981 to the late 1990s.Note 18
The story was different after the late 1990s. From the late 1990s to 2011, wages for young men grew faster than those of older men, largely because unionization rates for young men did not fall as much as those for older men and because young men moved into high-paying occupations and industries to a greater extent than older men.Note 19 For example, more young men entered the construction and oil and gas industries than older men during this period.
While young men experienced virtually no wage growth from 1981 to 2019, young women saw their median real hourly wages increase by 22% (Chart 10). Pay rates grew even more among older women: they increased by 35% among women aged 35 to 44 and by 40% among those aged 45 to 54.
The stronger wage growth experienced by young women relative to young men likely reflects a variety of trends. First, young women have increased their educational attainment at a greater pace than young men since the early 1980s. Since higher education is associated with higher pay rates, this may have boosted wage growth for young women. In addition, young women have increased their presence in high-paying occupations, such as medicine and accountingNote 20 , at a faster pace than young men. Lastly, laws that foster pay equity may have contributed to increasing wages among women.
As Chart 10 shows, the COVID-19 pandemic has altered the wage trajectories observed from 1981 to 2019. Regardless of age and sex, all full-time employees saw their real hourly wages increase sharply from 2019 to 2020. Median real hourly wages increased by between 8% and 11% during that period.
This strong wage growth is not necessarily good news. It reflects to a large extent the fact that from 2019 to 2020, employment and work hours fell disproportionately among low-paid workers. Labour Force Survey data shows, for example, that between the March–September period of 2019 to the same period in 2020, the total hours worked by employees in the bottom 10% of the 2019 hourly wage distribution fell by 46%. In contrast, the total hours worked by their counterparts in the top 10% of the 2019 hourly wage distribution increased by 14%. In sum, the strong wage growth observed from 2019 to 2020 largely reflects the disappearance of low-paid jobs during that period—a number of which were held by young workers.
Youth who are neither in employment, education or training (NEET) face a greater risk of economic and social disengagement
So far, this chapter has answered the following questions: To what extent are young Canadians employed? When they are employed, what types of jobs do they hold? How much money do they earn when they are employees? How have the likelihood of being employed, the types of jobs they hold, and the pay rates they receive evolved over the last few decades?
This section looks at the other side of the coin, documenting the degree to which young Canadians are neither in employment, education or training (NEET) during school months, i.e., from September to April. Young Canadians who are not connected to the school system or the labour market might see the skills they have acquired erode over time. They are less likely to be economically self-sufficient than their counterparts who have a job and are also at greater risk of social disengagement. Identifying these young Canadians is crucial to the discussions and policies meant to help youth successfully transition into the labour market and participate fully in society.

Data table for Chart 12
| Men | percent |
|---|---|
| 15 to 19 | 5.8 |
| 20 to 24 | 12.0 |
| 25 to 30 | 12.1 |
| Women | |
| 15 to 19 | 4.3 |
| 20 to 24 | 10.2 |
| 25 to 30 | 14.8 |
| All individuals | |
| Less than high school | 11.1 |
| High school | 12.5 |
| Post-secondary certificate or diploma | 8.9 |
| Bachelor's degree | 7.4 |
| Above bachelor's degree | 9.7 |
| Canadian-born | 10.2 |
| Immigrant | 11.3 |
| Source: Statistics Canada, Labour Force Survey (January to April and September to December). | |
Young Canadians aged 15 to 19 are less likely to be neither in school nor employed than older youth
From January to April and September to December 2019, roughly one in ten (10.4%) young Canadians were neither in school nor employed. A higher proportion of individuals aged 31 to 44 (13.9%) or of individuals aged 45 to 54 (15.7%) were in the same situation.
The percentage of individuals neither in school nor employed also varies across groups of young Canadians. Young men and women aged 15 to 19 are, at most, half as likely to be neither in school nor employed as their counterparts aged 20 to 24 or those aged 25 to 30 (Chart 11). Among those aged 25 to 30, women are neither in school nor employed more often (14.8%) than men (12.1%). Part of this difference is attributed to motherhood.Note 21
In line with the notion that highly educated youth tend to fare better in the labour market than their less educated counterparts, young bachelor’s degree holders were less likely to be neither in school nor employed (7.4%) than young Canadians with a high school diploma (12.5%).
Different trends for young women and young women
The percentage of young women neither in school nor employed trended downwards from 1976 to 2019, as they entered the labour market in growing numbers. In 2019, 10.5% did not attend school and did not have a job, down from 30.0% in 1976 (Chart 12). A downward trend was observed both for young women with a university degree and other young women.
In contrast, the percentage of young men neither in school nor employed has not trended downwards since the mid-1970s. It rose during recessions and fell afterwards but was, at 10.4%, almost identical to its level in 1976 (10.9%). From 1976 to 2019, young men and women with a university degree were less likely to be neither in school nor employed than those with no university degree. All these patterns—downward trends for women but not for men and lower NEET rates among highly educated youth—hold when the focus is on youth aged 25 to 30.
The COVID-19 pandemic changed things abruptly. Because of the job losses the pandemic triggered, the percentage of young men and young women neither in school nor employed increased by between 3 and 4 percentage points from 2019 to 2020. Increases were observed both for youth with a university degree and other young individuals. As a result, 14.4% of young men and 13.4% of young women ended up being neither in school nor employed during the school months of 2020.
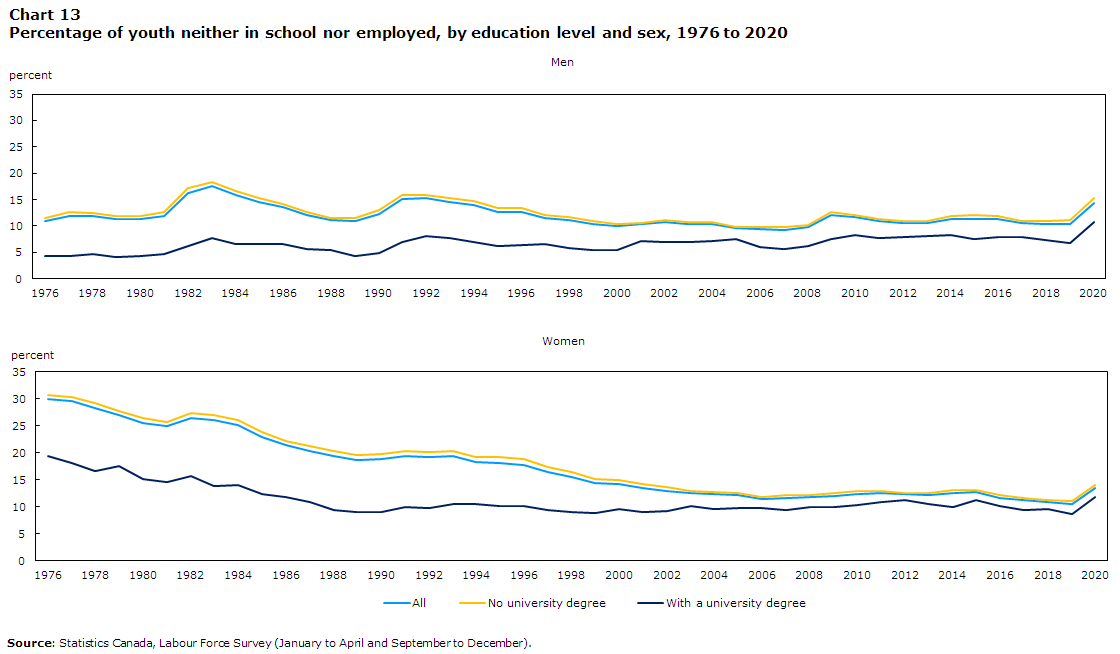
Data table for Chart 13
| Men | Women | |||||
|---|---|---|---|---|---|---|
| All | No university degree | With a university degree | All | No university degree | With a university degree | |
| percent | ||||||
| 1976 | 10.9 | 11.5 | 4.3 | 30.0 | 30.7 | 19.4 |
| 1977 | 11.9 | 12.6 | 4.4 | 29.6 | 30.4 | 18.0 |
| 1978 | 11.9 | 12.5 | 4.6 | 28.3 | 29.2 | 16.5 |
| 1979 | 11.3 | 12.0 | 4.2 | 27.0 | 27.6 | 17.6 |
| 1980 | 11.3 | 12.0 | 4.2 | 25.6 | 26.3 | 15.1 |
| 1981 | 12.0 | 12.6 | 4.6 | 24.9 | 25.7 | 14.5 |
| 1982 | 16.3 | 17.2 | 6.3 | 26.5 | 27.3 | 15.7 |
| 1983 | 17.6 | 18.4 | 7.7 | 26.0 | 27.0 | 13.9 |
| 1984 | 15.8 | 16.6 | 6.5 | 25.0 | 26.0 | 14.1 |
| 1985 | 14.5 | 15.2 | 6.7 | 22.9 | 23.8 | 12.3 |
| 1986 | 13.5 | 14.1 | 6.5 | 21.3 | 22.2 | 11.8 |
| 1987 | 12.1 | 12.7 | 5.7 | 20.3 | 21.2 | 10.9 |
| 1988 | 11.1 | 11.6 | 5.4 | 19.3 | 20.3 | 9.4 |
| 1989 | 11.0 | 11.6 | 4.4 | 18.6 | 19.6 | 9.0 |
| 1990 | 12.3 | 13.0 | 4.9 | 18.7 | 19.7 | 8.9 |
| 1991 | 15.0 | 15.8 | 7.0 | 19.4 | 20.3 | 10.0 |
| 1992 | 15.2 | 15.9 | 8.1 | 19.1 | 20.2 | 9.7 |
| 1993 | 14.6 | 15.3 | 7.8 | 19.3 | 20.3 | 10.5 |
| 1994 | 14.0 | 14.7 | 6.9 | 18.2 | 19.2 | 10.5 |
| 1995 | 12.7 | 13.4 | 6.3 | 18.1 | 19.2 | 10.2 |
| 1996 | 12.7 | 13.4 | 6.5 | 17.7 | 18.8 | 10.1 |
| 1997 | 11.5 | 12.1 | 6.5 | 16.4 | 17.4 | 9.3 |
| 1998 | 11.1 | 11.7 | 5.9 | 15.4 | 16.4 | 9.0 |
| 1999 | 10.4 | 10.9 | 5.4 | 14.3 | 15.2 | 8.9 |
| 2000 | 10.0 | 10.5 | 5.5 | 14.2 | 14.9 | 9.5 |
| 2001 | 10.3 | 10.7 | 7.1 | 13.4 | 14.2 | 9.0 |
| 2002 | 10.7 | 11.1 | 7.0 | 12.9 | 13.6 | 9.2 |
| 2003 | 10.4 | 10.8 | 6.9 | 12.5 | 12.9 | 10.0 |
| 2004 | 10.4 | 10.8 | 7.2 | 12.2 | 12.7 | 9.6 |
| 2005 | 9.6 | 9.8 | 7.5 | 12.1 | 12.6 | 9.7 |
| 2006 | 9.4 | 9.9 | 6.0 | 11.4 | 11.8 | 9.7 |
| 2007 | 9.3 | 9.8 | 5.6 | 11.6 | 12.1 | 9.4 |
| 2008 | 9.7 | 10.2 | 6.3 | 11.8 | 12.2 | 9.9 |
| 2009 | 12.1 | 12.7 | 7.5 | 12.0 | 12.5 | 9.9 |
| 2010 | 11.7 | 12.2 | 8.4 | 12.3 | 12.8 | 10.3 |
| 2011 | 10.9 | 11.3 | 7.8 | 12.6 | 13.0 | 10.9 |
| 2012 | 10.6 | 11.0 | 7.9 | 12.3 | 12.6 | 11.3 |
| 2013 | 10.6 | 11.0 | 8.1 | 12.2 | 12.6 | 10.4 |
| 2014 | 11.3 | 11.8 | 8.2 | 12.4 | 13.1 | 9.9 |
| 2015 | 11.4 | 12.1 | 7.5 | 12.7 | 13.1 | 11.2 |
| 2016 | 11.3 | 11.8 | 7.9 | 11.7 | 12.1 | 10.1 |
| 2017 | 10.5 | 11.0 | 7.9 | 11.2 | 11.7 | 9.4 |
| 2018 | 10.4 | 11.0 | 7.3 | 10.8 | 11.1 | 9.6 |
| 2019 | 10.4 | 11.1 | 6.8 | 10.5 | 11.1 | 8.7 |
| 2020 | 14.4 | 15.2 | 10.8 | 13.4 | 13.9 | 11.9 |
| Source: Statistics Canada, Labour Force Survey (January to April and September to December). | ||||||
Conclusion
Young Canadians have experienced diverse trajectories in the labour market over the last four decades. From the early 1980s to 2019, young women have substantially increased their presence in the labour market, have seen their unemployment rate trend downwards, and have registered substantial overall wage growth when employed full-time. They were also more likely to be either in school or employed in recent years than in the early 1980s. In contrast, the employment rates of young men, their unemployment rates, their propensity to be neither in school nor employed, and their pay rates in full-time jobs were overall fairly similar in 2019 and in the early 1980s. When they were employed, both young men and young women were less likely to have a full-time job in 2019 than in the early 1980s. The increase in part-time employment they experienced over the last four decades largely reflects their greater difficulty finding full-time employment in recent years, rather than growing preference for part-time work.
The degree of success that youth have had in the labour market also varied across groups of young Canadians in 2019. Compared with their less educated counterparts, highly educated young individuals enjoyed a triple advantage in the Canadian labour market since they were more likely to have a job, more likely to be employees holding full-time permanent positions, and paid higher wages. Whether such differences will widen in a post COVID-19 labour market remains to be seen.
While young men and young women had fairly similar employment rates in 2019, young women still had—despite their higher educational attainment—lower wages than young men in full-time jobs.
As the COVID-19 pandemic disrupted the Canadian labour market, the employment rates of young men and women fell substantially from 2019 to 2020, more so than those of older Canadians. As a result, the percentage of youth neither in school nor employed increased significantly. Pay rates for young employees increased during that period, but the overall growth in pay rates was, to a large extent, driven by the disappearance of low-paid jobs, many of which were initially held by young Canadians. In response to the threat posed by the virus, many young Canadians started working from home and, like older workers, did so to a degree never witnessed before the pandemic. In this context, the degree to which the COVID-19 pandemic will affect youth employment opportunities and work arrangements in forthcoming years will be an important question for young Canadians, researchers, and policy makers.
References
Brunet, S. 2018. “The transition from school to work: the NEET (not in employment, education or training) indicator for 25-to-29 year old women and men in Canada”, Statistics Canada: Education Indicators in Canada: Fact Sheet, Catalogue 81-599-X, No. 13.
Frenette, M., D. Messacar and T. Handler. 2020. “Potential earnings losses among high school and postsecondary graduates due to the COVID-19 economic downturn”, Economic Insights, Statistics Canada, Catalogue 11-626-X, No. 114.
Galarneau, D., R. Morissette and J. Usalcas. 2013. “What has changed for young people in Canada?”, Statistics Canada: Insights on Canadian Society.
Jeon, S., H. Liu and Y. Ostrovsky. 2019. “Measuring the gig economy in Canada using administrative data”, Statistics Canada: Analytical Studies Branch Research Paper No. 437.
Mehdi, T. and R. Morissette. 2021. “Working from home: productivity and preferences”, STATCAN COVID-19: Data to Insights for a Better Canada, No. 00012. Statistics Canada Catalogue No. 45280001. Ottawa: Statistics Canada.
Morissette, R. (1993) “Canadian Jobs and Firm Size: Do Smaller Firms Pay Less?” Canadian Journal of Economics, 93, 159-174.
Morissette, R., G. Picot and Y. Lu. 2013. “The evolution of Canadian wages over the last three Decades”, Statistics Canada: Analytical Studies Branch Research Paper No. 347.
Morissette, R., P. C. W. Chan, and Y. Lu. 2015. “Wages, Youth Employment, and School Enrollment: Recent Evidence from Increases in World Oil Prices”, Journal of Human Resources, Vol. 50, No. 1, 222-253.
Morissette R. 2016. “Perspectives on the youth labour market in Canada”, Presentation before the National Statistics Council. https://www150.statcan.gc.ca/n1/pub/11-631-x/11-631-x2016002-eng.htm
Uppal, S. and Larochelle-Côté. 2014. “Changes in the occupational profile of young men and women in Canada”, Statistics Canada: Insights on Canadian Society.
Uppal, S. 2017. “Young men and women without a high school diploma”, Statistics Canada: Insights on Canadian Society.
Start of text box
Data sources
Most of the data highlighted in this chapter comes from the Labour Force Survey (LFS). The LFS collects information related to employment, unemployment, and wages for the Canadian population. It is a monthly household survey of a sample of individuals who are representative of the civilian, non-institutionalized population 15 years of age or older.
Excluded from the survey’s coverage are the following: persons living on reserves and other Aboriginal settlements in the provinces, full-time members of the Canadian Armed Forces, the institutionalized population, and households in extremely remote areas with very low population density. These groups together represent an exclusion of approximately 2% of the population aged 15 and over.
Definitions
Employment rate: Percentage of the population who is employed during the LFS reference week.
Participation rate: Percentage of the population who, during the LFS reference week, is: a) employed or b) not employed but is available for work and actively looking for a job.
Unemployment rate: Percentage of labour market participants who, during the LFS reference week, are not employed but are available for work and are actively looking for a job.
Full-time job: Job that involves at least 30 hours of work per week.
Part-time job: Job that involves less than 30 hours of work per week.
Permanent job: Job with no predetermined end date.
Temporary job: Job with a predetermined end date. This includes seasonal jobs, term or contract jobs, casual jobs, and non-permanent jobs done through a temporary help agency.
Full-time permanent paid job: Job held by an employee, that involves at least 30 hours of work per week and that has no predetermined end date.
Employee: A person who works for others.
Self-employed worker: Working owners of a business, farm or professional practice.
Real hourly wages: Hourly wages adjusted for inflation.
Median real hourly wages: Real hourly wages that separate employees into two groups: one half earn less than median real hourly wages while the other half earns more than median real hourly wages.
Real hourly wage deciles: Wage thresholds that classify employees into 10 groups: those in the bottom 10% of the real hourly wage distribution, those in the next 10%, etc., up to those in the top 10% of the real hourly wage distribution.
Neither in school nor employed: Refers to individuals who are neither students nor employed. Students include those who attend a primary or secondary school, a community college, junior college or CEGEP, a university or other schools.
End of text box
- Date modified: