
Indigenous Peoples Thematic Series
Quality of employment among First Nations people living off reserve and Métis, 2022
Skip to text
Text begins
Highlights
Indicators of quality of employment (QoE) in an ever-changing labour market can play a vital role in identifying key areas to improve working conditions, employee well-being and sustainable economic growth. Understanding the QoE among Indigenous peoples can help identify disparities, bridge knowledge gaps and inform policies aimed at promoting equity in the labour force.
Using 12 months of data from the Labour Force Survey (LFS) and LFS supplementNote for 2022, as well as data from the 2016 General Social Survey (GSS) on Canadians at Work and Home (cycle 30), this study reports on several QoE indicators primarily based on Statistics Canada’s Statistical Framework on Quality of EmploymentNote among employed First Nations people residing off reserve, Métis and Inuit who are aged 18 to 64 years and living in the 10 provinces. Data were disaggregated for First Nations people living off reserve and Métis where possible; however, while Inuit are included in the total Indigenous population estimates, no separate Inuit estimates were publishable because of data limitations.
Ethics of employmentNote and income and benefits
- Based on annual estimates averaged from 12 months of the LFS for 2022, employed First Nations people living off reserve ($28.78 per hour) and Métis ($30.38 per hour) had lower average hourly earnings than non-Indigenous people ($32.58 per hour). The pay gap between Indigenous men and women was slightly smaller than between non-Indigenous men and women, although starting from a lower average hourly wage. First Nations women earned $0.92 for every dollar earned by First Nations men compared with non-Indigenous women who earned $0.87 for every dollar earned by their male counterparts. Multivariate analysis examining the association between hourly earnings disparities between employed Indigenous and non-Indigenous people and sociodemographic characteristics suggested that most of the disparities can be accounted for by sex, age and level of education.
- First Nations people were the least likely to be in managerial positions compared with non-Indigenous people (5.8% versus 9.4%), followed by Métis whose shares were also significantly lower than that of non-Indigenous people (7.6% versus 9.4%). Of those working in management occupations, Indigenous men were significantly more likely to work in middle management occupations in trades, transportation, production and utilities than non-Indigenous men (53.8% versus 39.2%).
- First Nations people (23.6%) more often reported low pay than non-Indigenous people (18.5%), while Métis (19.3%) reported similar shares to that of non-Indigenous people.
- According to the 2016 General Social Survey (GSS), First Nations people living off reserve (16.9%E) were more likely to report having experienced unfair treatment and discrimination at work than non-Indigenous people (8.2%).
- Indigenous people were three times more likely to report having experienced sexual harassment at work than non-Indigenous people (6.8%E versus 2.3%).
Working time and work-life balance
- While, overall, First Nations people living off reserve, Métis and non-Indigenous people reported similar average weekly hours (36.5 hours, 37.0 hours and 36.6 hours, respectively), Indigenous men were 2.6 times more likely to work long hours than Indigenous women (13.4% versus 5.1%). First Nations people (24.0%) were more likely to work irregular hours, irregular shifts or on call than non-Indigenous people (15.5%).
- Over one-quarter of First Nations people worked part-time involuntarily, a rate higher than among non-Indigenous people (26.2% versus 18.6%), with men having higher shares of involuntary part-time work than women among Indigenous and non-Indigenous people.
- Women were more likely to have multiple jobs than men among Indigenous and non-Indigenous people.
- Indigenous people were less likely to report having a flexible schedule that allows them to choose the time when their work day begins and ends than non-Indigenous people (29.9% versus 36.1%).
- Indigenous people working at least some of the time from home were three times more likely to report having a flexible work schedule than those working outside the home (68.6% versus 22.9%). Employees with children aged younger than 18 years at home tended to have access to more flexible schedules among Indigenous and non-Indigenous people (37.7% and 40.5%) compared with those with no children at home (26.4% and 33.9%).
Security of employment and social protection
- First Nations people living off reserve and Métis had higher rates of short tenure jobs (less than 12 months) than non-Indigenous people (24.3% and 21.6% versus 19.1%).
- Tenures of 10 years or more were most common among Indigenous people working in public administration (44.2%), finance and insurance (38.8%), and health care and social assistance (37.7%).
Social dialogue
- Among employees, Indigenous workers, and more specifically Métis had higher rates of collective bargaining coverage than non-Indigenous people (34.2% and 35.9%, respectively, versus 31.1%).
- Women reported higher shares of collective bargaining coverage than men, however only non-Indigenous men significantly differed from non-Indigenous women (29.0% versus 33.2%). Furthermore, women had higher rates with union coverage than men overall, though the difference was only statistically significant among non-Indigenous men and women.
Skills development and training
- About one-third of employed First Nations people living off reserve, Métis and non-Indigenous people attended any type of training, courses, seminars, conferences, private lessons or instructions within the last 12 months. Of those that attended training, First Nations people (84.2%) were more likely to report that their training was only partially covered or not covered at all by their employer, which was significantly higher than non-Indigenous people (75.2%).
These findings shed light on several aspects of the QoE among First Nations people living off reserve and Métis and related gaps when compared with non-Indigenous people. While several disparities were observed, some encouraging findings relating to gender pay equity, representations in some types of management positions, union membership and access to training were also evident. The findings suggest potential avenues for in-depth examination or additional research to explore quality of employment among Indigenous people in Canada.
Acknowledgements
This study was funded by Indigenous Services Canada (ISC). We extend our gratitude to colleagues, both internal and external to Statistics Canada, who lent their expertise in reviewing this paper. A very special thanks to the Congress of Aboriginal Peoples whose insights and perspectives have enriched this research.
Introduction and background
Indicators of quality of employment (QoE) in an ever-changing labour market can play a vital role in promoting better working conditions, employee well-being and sustainable economic growth. Numerous QoE indicators have been developed and operationalized over time (Burchell et al., 2012), more recently, by the Expert Group on Measuring Quality of Employment, of which Statistics Canada is a member (United Nations Economic Commission for Europe [UNECE], 2015a). The UNECE’s Statistical Framework on Quality of Employment reflects a comprehensive approach used to assess job quality beyond income, focusing on numerous aspects related to employment. The framework employs seven dimensions: safety and ethics of employment, income and benefits from employment, working time and work-life balance, security of employment and social protection, social dialogue, skills development and training, and employment-related relationships and work motivation (UNECE, 2015a). Each dimension is composed of several sub-dimensions that are operationalized through different indicators.
Drawing from Statistics Canada’s Statistical Framework on Quality of Employment,Note additional indicators have been produced using 12 months of data from the Labour Force Survey (LFS) and LFS supplement for 2022, as well as the 2016 General Social Survey (GSS) on Canadians at Work and Home, to improve our understanding of QoE in Canada (Statistics Canada, 2022a).
Start of text box
The Statistical Framework on Quality of Employment identifies seven dimensions and twelve sub-dimensions of quality of employment:
- Dimension 1 on Safety and ethics of employment includes the following subdimensions: Safety at work (e.g., mental health risk factors) (not available for this study), Child labour and forced labour (not available for this study), and Fair treatment in employment (e.g., pay gap between genders and Indigenous/non-Indigenous populations, discrimination at work);
- Dimension 2 on Income and benefits of employment includes the following subdimensions: Income (e.g., Average earnings, employees with low pay) and Non-wage pecuniary benefits (not available for this study);
- Dimension 3 on Working time and work-life balance includes the following subdimensions: Working hours (e.g., long working hours, multiple jobholders), Working time arrangements and Work-life balance (e.g., flexible works schedules);
- Dimension 4 on Security of employment and social protection includes the following subdimensions: Security of employment (e.g., job tenure) and Social protection (e.g., permanent and non-permanent employment, employment type);
- Dimension 5 on Social dialogue includes the following subdimensions: Collective bargaining coverage rate, Trade union density rate and Days not worked due to strikes and lockouts (not available for this study);
- Dimension 6 on Skills development and training; and
- Dimension 7 on Employment-related relationships and work motivation includes the following subdimensions: Employment-related relationships (e.g., relationships with co-workers, supervisor) and Work motivation (not available for this study).
End of text box
Previous studies from Statistics Canada’s Quality of Employment in Canada publication have examined indicators including mental health risk factors, pay gap, discrimination at work, average earnings, low pay, working hours, multiple jobholders, employment rates of mothers and fathers, job tenure, collective bargaining coverage rate, trade union density rate, and relationships at work, to name a few (Statistics Canada, 2023a).
Some of these studies examined QoE among Indigenous peoples.Note For example, Indigenous people were more likely to experience discrimination at work than non-Indigenous people (15.2% versus 9.1%) (Statistics Canada, 2022b). Also, Indigenous workers (32.0%) were less likely to have a tenure of 10 years or more than non-Indigenous workers (37.3%) (Statistics Canada, 2022c). While these publications have shed light on QoE among Indigenous people using dimensions from the Statistical Framework on Quality of Employment, significant gaps remain. A recent study examining quality of employment among Indigenous graduates found that after taking into account demographic, education and industry characteristics, Métis graduates had similar incomes to non-Indigenous graduates, though First Nations graduates’ income remained lower than non-Indigenous graduates (Brunet, Corak & Galarneau, 2024).
Using monthly data from the LFS and LFS supplement for 2022,Note as well as data from the 2016 GSS on Canadians at Work and Home (cycle 30), this analysis will examine several QoE indicators among the Indigenous population aged 18 to 64 years, residing off reserve and living in the 10 provinces. The LFS was selected because it provides the most recent comprehensive suite of QoE indicators, with sufficient sample size to disaggregate estimates for the Indigenous population.
Descriptive statistics for the working Indigenous population (which includes First Nations people living off reserve, Métis, Inuit and people reporting multiple Indigenous identities), aged 18 to 64 years and living in the 10 provinces will be provided using annual estimates (12-month average) for 2022. When variables from the LFS supplement are presented, estimates will be provided for the month in question. Results will be disaggregated by Indigenous group, First Nations people living off reserve and Métis when possible. Since the LFS in the territories uses different survey methodology and the Inuit population overall is relatively small, disaggregation for the Inuit population was not possible in this study. Throughout the study, the terminology ‘First Nations people’ will be used to signify First Nations people living off reserve.
Understanding the QoE among Indigenous peoples can help identify disparities, bridge knowledge gaps and inform policies aimed at promoting equity in the labour force. Indigenous people often face discrimination, limited access to education and resources, and historical marginalization. Additionally, QoE can significantly affect the overall health and well-being of individuals and communities (Peckham et al., 2019). By identifying specific challenges and barriers faced by Indigenous workers, policymakers can implement targeted strategies aimed at improving their job opportunities and working conditions. Changing labour markets and conditions of employment place further onus to explore QoE among Indigenous people.
Results
Pay gap, access to managerial positions and discrimination at work speak to fair treatment in employment, a sub-dimension of Statistics Canada’s Statistical Framework on Quality of Employment. The following sections examine these indicators among Indigenous people with comparisons to non-Indigenous people for context.
Ethics and employment (1Note ) and Income and benefits (2)
Gender pay gap was slightly smaller among Indigenous people than non-Indigenous people, though Indigenous people still earned 9% less than non-Indigenous people
Pay equity is a key determinant of economic well-being and specifically, gender pay gap is recognized as being “symbolic of gender-based discrimination and injustice” (Moyser, 2019, p. 5).
According to the annual LFS estimates for 2022,Note among employees, the average hourly earnings of Indigenous people aged 18 to 64 years was $29.62 per hour (Chart 1), 9% less than those of non-Indigenous people ($32.58 per hour). In other words, Indigenous employees earned $0.91 for every dollar earned by non-Indigenous employees.
First Nations employees living off reserve had the lowest average hourly earnings ($28.78 per hour), while Métis employees made slightly more ($30.38 per hour)—both were significantly lower than non-Indigenous people ($32.58 per hour).
Overall, the pay gap between men and women was smaller among First Nations people and Métis than non-Indigenous people. First Nations men earned 8.4% more in average hourly earnings than First Nations women (in other words, women earned $0.92 for every dollar earned by men), while Métis men earned 13.3% more than Métis women (or $0.88 for every dollar earned by men). By comparison, non-Indigenous men earned 15.5% more than non-Indigenous women (or women earned $0.87 for every dollar earned by men).

Data table for Chart 1
| Indigenous identity | Men | Women | Total |
|---|---|---|---|
| average hourly earnings (in dollars) | |||
| First Nations people living off reserve | 29.98 | 27.66Data table for Chart 1 Note † | 28.78Note * |
| Métis | 32.28 | 28.50Data table for Chart 1 Note † | 30.38Note * |
| Indigenous | 31.16 | 28.13Data table for Chart 1 Note † | 29.62Note * |
| Non-Indigenous (reference) | 34.89 | 30.20Data table for Chart 1 Note † | 32.58 |
|
|||
Average hourly earnings tended to be lowest in the Atlantic provinces and highest in Ontario among Indigenous and non-Indigenous people, though average hourly earnings were lower among Indigenous people compared with non-Indigenous people in each province (Chart 2).

Data table for Chart 2
| Region | Indigenous | Non-Indigenous (reference) |
|---|---|---|
| average hourly earnings (in dollars) | ||
| Atlantic provinces | 27.16Note * | 28.45 |
| Quebec | 29.73Note * | 31.71 |
| Ontario | 30.69Note * | 33.54 |
| Prairie provinces | 29.41Note * | 32.59 |
| British Columbia | 29.61Note * | 33.12 |
|
||
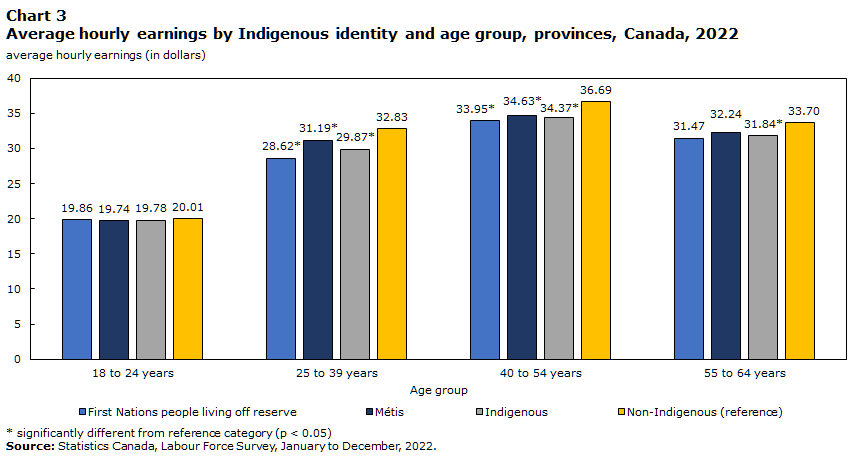
Indigenous people are younger than the non-Indigenous people, with 17.2% of employed Indigenous peopleNote being aged 18 to 24 years compared with 11.7% of non-Indigenous people. Younger workers tend to have lower average hourly earnings than older adults, because they are more likely to be employed in part-time jobs or are at the beginning of their careers and thus have less experience (Morissette, 2021), which may partly explain the lower average hourly earnings among Indigenous people. This was evident when average hourly wages were examined by age group. For example, young Indigenous and non-Indigenous adults aged 18 to 24 years made about $20.00 per hour, while adults aged 25 to 39 years and aged 40 to 54 years made over 50 percent more, from $29.00 to $37.00 per hour (Chart 3). Additionally, Indigenous people also had larger shares represented in lower income occupations. For example, in 2022, Indigenous people had a larger relative share in sales and services occupations compared with non-Indigenous people (24.4% versus 21.9%) (Statistics, Canada, 2023b), and this occupation group has the lowest average hourly wage at $20.44 (Statistics Canada, 2023c). However, a wage gap between Indigenous and non-Indigenous employees was evident among those aged 25 to 39 years, 40 to 54 years and 55 to 64 years. First Nations people ($33.95) and Métis ($34.63) aged 40 to 54 years earned less than their non-Indigenous counterparts ($36.69), and similar trends were observed among people aged 25 to 39 years. Previous research has alluded to the role of colonial and contemporary discriminatory practices in the labour market to explain the pay gap (Paul, 2020).
Data table for Chart 3
| Age group | First Nations people living off reserve | Métis | Indigenous | Non-Indigenous (reference) |
|---|---|---|---|---|
| average hourly earnings (in dollars) | ||||
| 18 to 24 years | 19.86 | 19.74 | 19.78 | 20.01 |
| 25 to 39 years | 28.62Note * | 31.19Note * | 29.87Note * | 32.83 |
| 40 to 54 years | 33.95Note * | 34.63Note * | 34.37Note * | 36.69 |
| 55 to 64 years | 31.47 | 32.24 | 31.84Note * | 33.70 |
|
||||
First Nations people were less likely to hold managerial roles than non-Indigenous people
Because of various systemic inequities, access to managerial positions, among other positions of leadership, are less likely for Indigenous people than non-Indigenous people (Ciceri & Scott, 2006; Sutter & Esses, 2021). Of equal importance is the impact of Indigenous people in management positions; positive impacts can include increased sensitivity to challenges faced by Indigenous employees (Caron, Asselin, & Beaudoin, 2019). Furthermore, Call to Action 92 in the 2015 Truth and Reconciliation Commission report calls on the corporate sector to ensure that Indigenous peoples “have equitable access to jobs, training, and education opportunities in the corporate sector”. Examining the share of workers in managerial positions (e.g., decision-making and management roles) by different population groups helps identify disparities, thus encouraging a better understanding of the barriers preventing equitable representation in managerial positions.
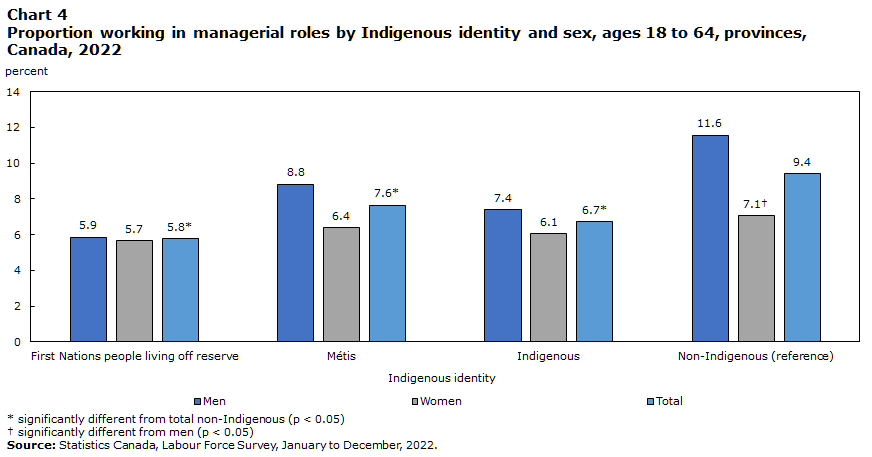
According to the LFS for 2022, First Nations people and Métis were less likely to be in managerial positions compared with non-Indigenous people (5.8% and 7.6% versus 9.4%) (Chart 4).
Men had significantly higher shares working in management roles compared with women among employed people living in Canada overall, though no significant differences were seen between men and women among First Nations, Métis, or Indigenous people.
Data table for Chart 4
| Indigenous identity | Men | Women | Total |
|---|---|---|---|
| percent | |||
| First Nations people living off reserve | 5.9 | 5.7 | 5.8Note * |
| Métis | 8.8 | 6.4 | 7.6Note * |
| Indigenous | 7.4 | 6.1 | 6.7Note * |
| Non-Indigenous (reference) | 11.6 | 7.1Data table for Chart 4 Note † | 9.4 |
|
|||
Among Indigenous people working in management occupations, Indigenous women were nearly twice as likely to work in specialized middle management positionsNote (55.4% versus 28.5%) and middle management occupations in retail and wholesale trade and customer services (35.2% versus 15.7%) than Indigenous men (Chart 5). However, among those in management occupations, Indigenous men were eight times more likely to work in middle management occupations in trades, transportation, production, and utilities than Indigenous women (53.8% versus 6.7%E).
When comparing Indigenous and non-Indigenous men employed in management occupations, Indigenous men were more likely to work in middle management occupations in trades, transportation, production and utilities than non-Indigenous men (53.8% versus 39.2%). Conversely, Indigenous men were less likely than non-Indigenous men to work in middle management occupations in retail and wholesale trade and customer services (15.7%E versus 25.7%). Regarding women workers, Indigenous women were less likely than non-Indigenous women to work in middle management roles in occupations in trades, transportation, production and utilities (6.7%E versus 14.2%).

Data table for Chart 5
| Management_type | Indigenous men | Indigenous women | Non-Indigenous men | Non-Indigenous women |
|---|---|---|---|---|
| percent | ||||
| Specialized middle management occupations, including managers in health care, administration and education | 28.5 | 55.4Note † | 32.1 | 52.5Note † |
| Middle management occupations in retail and wholesale trade and customer services | 15.7Note E: Use with caution | 35.2Note † | 25.7 | 30.7Note † |
| Middle management occupations in trades, transportation, production and utilities | 53.8 | 6.7Note E: Use with caution | 39.2 | 14.2Note † |
E use with caution
Source: Statistics Canada, Labour Force Survey, January to December, 2022. |
||||
Prevalence of low pay remained higher among First Nations people living off reserve, in particular women, compared with non-Indigenous people
Income and benefits of employment are key indicators of QoE (UNECE, 2015a). In describing the pay gap between Indigenous and non-Indigenous people, the previous section provided a glimpse of hourly earnings. While pay gap describes the disparities in earnings and pertains to fairness in employment, the prevalence of low pay as a distribution-based indicator in the Statistical Framework on Quality of Employment attempts to examine the prevalence of hardship.
An individual is identified as having low pay if their pay is less than two-thirds of the median provincial wage and it informs on issues related to income equality and may be used as a proxy for economic hardship (UNECE, 2015b). For example, based on the population aged 18 to 64 years, the median provincial wage for Ontario was $28.29 per hour and two-thirds of that median wage would be $18.86, therefore anyone working in Ontario with an average hourly wage of less than $18.86 would be considered low-income earners. Based on recent findings from the 2021 Census, 18.8% of Indigenous people lived in a low-income household (based on the low-income measure, after tax [LIM-AT]) compared with 10.7% of non-Indigenous people (Statistics Canada, 2022d).
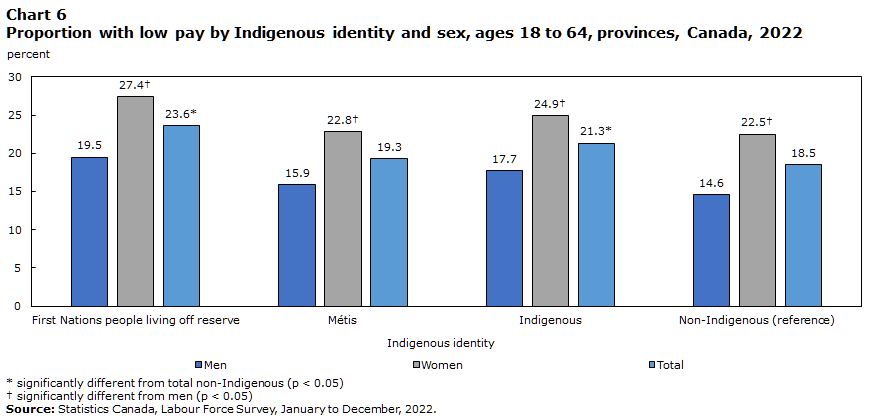
Consistent with this finding, the LFS data suggest that Indigenous people had significantly higher shares reporting low pay compared with non-Indigenous people (21.3% versus 18.5%) (Chart 6).
More specifically, First Nations people had significantly larger shares reporting low pay than non-Indigenous people (23.6% versus 18.5%), while Métis reported similar shares to that of non-Indigenous people (19.3% versus 18.5%).
Women more often reported low pay compared with men among Indigenous people (24.9% versus 17.7%) and non-Indigenous people (22.5% versus 14.6%).
Data table for Chart 6
| Indigenous identity | Men | Women | Total |
|---|---|---|---|
| percent | |||
| First Nations people living off reserve | 19.5 | 27.4Data table for Chart 6 Note † | 23.6Note * |
| Métis | 15.9 | 22.8Data table for Chart 6 Note † | 19.3 |
| Indigenous | 17.7 | 24.9Data table for Chart 6 Note † | 21.3Note * |
| Non-Indigenous (reference) | 14.6 | 22.5Data table for Chart 6 Note † | 18.5 |
|
|||
Young workers aged 18 to 24 years were four times more likely to report low pay than workers aged 25 to 39 years (54.7% versus 13.7%), nearly five times more likely than those aged 40 to 54 years (11.1%) and 3.5 times more likely than those aged 55 to 64 years (15.8%), though there were some notable differences by Indigenous identity. First Nations people aged 25 to 39 years were more likely to report low pay than their non-Indigenous counterparts (20.2% versus 13.5%) (Chart 7).

Data table for Chart 7
| Age group | First Nations people living off reserve | Métis | Indigenous | Non-Indigenous (reference) |
|---|---|---|---|---|
| percent | ||||
| 18 to 24 years | 50.9 | 54.2 | 52.9 | 54.8 |
| 25 to 39 years | 20.2Note * | 13.1 | 16.6Note * | 13.5 |
| 40 to 54 years | 11.4 | 9.9 | 10.5 | 11.2 |
| 55 to 64 years | 19.0 | 12.8 | 15.4 | 15.8 |
|
||||
Regarding household composition, Indigenous adults without children (non-parents) were more than twice as likely to work in a low pay job than Indigenous parents (24.5% versus 11.7%). This finding is probably linked to age, as non-parents may be more likely to report low pay because of their age (e.g., a larger share of young adults is represented within this group). For example, Indigenous young adults aged 18 to 24 years represented 1.2% of Indigenous parents while they made up nearly one-quarter of those that were not parents (24.2%). Among Indigenous parents who were employed, Indigenous women who were parents were nearly 2.5 times more likely to work in a low pay job than Indigenous men who were parents (16.1% versus 6.6%).
Unfair treatment and discrimination related to work were more common among Indigenous people than non-Indigenous people, in particular being denied training or promotion
Discrimination at work, a primary indicator of fair treatment at work, has numerous detrimental impacts including denial of opportunities to equal pay, access to managerial positions or exposure to poor working conditions (UNECE, 2015b). Discrimination is defined as treating people differently, negatively, or adversely because of their race, age, religion, sex or anything else. The 2016 GSS on Canadians at Work and Home (cycle 30) asked if respondents experienced any unfair treatment or discrimination while at work in the past 12 months.
In 2016, First Nations people living off reserve were about twice as likely to have reported experiencing unfair treatment and discrimination than non-Indigenous people (16.9%E versus 8.2%) (data not shown). Women were more likely to have reported unfair treatment and discrimination at work than men (11.4% versus 7.5% overall), with Indigenous women being nearly twice as likely to report having experienced discrimination at work than non-Indigenous women (20.9%E versus 9.8%). Small sample sizes precluded an examination by age group and industry type.
Of those who reported experiencing unfair treatment or discrimination, similar shares of Indigenous and non-Indigenous people experienced being denied a promotion or training (23.0%E and 22.3%, respectively).
Furthermore, Indigenous people were three times more likely to report having experienced sexual harassment at work in the past 12 months than non-Indigenous people (6.8%E versus 2.3%).
Working time and work-life balance (3)
Working time and work-life balance is a key dimension of the Statistical Framework on Quality of Employment and is related to earnings, physical and mental well-being, and time available for recreation and family responsibilities, as excessively long working hours and atypical working hours have been found to negatively impact physical and mental well-being (UNECE, 2015b). Little previous research has been done on work-life balance among Indigenous people in Canada. The LFS enables the examination of average working hours, prevalence of working long hours, involuntary part-time work or irregular hours and flexible working conditions (including access to work from home arrangements) among Indigenous people.
Similar average weekly hours were reported among First Nations people, Métis and non-Indigenous people, however Indigenous men worked more hours per week than their female counterparts
According to the Quality of Employment Framework (UNECE, 2015b), average weekly working hours is an indirect measure of work-life balance, as it informs on how much time an individual is able to commit to activities other than work.
First Nations people, Métis and non-Indigenous people reported similar average weekly hours (36.5 hours, 37.0 hours and 36.6 hours, respectively).
Men worked on average more weekly hours than women among Indigenous and non-Indigenous people. More specifically, First Nations and Métis men worked on average six hours per week more than their female counterparts (39.6 and 40.0 hours versus 33.5 and 33.9 hours), and non-Indigenous men worked on average five hours more per week than non-Indigenous women (39.0 hours and 34.0 hours, respectively) (Chart 8).

Data table for Chart 8
| Indigenous identity | Men (reference | Women | Total |
|---|---|---|---|
| average weekly hours | |||
| First Nations people living off reserve | 39.6 | 33.5Data table for Chart 8 Note † | 36.5 |
| Métis | 40.0 | 33.9Data table for Chart 8 Note † | 37.0 |
| Indigenous | 39.9 | 33.8Data table for Chart 8 Note † | 36.8 |
| Non-Indigenous | 39.0 | 34.0Data table for Chart 8 Note † | 36.6 |
|
|||
Indigenous men were 2.6 times more likely to work long hours than Indigenous women
The higher average hours worked among men may be linked to having excessively long working hours, which is an indicator of overwork and may be associated with negative effects on the workers’ physical and mental health, work-life balance, and safety in the workplace (UNECE, 2015b).
Indigenous men were 2.6 times more likely to work long hours than Indigenous women (13.4% versus 5.1%), while non-Indigenous men were 2.3 times more likely to work long hours than non-Indigenous women (11.9% versus 5.1%) (Chart 9).

Data table for Chart 9
| Indigenous identity | Men | Women | Total |
|---|---|---|---|
| percent | |||
| First Nations people living off reserve | 13.4 | 5.1Data table for Chart 9 Note † | 9.2 |
| Métis | 13.3 | 5.2Data table for Chart 9 Note † | 9.3 |
| Indigenous | 13.4 | 5.1Data table for Chart 9 Note † | 9.3 |
| Non-Indigenous (reference) | 11.9 | 5.1Data table for Chart 9 Note † | 8.6 |
|
|||
Among Indigenous and non-Indigenous people, those living in the Atlantic provinces and Alberta typically had the highest shares of working long hours, while those working in Quebec had the lowest share working long hours (Chart 10). More specifically, Indigenous people living in Prince Edward Island had the highest share working long hours (18.3%E), followed by Newfoundland and Labrador (16.3%), New Brunswick (12.1%E), and Alberta (12.0%), while Quebec had the lowest share at 5.6%E.

Data table for Chart 10
| Provinces | Indigenous | Non-Indigenous (reference) |
|---|---|---|
| percent | ||
| Canada | 9.3 | 8.6 |
| Newfoundland and Labrador | 16.3Note * | 12.8 |
| Prince Edward Island |
18.3Note E: Use with caution | 12.4 |
| Nova Scotia |
8.8 | 9.3 |
| New Brunswick |
12.1Note E: Use with caution | 10.0 |
| Quebec | 5.6Note E: Use with caution | 6.5 |
| Ontario | 8.1 | 8.4 |
| Manitoba | 8.3Note * | 10.1 |
| Saskatchewan | 9.4Note * | 12.0 |
| Alberta | 12.0 | 11.4 |
| British Columbia | 9.7 | 8.8 |
E use with caution
|
||
Involuntary part-time was more prevalent among Indigenous people than non-Indigenous people, with men having higher shares of involuntary part-time work compared with women
Involuntary part-time work is defined as working fewer than 30 hours per week but doing so involuntarily. It is considered an indicator of underemployment and may be associated with financial stress (Statistics Canada, 2022e). The involuntary part-time rate is expressed as the number of involuntary part-time employees as a proportion of all employees. Involuntary part-time work may be attributable to economic reasons, poor business conditions or inability to find full-time work and can be linked to reduced income opportunities (UNECE, 2015b).
Almost one-quarter of Indigenous people working fewer than 30 hours per week did so involuntarily (23.9%), a rate significantly higher than that of non-Indigenous people (18.6%). Over one-quarter of First Nations people working fewer than 30 hours per week did so involuntarily, a rate significantly higher than that of non-Indigenous people (26.2% versus 18.6%).
Indigenous men had higher shares reporting involuntary part-time work than Indigenous women (31.3% versus 20.8%). Non-Indigenous men and women showed similar trends, however both non-Indigenous men and women had had significantly lower shares than their Indigenous counterparts.
Women were more likely to have multiple jobs than men among Indigenous and non-Indigenous people
Multiple job holding or having two or more jobs simultaneously may be the result of financial necessity to ensure continuous employment or may be reflective of the “gig economy.”Note Despite some benefits, it may come with an increased risk of injury (Fulford & Patterson, 2019) and negative well-being for the workers and their children (Conen & Stein, 2021). Year over year since the late 1980s, women have been shown to be over-represented in multiple job holding than men (Statistics Canada, 2022f).
According to 12 months averaged of the LFS for 2022, First Nations people had similar shares working multiple jobs as non-Indigenous people (5.6% and 5.6%, respectively), while Métis had significantly lower shares working multiple jobs (4.7%) (Chart 11).
Industries based on the respondent’s main job that had the highest rates of multiple job holders among Indigenous workers included health care and social assistance (7.5%), and educational services (7.4%). For non-Indigenous people, similar industries saw higher shares of multiple job holders (8.3% and 8.3%, respectively), however higher shares of multiple job holders in information and cultural industries (8.0%) and accommodation and food services (7.5%) were also observed.
Significantly higher shares of Indigenous women were multiple job holders than Indigenous men (5.9% versus 4.5%), and similar trends were observed among non-Indigenous women and men (6.5% versus 4.8%). The disparity between the sexes was especially notable among Métis women and men (5.9% versus 3.6%). Among First Nations people, no gender difference was evident.

Data table for Chart 11
| Indigenous identity | Men | Women | Total |
|---|---|---|---|
| percent | |||
| First Nations people living off reserve | 5.2 | 6.0 | 5.6 |
| Métis | 3.6 | 5.9Data table for Chart 11 Note † | 4.7Note * |
| Indigenous | 4.5 | 5.9Data table for Chart 11 Note † | 5.2 |
| Non-Indigenous (reference) | 4.8 | 6.5Data table for Chart 11 Note † | 5.6 |
|
|||
First Nations people living off reserve were more likely to work irregular hours, irregular shifts or on call than non-Indigenous people
Those working irregular hours have previously been reported to experience greater work stress and work-family conflict than those working regular hours (Golden & Jaeseung, 2017). However, for some, working at night or in the evening may not be considered a disadvantage.
According to the April 2022 LFS supplement, Indigenous and non-Indigenous workers reported low shares usually working at night (1.5%E and 1.8%, respectively). Shares were 2.2%E among Métis; however, they did not statistically differ from that of non-Indigenous people (1.8%) (Chart 12). The vast majority of people (about 70% or higher) reported working regular daytime hours.
Over 1 in 20 employed Indigenous adults worked in the evening (5.9%), similar to 4.3% of non-Indigenous people. By Indigenous group, the share of First Nations people who worked evening shifts did not significantly differ from non-Indigenous people (5.4%E and 4.3%, respectively). This was also the case among Métis (6.6%E).
First Nations people were more likely to work irregular hours, irregular shifts or on call (24.0%), while rates of Métis working irregular hours were similar to that of non-Indigenous people (18.3% and 15.5%, respectively).

Data table for Chart 12
| Schedule | First Nations people living off reserve | Métis | Indigenous | Non-Indigenous (reference) |
|---|---|---|---|---|
| percent | ||||
| Irregular hours | 24.0Note * | 18.3Note * | 20.7Note * | 15.5 |
| Regular daytime | 69.7Note * | 72.9Note * | 71.9Note * | 78.4 |
| Regular evening | 5.4Note E: Use with caution | 6.6Note E: Use with caution | 5.9 | 4.3 |
| Regular night | X | 2.2Note E: Use with caution | 1.5Note E: Use with caution | 1.8 |
|
X suppressed to meet the confidentiality requirements of the Statistics Act E use with caution
|
||||
Indigenous people were less likely to report having a flexible work schedule that allows them to choose the time when their workday begins and ends than non-Indigenous people
It is well established that job flexibility in day-to-day work tasks and scheduling is associated with greater job satisfaction (Martin, 2018; Statistics Canada, 2016). Furthermore, there appears to be a greater demand for workplace and work schedule flexibility, in particular among younger generations (e.g., Millennials and Generation ZNote ) (Deloitte, 2018; Finn & Donovan, 2013) and flexible work arrangements may be markedly helpful in meeting family demands, especially among women (Singley & Hynes, 2005).
According to April 2022 LFS supplement data, Indigenous workers were less likely to report having a flexible schedule that allows them to choose the time when their work day begins and ends than non-Indigenous people (29.9% versus 36.1%). About 3 in 10 Métis and First Nations people reported having a flexible work schedule (29.0% and 31.1%, respectively), though only the estimate for Métis was significantly lower from that of non-Indigenous people (29.0% versus 36.1%, respectively).
Similar shares of Indigenous men and women reported having a flexible schedule that allowed them to choose the time when their work day begins and ends (30.1% and 29.6%, respectively). While both were lower than that of non-Indigenous men and women (37.6% and 34.4%, respectively), only the difference between Indigenous and non-Indigenous men was significant.
Indigenous parents with children at home tended to have greater work schedule flexibility than non-parents (37.7% versus 26.4%), which was a similar trend observed among non-Indigenous parents with children and non-parents (40.5% versus 33.9%). When comparing Indigenous and non-Indigenous people, only Indigenous non-parents significantly differed on work schedule flexibility, reporting a lower rate of flexibility than non-Indigenous non-parents (26.4% versus 33.9%).
Younger Indigenous employees aged 18 to 24 years tended to have less schedule flexibility than those aged 25 to 39 years, those aged 40 to 54 years or those approaching retirement (aged 55 to 64 years) (21.1%E versus 30.8%, 31.3% and 34.5%, respectively). This finding may possibly be related to a greater share of those in the younger age group employed in precarious positions (e.g., non-permanent jobs). For example, among Indigenous people, rates for non-permanent jobs were 22.7% among young adults, 10.9% among 25 to 39 years olds, 6.7% among 40 to 54 years olds and 10.4% among employees aged 55 to 64 years. Although the rates of flexibility were higher among non-Indigenous people overall, only non-Indigenous people aged 25 to 39 years and those aged 40 to 54 years reported significantly more work schedule flexibility than their Indigenous counterparts (36.8% and 38.5% versus 30.9% and 31.3%).
Two-thirds of Indigenous people reported that it was easy or very easy to take an hour or two off for personal or family matters during working hours (66.2%), similar to the share of non-Indigenous people (68.5%). First Nations people and Métis also reported similar shares (65.8% and 66.4%, respectively).
Indigenous people were equally likely to report that they sometimes, often or always had difficulty fulfilling family responsibilities because of the amount of time spent working than non-Indigenous people (33.3% and 31.9%, respectively). First Nations people and Métis reported similar shares (33.6% and 33.1%, respectively).
Indigenous people working at least some of the time at home were three times more likely to report having a flexible work schedule than those working outside the home
Recent research has demonstrated that those who work from home all of the time are more satisfied with work-life balance than those who work outside the home some of the time or all of the time (Canadian Social Survey, 2022). Using a 12-month average from the LFS supplement for 2022, Indigenous employees aged 18 to 64 years were significantly more likely to work outside the home than non-Indigenous employees (83.4% versus 73.5%). This finding may be partly explained by the greater prevalence of Indigenous people working in the retail sector and accommodations and food services sector (Anderson, 2019; Hahmann et al., 2019), sectors that require greater in-person contact (Clarke & Hardy, 2022).
Indigenous people were significantly less likely to work at least some of the time from home than non-Indigenous people (16.6% versus 26.5%). Across Indigenous groups, First Nations people and Métis (16.5% and 16.7%, respectively) were also significantly less likely to work some of the time at home than non-Indigenous people (26.5%). When looking at monthly responses to the work location question, Indigenous people were significantly less likely to work some of the time at home across all 12 months (data not shown).
Indigenous people working partly or all of the time at home were three times more likely to report having a flexible work schedule than those working outside of the home (68.6% versus 22.9%). Of those working partly or all of the time at home, work schedule flexibility was similar among Indigenous people than non-Indigenous people (68.6% and 63.6%, respectively). By contrast, of those working outside of the home, Indigenous people were significantly less likely to report work schedule flexibility than their non-Indigenous counterparts (22.9% versus 26.8%, respectively).
Security of employment and social protection (4)
First Nations people living off reserve had a higher rate of short tenure jobs (less than 12 months) than non-Indigenous people
Job tenure can speak to the permanency of an individual’s employment and is an indicator of job stability in the labour market (UNECE, 2015b). It is the length of time an individual has worked with the same employer. Previous research has observed that Indigenous people living off reserve tend to have shorter job tenure than non-Indigenous people (Statistics Canada, 2022c).
First Nations people and Métis had significantly higher rates of short tenure jobs (less than 12 months) than non-Indigenous people (24.3% and 21.6% versus 19.1%), while First Nations people had significantly lower rates of high tenure jobs (10 years or more) than non-Indigenous people (24.6% versus 30.8%) (Chart 13).

Data table for Chart 13
| Tenure | First Nations people living off reserve | Métis | Indigenous | Non-Indigenous (reference) |
|---|---|---|---|---|
| percent | ||||
| Less than 12 months | 24.3Note * | 21.6Note * | 23.1Note * | 19.1 |
| 1 to less than 5 years | 35.8Note * | 32.8 | 34.1 | 32.8 |
| 5 years to less than 10 years | 15.3Note * | 16.8 | 16.1Note * | 17.3 |
| 10 years or more | 24.6Note * | 28.8 | 26.7Note * | 30.8 |
|
||||
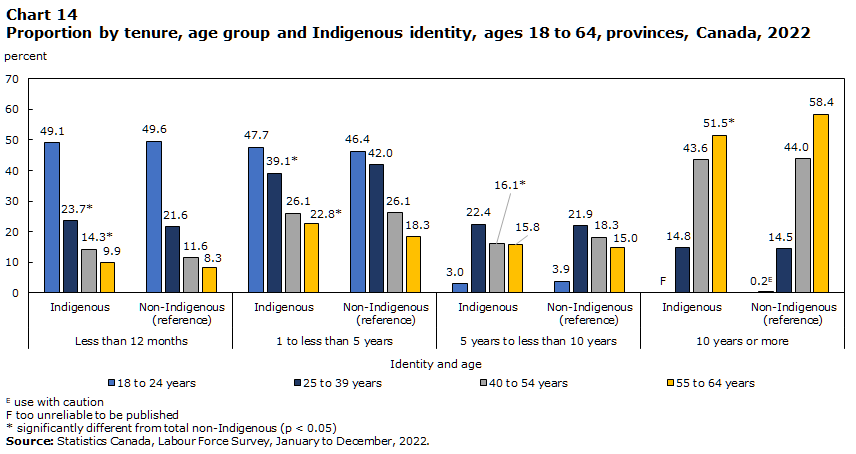
TenureNote is strongly related to the age of workers, in addition to the employees’ industry and occupation. Young Indigenous and non-Indigenous workers were similarly represented among those with low tenure―they made up nearly half of those with a tenure of less than 12 months (49.1% and 49.6%, respectively) (Chart 14). Indigenous people also have higher shares working in industries with higher rates of short tenures, such as accommodation and food services (Statistics Canada, 2022c). However, among 25- to 39-year-old workers, Indigenous people were over-represented among those with a tenure of under 12 months compared to their non-Indigenous counterparts (23.7% versus 21.6%), as were Indigenous workers aged 40 to 54 years (14.3% versus 11.6%). This over-representation was also the case among those aged 55 to 64 years (9.9% versus 8.3%). A similar pattern emerged among those with a tenure of one to five years. While the prevalence of a tenure of 10 or more years was similar among Indigenous and non-Indigenous workers aged 25 to 39 years (14.8% and 14.5%, respectively) and those aged 40 to 54 years (43.6% and 44.0%, respectively), Indigenous people aged 55 to 64 years were less likely to have this tenure length than their non-Indigenous counterparts (51.5% versus 58.4%).
Data table for Chart 14
| Identity and age | Less than 12 months | 1 to less than 5 years | 5 years to less than 10 years | 10 years or more | ||||
|---|---|---|---|---|---|---|---|---|
| Indigenous | Non-Indigenous (reference) | Indigenous | Non-Indigenous (reference) | Indigenous | Non-Indigenous (reference) | Indigenous | Non-Indigenous (reference) | |
| percent | ||||||||
| 18 to 24 years | 49.1 | 49.6 | 47.7 | 46.4 | 3.0 | 3.9 | Note F: too unreliable to be published | 0.2Note E: Use with caution |
| 25 to 39 years | 23.7Note * | 21.6 | 39.1Note * | 42.0 | 22.4 | 21.9 | 14.8 | 14.5 |
| 40 to 54 years | 14.3Note * | 11.6 | 26.1 | 26.1 | 16.1Note * | 18.3 | 43.6 | 44.0 |
| 55 to 64 years | 9.9 | 8.3 | 22.8Note * | 18.3 | 15.8 | 15.0 | 51.5Note * | 58.4 |
|
E use with caution F too unreliable to be published
|
||||||||
Indigenous people working in managerial occupations were significantly more likely to have held a job for 10 years or more than to those working in non-management roles (44.3% versus 25.5%), while the rates among non-Indigenous people were 43.9% and 29.7%, respectively. Indigenous people working in non-management roles had significantly lower shares having held a job for 10 years or more years compared with non-Indigenous people (25.5% versus 29.7%). Furthermore, Indigenous people working in non-management occupations were more than twice as likely to have held a job for less the 12 months than those in management occupations (24.1% versus 8.4%), while the rates among non-Indigenous people were 20.0% and 9.8%, respectively. Indigenous people working in non-management occupations were significantly more likely to have held a job for less than 12 months than non-Indigenous people (24.1% versus 20.0%).
Among Indigenous people, tenures of 10 years or more were most common among those working in public administration (44.2%), finance and insurance (38.8%), and health care and social assistance (37.7%), and less common among those working in accommodations and food services (8.9%) and retail trade (14.9%). By contrast, short tenure of less than 12 months was most common among Indigenous people working in accommodations and food services (38.5%), manufacturing (31.6%), retail trade (30.3%), and other services (except public administration) (28.8%) and were least common among educational services (11.8%), public administration (15.4%), agriculture, forestry, fishing and hunting (16.1%E), and professional, scientific and technical services (17.6%).
Non-permanent jobs were more prevalent among Indigenous than non-Indigenous people
Job permanency can be used as a proxy for security of employment (UNECE, 2015b). According to the 2022 LFS, employed First Nations people were more likely to work in non-permanent jobs than non-Indigenous people (12.9% versus 11.0%), while the share of Métis working in these jobs (10.7%) was similar to that of non-Indigenous people. Of those working in non-permanent jobs, Indigenous people, and more specifically Métis were more likely to work a seasonal job than non-Indigenous people (22.3% and 26.9% versus 15.6%) (Chart 15). Conversely, First Nations people and Métis were less likely to work temporary, term or contract jobs than non-Indigenous people (49.4% and 50.8% versus 59.8%).

Data table for Chart 15
| Non-permanent employment | First Nations people living off reserve | Métis | Indigenous | Non-Indigenous (reference) |
|---|---|---|---|---|
| percent | ||||
| Seasonal job | 19.4 | 26.9Note * | 22.3Note * | 15.6 |
| Temporary, term or contract job | 49.4Note * | 50.8Note * | 50.5Note * | 59.8 |
| Casual job | 27.0 | 19.0 | 23.4 | 19.9 |
| Other | 4.2Note E: Use with caution | 3.4Note E: Use with caution | 3.8Note E: Use with caution | 4.6 |
E use with caution
|
||||
Non-permanent job status did not significantly differ between First Nations men and women (13.1% and 12.6%) and Métis men and women (10.3% and 11.0%); however, it did differ between non-Indigenous men and women (9.7% versus 12.4%). Of those that worked in non-permanent jobs among Indigenous and non-Indigenous people, men were more likely to work in seasonal jobs than women, and women were more likely to work in casual jobs than men.
Social dialogue (5)
Métis had higher rates of collective bargaining coverage than non-Indigenous people
The presence of trade unions at the workplace helps employees’ voices be heard within organizations (UNECE, 2015b). In general, the main role of the unions is to negotiate, or bargain, with employers on behalf of their members. When a workforce is unionized, the terms and conditions of their employment are typically established by a “collective bargaining agreement.” In this section, LFS data are used to examine the rate of employees covered by collective bargaining agreements and rates of employees who are members of one or more trade unions, respectively.
The collective bargaining coverage rate includes union members and non-union members that are covered by a collective agreement. According to 12 months of averaged data from the LFS for 2022, Indigenous workers, and more specifically Métis workers had significantly higher rates of collective bargaining coverage than non-Indigenous people (34.2% and 35.9% versus 31.1%) (Chart 16). Women reported higher shares with collective bargaining coverage than men across all categories, however only non-Indigenous men significantly differed from non-Indigenous women (29.0% versus 33.2%) (Chart 16).

Data table for Chart 16
| Indigenous identity | Men | Women | Total |
|---|---|---|---|
| percent | |||
| First Nations people living off reserve | 31.5 | 33.1 | 32.3 |
| Métis | 34.2 | 37.5 | 35.9Note * |
| Indigenous | 32.7 | 35.6 | 34.2Note * |
| Non-Indigenous (reference) | 29.0 | 33.2Data table for Chart 16 Note † | 31.1 |
|
|||
These differences may be partly attributed to sectors with greater concentrations of collective bargaining coverage. Among Indigenous people in 2022, industries with higher rates of collective bargaining coverage included utilities (85.3%), public administration (73.4%), educational services (71.1%), and health care and social assistance (52.0%). Conversely, industries with low rates of collective bargaining coverage among Indigenous people included other services (except public administration) (2.4%E), accommodation and food services (4.7%E), and professional, scientific and technical services (5.2%E), industries where most employees were in the private sector. These findings are similar to previous snapshots of collective bargaining coverage for employed Canadians overall using the LFS in 2021 (Statistics Canada, 2022g).
Membership rates were similar among Indigenous and non-Indigenous people, with women having higher rates of union coverage than men across all identity categories
Concerning membership in one or more trade unions, Indigenous and non-Indigenous employees differed by union coverage rate. In 2022, the percentages of Indigenous people, and more specifically Métis people who were members of one or more trade unions were higher than that of non-Indigenous employees (32.0% and 33.3% versus 28.8%; data not shown). Overall, women were more likely to be a member of one or more trade unions, though differences were only significant among non-Indigenous women and men (31.0% versus 26.7%). However, the likelihood of being a member of one or more trade unions was the highest among employed Métis women (34.5%), while the rate was the lowest among employed non-Indigenous men (26.7%).
These differences may be partly attributed to sectors with greater concentrations of union coverage (Statistics Canada, 2022h). Among the Canadian population overall for 2022, industries with higher rates of union coverage include public administration (71.1%), educational services (70.4%), utilities (63.3%), and health care and social assistance (51.9%). Industries with low rates of union coverage include professional, scientific and technical services (2.8%) and agriculture, forestry, fishing and hunting (2.1%).
Employed Indigenous women made up a significantly larger share of industries with high concentrations of unionization compared with employed Indigenous men. For example, employed Indigenous women made up larger shares in public administration (9.1% versus 6.5%), educational services (11.9% versus 4.7%), and health care and social assistance (25.0% versus 5.1%) than men. Similar trends were observed among employed non-Indigenous women.
Skills development and training (6)
Indigenous people were more likely to report their employer not paying any costs or not having the possibility of participating in either partially or fully funded training by their employer
Training and development contribute to enhancing employment quality through skill enhancement, career advancement, engagement and motivation (Bakker, 2011), job security, autonomy, increased job satisfaction (Schmidt, 2007), and reduced turnover intentions (Koster, 2011).
In November 2022 of the LFS supplement, about one-third of employed First Nations people living off reserve and Métis attended any type of training, courses, seminars, conferences, private lessons or instructions outside the regular education system within the last 12 months (33.7% and 30.8%, respectively), though the differences were not statistically significant compared with non-Indigenous people (30.7%).
About 7 in 10 employed First Nations, Métis and non-Indigenous people reported not having the possibility of either partially or fully funded training by their employer during the last 12 months (71.3%, 71.1% and 69.2%, respectively).
First Nations people who had participated in training were significantly more likely to report that their employer did not pay any costs when non-Indigenous people (84.2% versus 75.2%), while the share among Métis was similar to that of non-Indigenous people (75.8% versus 75.2%).
The most common types of training taken were similar among Indigenous and non-Indigenous people, with job-specific training (e.g., professional training, equipment, occupational health and safety) being the most prevalent (84.8% and 80.7%, respectively). The second most common type of training was personal development training (e.g., time and stress management) where the share was also similar among Indigenous and non-Indigenous people (13.5% and 16.4%, respectively).
Among those who reported no training in the last 12 months in November 2022 of the LFS supplement, the reasons for not attending training were similar among Indigenous and non-Indigenous people, with the majority reporting no need for training (76.1% and 76.6%), being too busy to take training (9.2% and 12.6%), personal and family responsibilities (7.4%E and 6.4%), and training being too expensive (5.9%E and 6.0%; data not shown).
Multivariate analysis
Earnings gaps between Indigenous and non-Indigenous employees were largely accounted for by sex, age group and highest level of education
The results of earnings gap analyses, an indicator under Dimension 1 on Safety and ethics of employment, under the subdimension on Fair treatment in employment, suggested a significant gap between Indigenous and non-Indigenous people, men and women, and different age groups. These findings are supported by numerous previous studies that have also suggested an association between the level of education and other factors and earnings (Statistics Canada, 2023d; Ross, 2019; Paul, 2020). To estimate the association between earnings gaps and sociodemographic characteristics, multivariate analysis using ordinary least squares regression models was conducted to examine the gap in log-transformed average hourly earnings between Indigenous and non-Indigenous workers aged 25 years to 64 years after accounting for the sex, age group and highest level of education. First Nations people, Métis and Inuit were combined to increase sample size. Linear regression models were generated in a stepwise fashion, adding variables iteratively, to demonstrate how each factor influences the association between Indigenous identity and log-transformed average hourly earnings. Model 1 included self-reported Indigenous identity; Model 2 controlled for sex; Model 3 controlled for sex and age group; and Model 4 controlled for sex, age group and highest level of education.
Model 1 indicated that non-Indigenous people made 6.3% more in average hourly earnings than Indigenous people (Table 1), reflecting what was presented in earlier sections.
The adjusted gapNote in average hourly earnings decreased slightly in Model 2 after considering the sex of the individual, with non-Indigenous people making 6.2% more than Indigenous people holding sex constant. In Model 3, this gap remained relatively unchanged with the addition of the age group with non-Indigenous people earning 6.3% more in average hourly earnings. In Model 4, the addition of the highest level of education attained had the largest impact on the percent difference in average hourly earnings between Indigenous and non-Indigenous people, -0.7%, which was not statistically significant (p=0.64). A model was also tested including province of residence, whether respondent was in a management position, industry, and job tenure; however, it had a minimal impact and was discarded. A secondary analysis restricting the sample to those who worked full time during the full year was conducted and yielded similar results to examine the associations without those who potentially earn less than full-time full-year employees.
| Characteristics all Indigenous and non-Indigenous people | Model 1 | Model 2 | Model 3 | Model 4 | ||||||||
|---|---|---|---|---|---|---|---|---|---|---|---|---|
| β-coefficient | β-standard error | percent between Indigenous and non-Indigenous people Table 1 Note 1 | β-coefficient | β-standard error | percent between Indigenous and non-Indigenous people Table 1 Note 1 | β-coefficient | β-standard error | percent between Indigenous and non-Indigenous people Table 1 Note 1 | β-coefficient | β-standard error | percent between Indigenous and non-Indigenous people Table 1 Note 1 | |
| Intercept | ||||||||||||
| Intercept | 3.370Note * | 0.008 | Note ...: not applicable | 3.441Note * | 0.008 | Note ...: not applicable | 3.449Note * | 0.008 | Note ...: not applicable | 3.292Note * | 0.008 | Note ...: not applicable |
| Identity | ||||||||||||
| Indigenous (reference) | 1.000 | Note ...: not applicable | Note ...: not applicable | 1.000 | Note ...: not applicable | Note ...: not applicable | 1.000 | Note ...: not applicable | Note ...: not applicable | 1.000 | Note ...: not applicable | Note ...: not applicable |
| Non-Indigenous | 0.063Note * | 0.008 | 6.3 | 0.062Note * | 0.008 | 6.2 | 0.063Note * | 0.008 | 6.3 | -0.007 | 0.007 | -0.7 |
| Sex | ||||||||||||
| Male (reference) | Note ...: not applicable | Note ...: not applicable | Note ...: not applicable | 1.000 | Note ...: not applicable | Note ...: not applicable | 1.000 | Note ...: not applicable | Note ...: not applicable | 1.000 | Note ...: not applicable | Note ...: not applicable |
| Female | Note ...: not applicable | Note ...: not applicable | Note ...: not applicable | -0.142Note * | 0.003 | Note ...: not applicable | -0.142Note * | 0.003 | Note ...: not applicable | -0.176Note * | 0.003 | Note ...: not applicable |
| Age group | ||||||||||||
| 25 to 54 years (reference) | Note ...: not applicable | Note ...: not applicable | Note ...: not applicable | Note ...: not applicable | Note ...: not applicable | Note ...: not applicable | 1.000 | Note ...: not applicable | Note ...: not applicable | 1.000 | Note ...: not applicable | Note ...: not applicable |
| 55 to 64 years | Note ...: not applicable | Note ...: not applicable | Note ...: not applicable | Note ...: not applicable | Note ...: not applicable | Note ...: not applicable | -0.044Note * | 0.004 | Note ...: not applicable | 0.012Note * | 0.004 | Note ...: not applicable |
| Highest level of education | ||||||||||||
| High school or less (reference) | Note ...: not applicable | Note ...: not applicable | Note ...: not applicable | Note ...: not applicable | Note ...: not applicable | Note ...: not applicable | Note ...: not applicable | Note ...: not applicable | Note ...: not applicable | 1.000 | Note ...: not applicable | Note ...: not applicable |
| College or some university | Note ...: not applicable | Note ...: not applicable | Note ...: not applicable | Note ...: not applicable | Note ...: not applicable | Note ...: not applicable | Note ...: not applicable | Note ...: not applicable | Note ...: not applicable | 0.176Note * | 0.003 | Note ...: not applicable |
| Bachelor's degree or higher | Note ...: not applicable | Note ...: not applicable | Note ...: not applicable | Note ...: not applicable | Note ...: not applicable | Note ...: not applicable | Note ...: not applicable | Note ...: not applicable | Note ...: not applicable | 0.42Note * | 0.004 | Note ...: not applicable |
| R-squared value | ||||||||||||
| Adjusted R-squared | 0.001 | Note ...: not applicable | Note ...: not applicable | 0.026 | Note ...: not applicable | Note ...: not applicable | 0.027 | Note ...: not applicable | Note ...: not applicable | 0.158 | Note ...: not applicable | Note ...: not applicable |
... not applicable
|
||||||||||||
Conclusion
This study examined quality of employment (QoE) indicators from the Labour Force Survey (LFS) and LFS supplement for 2022 and the 2016 General Social Survey (GSS) among Indigenous and non-Indigenous people aged 18 to 64 years. In 2022, the pay gap between Indigenous men and women was slightly smaller than among non-Indigenous men and women, though the average hourly wage was lower overall. That said, the Indigenous population is younger on average, and larger shares were employed in sales and services occupations, jobs that tend to have lower paying wages. Indigenous men worked on average six hours more per week than Indigenous women, while non-Indigenous men worked five hours per week more than their female counterparts. Involuntary part-time work was also more prevalent among Indigenous people—in particular Indigenous men—compared with non-Indigenous men. Indigenous people were less likely to work from home, yet Indigenous people working at least some of the time at home reported significantly greater work schedule flexibility. First Nations people living off reserve had higher rates of short-tenure at their occupation than non-Indigenous people.
In addition to experiencing pay disparities, working longer hours and holding involuntary part-time positions, Indigenous people also faced poor work conditions relating to discrimination. In 2016, First Nations people living off reserve were more likely to have experienced unfair treatment and discrimination at work than non-Indigenous people. Also, Indigenous people were more likely to have experienced sexual harassment at work than non-Indigenous people.
Regarding social protection, when compared with non-Indigenous people, Métis had higher rates of collective bargaining coverage, while First Nations people did not differ significantly. Among collective bargaining coverage and trade union membership, women had higher rates than men, though only non-Indigenous men and women significantly differed.
A set of linear regression models were conducted to assess the association between identity and average hourly earnings after accounting for certain factors. After accounting for the sex, age group and highest level of education, the adjusted gap in average hourly earnings between Indigenous and non-Indigenous people was not statistically significant. These results somewhat align with a recent study which suggested that Métis graduates had similar annual incomes to non-Indigenous graduates, after taking into account demographic, education and industry characteristics (Brunet, Corak & Galarneau, 2024), with the exception of First Nations people whose results slightly differed. There were a few differences between studies that might explain these differences: the current study did not conduct distinctions-based regression analysis (by First Nations people, Métis, and Inuit), did not conduct separate linear regressions for men and women, had a different outcome variable (average hourly earnings), and did not restrict to university graduates.
Despite notable disparities in the QoE among First Nations people and Métis, some encouraging findings were observed. These include the smaller hourly earnings disparity between First Nations people men and women, and Indigenous and non-Indigenous people aged 18 to 24 years and 55 to 64 years; greater representation of Indigenous men than non-Indigenous men among managers in middle management occupations in trades, transportation, production and utilities; greater representation of Indigenous women than non-Indigenous women in middle management occupation in retail and wholesale trade and customer services; greater likelihood of having a flexible work schedule among Indigenous people working partly or all of the time at home than their non-Indigenous counterparts; etc. Understanding QoE among Indigenous people is essential to identifying disparities in working conditions, ensuring fair and equal employment opportunities and improving overall well-being.
The strengths of the LFS include the mandatory nature of the survey and the measures that are in place to reduce non-responses aimed at increasing representativeness of the estimates, as well as the timeliness of data collection and availability (Brochu, 2021). Some limitations of the LFS data include coverage attributable to geography (unable to look at Quality of Employment indicators in the territories, for Inuit and for those living on reserve). In addition, sample size limitations resulted in great variability of the estimates and necessitated collapsing response categories or population group categories. Most data are self-reported and may be subject to recall bias. Monthly estimates may be volatile, especially for small population groups, low levels of geography and detailed industries (Statistics Canada, 2019). The LFS and LFS supplement collection is ongoing. Some comparisons are either already available or will become available as collection continues in subsequent months. This study highlights many potential avenues for future studies including in-depth analysis of the trends seen here and examining trends over time. By tracking the stability of trends in QoE over time, we can gain insight into how the labour market and job conditions among Indigenous people continue to evolve.
Data sources, definitions and methodology
Data sources
The Labour Force Survey (LFS) is conducted monthly in the 10 provinces, excludes reserves and uses a different methodology for the territories. Due to the small population size and coverage limitations, it was not possible to provide estimates for Inuit. Additionally, the LFS and LFS supplement did not collect data to identify Registered or Treaty Indian status, and as a result, disaggregation at this level was not possible.
The purpose of the monthly LFS supplement (also known as Labour Market Indicators) is to produce indicators on quality of employment and identify emerging trends in the Canadian labour market. While most themes change every month, some are asked regularly (e.g., once a quarter for the module on working from home). The sample for the LFS supplement is made up of respondents from the provinces and excludes respondents in their first or last rotation of the LFS (Statistics Canada, 2023e).
The 2016 General Social Survey (GSS) (Cycle 30) on Canadians at Work and Home was also collected in the 10 provinces, was not conducted on reserve, and used a different methodology for the territories. The GSS was used to examine the dimensions on ethics of employment and employment-related relationships.
Definitions
Short tenure jobs refers to positions of employment held for less than 12 months.
Collective bargaining coverage refers to whether a worker is covered by a collective bargaining agreement or a union contract (includes both union members and non-members).
Involuntary part-time work is when individuals work part-time hours (less than 30 hours per week), but would prefer to to work full-time if given the opportunity.
Flexible schedule in this particular study is defined as workers who have the ability to decide when their work day begins and ends.
Long working hours refers to employees who reported working more than 49 hours per week.
Irregular hours, irregular shift or on-call refers to a work hours that are not regular or change from week to week. On-call refers to situations where the worker only works when called in by an employer.
Analysis methods
Descriptive analyses were conducted to examine the quality of employment among the employed Indigenous population overall (including First Nations people living off reserve, Métis, Inuit, and those reporting multiple Indigenous identities), as well as among First Nations people living off reserve and Métis, aged 18 to 64 years, living in the provinces. Distinctions-based estimates were provided when possible by First Nations people living off reserve and Métis. Significance testing (chi-square test) was utilized to determine statistical significance when comparing the Indigenous and non-Indigenous populations (or comparing First Nations people or Métis with the non-Indigenous population). When providing estimates from the LFS, estimates were provided as a 12-month average (January to December, 2022). Estimates from the LFS supplement were provided by month (January to December, 2022). Additionally, estimates from the 2016 General Social Survey on Canadians at Work and Home were provided on unfair treatment and discrimination at work and harassment at work (dimension 1 on ethics of employment). More detailed breakdowns by sex, age group, geography, etc., were provided based on sample size and/or relevance. Among the age groups, the 25 to 54 year age group was split into two equal bins (25 to 39 years and 40 to 54 years) to examine hourly earnings by age in greater granularity. Previous work on intergenerational income mobility has suggested that incomes increase when individuals are between 35 to 40 years of age.
There were some instances where disaggregation by Indigenous group was not possible. In those instances, estimates were provided for Indigenous people overall. Due to both the LFS and GSS survey designs, Indigenous people overall includes First Nations people living off reserve, Métis and Inuit living in the provinces (representing just under one third of the Inuit population overall (Statistics Canada, 2022i)), and those reporting multiple Indigenous identities.
Estimates with a coefficient of variation (CV) between 16.6% and 33.3% are indicated by the letter “E”, and should be interpreted with caution.
Since pay inequity is a key indicator of quality of employment, in addition to examining the pay gap, multivariate analysis using ordinary least squares was conducted to examine the pay gap between Indigenous and non-Indigenous workers after accounting for sex, age group and highest level of education, which have been shown to be associated with pay gaps in past research (Ross, 2019 & Paul, 2020). Linear regression models were built modeling log-transformed self-reported average hourly earnings of all employed Canadians aged 25 to 64 years living in the 10 provinces. The impact of sex, age group and highest level of education attained on this relationship was examined in a stepwise manner by examining the change in the beta-coefficient. The analysis was restricted to those who were 25 years or older to allow the use of highest level of education. The beta-coefficients multiplied by 100 showed the % difference in average hourly wage between Indigenous and non-Indigenous people. These analyses were conducted using SAS-callable SUDAAN’s Proc Regress using 1,000 bootstrap weights to calculate variance and p-value estimates.
References
Anderson, T. (2019). Employment of First Nations men and women living off reserve. Aboriginal Peoples Survey. Statistics Canada Catalogue No. 89-653-X2019004.
Bakker, A. (2019). An evidence-based model of work engagement. Current Directions in Psychological Science, 20(4), 265–269.
Burchell, B., Sehnbruch, K. Piasna, A., & Agloni, N. (2012). The quality of employment in the Academic Literature: Definitions, Methodologies, and Ongoing Debates. Centre for new development thinking.
Brochu, P. (2021). A researcher’s guide to the Labour Force Survey: its evolution and the choice of public use versus master files. Canadian Public Policy, 47(3), 335-357.
Brunet, S., Corak, L., & Galarneau, D. (2024). Early career quality of employment of Indigenous graduates with a bachelor’s degree, 2010 to 2018 cohorts. Education, learning and training: Research Paper Series. Statistics Canada Catalogue No. 81‑595‑M.
Caron, J., Asselin, H., & Beaudoin, J. (2019). Promoting perceived insider status of indigenous employees: A review within the psychological contract framework. Cross Cultural & Strategic Management, 26(4), 609-638.
Ciceri, C., & Scott, K. (2006). The Determinants of Employment Among Aboriginal Peoples. Aboriginal Policy Research, 3, 3-32.
Conen, W., & Stein, J. (2021). A panel study of the consequences of multiple jobholding: enrichment and depletion effects. Transfer: European Review of Labour and Research, 27(2), 219-236.
Deloitte. (2018). Deloitte millennial survey.
Finn, D., & Donovan, A. (2013). PwC’s NextGen: A global generational study. Evolving talent strategy to match the new workforce reality.
Fulford, M., & Patterson, M. (2019). Multiple jobholders in Canada. Labour Statistics at a Glance. Statistics Canada Catalogue No. 71-222-X-2019003.
Golden, L., & Jaeseung, K. (2017). Irregular Work Shifts, Work Schedule Flexibility and Associations with Work-Family Conflict and Work Stress in the U.S. In: Sarah De Groof et al. "Work-Life Balance in the Modern Workplace. Interdisciplinary Perspectives from Work-Family Research, Law and Policy." (2017).
Hahmann, T., Robertson, H., & Badets, N. (2019). Employment characteristics of Métis women and men aged 25 to 54 in Canada. Aboriginal Peoples Survey. Statistics Canada Catalogue No. 89-653-X2019002.
Koster F., De Grip, A., & Fouarge, D. (2011). Does perceived support in employee development affect personnel turnover? International Human Resource Management. 22(11), 2403–2418.
Martin, S. (2018). The association between job flexibility and job satisfaction. Insights on Canadian Society. Statistics Canada Catalogue No. 75-006-X.
Morissette, R. (2021). Chapter 2: Youth employment in Canada. Portrait of Youth in Canada: Data Report. Statistics Canada Catalogue No. 42-28-0001.
Moyser, M. (2019). Measuring and analyzing the gender pay gap: a conceptual and methodological overview. Status on Gender and Intersecting Identities. Statistics Canada Catalogue No. 45200002.
Paul, T. (2020). On unequal terms: The Indigenous wage gap in Canada. Western University. MA Research Paper.
Ross, M. (2019). The Indigenous—White Earnings Gap and Labour Market Discrimination in Canada. Dalhousie University. Masters of Development Economics Research Paper.
Schmidt, S.W. (2007). The relationship between satisfaction with workplace training and overall job satisfaction. Human Resource Development Quarterly. 18(4), 481–498.
Singley, S.G., & Hynes, K. (2005). Transitions to parenthood: work-family policies, gender, and the couple context. Gender & Society, 19(3), 376–397.
Statistics Canada. (2016). Satisfaction with work-life balance: Fact sheet. Spotlight on Canadians: Results from the General Social Survey. Statistics Canada Catalogue No. 89-652-X.
Statistics Canada. (2019). Audit of Labour Force Survey. Retrieved from Ottawa, Ontario.
Statistics Canada. (2022a). Quality of Employment in Canada: Introduction to the Statistical Framework on Quality of Employment.
Statistics Canada. (2022b). Discrimination at work, 2016. Quality of Employment in Canada. Statistics Canada Catalogue No. 14-28-0001.
Statistics Canada. (2022c). Job tenure, 1976 to 2021. Quality of Employment in Canada. Statistics Canada Catalogue No. 14-28-0001.
Statistics Canada. (2022d). Indigenous population continues to grow and is much younger than the non-Indigenous population, although the pace of growth has slowed.
Statistics Canada, (2022e). Involuntary part-time work, 1907 to 2022. Quality of Employment in Canada. Statistics Canada Catalogue No. 14-28-0001.
Statistics Canada, (2022f). Multiple jobholders, 1976 to 2021. Quality of Employment in Canada. Statistics Canada Catalogue No. 14-28-0001.
Statistics Canada. (2022g). Collective bargaining coverage rate, 1997 to 2021. Quality of Employment in Canada. Statistics Canada Catalogue No. 14-28-0001.
Statistics Canada. (2022h). Trade union density rate, 1997 to 2021. Quality of Employment in Canada. Statistics Canada Catalogue No. 14-28-0001.
Statistics Canada. (2022i). Indigenous peoples – 2021 Census promotional material.
Statistics Canada. (2023a). Quality of Employment in Canada. Statistics Canada Catalogue No. 14-28-0001.
Statistics Canada. (2023b). Employment by Indigenous group and occupation. Table: 14-10-0104-01. Percent calculated from 2022 reference period
Statistics Canada. (2023c). Archived - Employee wages by occupation, monthly, unadjusted for seasonality, inactive. Table: 14-10-0306-01. December average hourly estimates from 2022 LFS.
Statistics Canada. (2023d). Census in Brief: Changes in income across different levels of educational attainment during the first year of the COVID-19 pandemic. Census of Population, 2021. Statistics Canada Catalogue No. 98-200-X.
Statistics Canada. (2023e). Labour Market Indicators.
Statistics Canada. (2024). Defining and measuring the gig economy using survey data: Gig work, digital platforms, and dependent self-employment. Statistics Canada Catalogue No. 11-001-X.
Sutter, A., & Esses, V. (2021). Women, Visible Minorities, and Indigenous Peoples in Leadership Positions in London, Ontario, and in Ontario’s Agencies, Boards and Commissions. Pathways to Prosperity and Western University.
United Nations Economic Commission for Europe. (2015a). Quality of Employment Framework.
United Nations Economic Commission for Europe. (2015b). Handbook on Measuring Quality of Employment: A Statistical Framework. Prepared by the Expert Group on Measuring Quality of Employment.
- Date modified: