
Technical Reference Guides for the Education and Labour Market Longitudinal Platform (ELMLP)
Interprovincial and territorial mobility indicators of newly certified journeypersons, 2008 to 2017

Archived Content
Information identified as archived is provided for reference, research or recordkeeping purposes. It is not subject to the Government of Canada Web Standards and has not been altered or updated since it was archived. Please "contact us" to request a format other than those available.
Skip to text
Text begins
1. Introduction
Statistics Canada, in collaboration with the provinces and territories, Employment and Social Development Canada (ESDC) and other stakeholders, has developed the Education and Labour Market Longitudinal Platform (ELMLP)
The ELMLP allows longitudinal integration of administrative data related to education with other data sources to provide customized datasets for analytical purposes.
The ELMLP Program fills data gaps and enables a greater understanding of student and apprenticeship pathways, transitions to the labour market and outcomes over time.
Data from the ELMLP can help address a wide range of policy questions pertaining to student and apprenticeship persistence, completion, mobility and pathways as well as their labour market outcomes.
These data allow policy makers to understand the different types of trajectories that students can take through their postsecondary education or apprenticeship training as well as student characteristics that may be related to these trajectories.
The target audience for the ELMLP includes provincial ministries of education, apprenticeship authorities, postsecondary institutions, federal government departments, members of the academic community, researchers, students and parents interested in graduate outcomes and other stakeholder groups involved in education and the labour market.
2. The Education and Labour Market Longitudinal Platform (ELMLP)
2.1 The key features of the ELMLP
- Platform – The Platform is a set of core and supplementary datasets which can be used in combination to allow researchers to unlock information about past cohorts of college/university students and registered apprentices, to better understand their pathways and how their education and training affected their career prospects.
- Securely integrated datasets – These integrated datasets allow us to know more than what a single dataset or survey can provide. Integrated datasets means that all of the datasets in the ELMLP may be linked with each other using an anonymous linkage identifier located on each file. After identifying which ELMLP datasets are needed to answer a specific research or policy question, researchers can then use the anonymous linkage identifier located on each file to bring these datasets together. The integration of datasets is carried out within the Statistics Canada Social Data Linkage Environment (SDLE), which maintains the highest privacy and data security standards.
- Longitudinal data – The data available within the Platform are linked longitudinally, allowing researchers to better understand the behaviours and outcomes of students and apprentices over time.
- Accessible data – All datasets prepared for the Platform are made available to researchers through the Research Data Centres network across Canada.
2.2 Accessibility, confidentiality and privacy
The integrated datasets in the ELMLP are deemed sensitive statistical information and subject to the confidentiality requirements of the Statistics Act. Statistics Canada employees who build the integrated datasets for research purposes have access to the data only after it has been stripped of personal identifiers. Furthermore, only Statistics Canada employees and deemed employees who have an approved need to access the data for their analytical work are allowed access to the linked analytical files.
This data is treated with the same level of confidentiality as surveys administered by Statistics Canada.
Findings from the ELMLP are released through Statistics Canada’s website.
The ELMLP data are also available in Statistics Canada’s Research Data Centres (RDC) to researchers with approved projects. These researchers are provided access in a secure setting at the RDCs, which are staffed by Statistics Canada employees. The RDCs are operated under the provisions of the Statistics Act in accordance with all confidentiality rules, and are accessible to researchers once they have been sworn in under the Statistics Act as “deemed employees.” Vetting rules are also put in place to ensure that research produced in the RDC’s does not divulge information on an individual.
2.3 Core and supplementary datasets
The ELMLP consists of two types of datasets: core and supplementary.
Core datasets are updated in the ELMLP on an annual basis and include:
- The Postsecondary Student Information System (PSIS) - an administrative dataset of all Canadian public college and university enrolments and graduates by type of program and credential, and field of study for each reporting year. The ELMLP includes PSIS data from 2009 onwards for all provinces and territories, as well as from 2005 onwards for the four Atlantic provinces and from 2004 onwards for Alberta.
- The Registered Apprenticeship Information System (RAIS) - an administrative dataset of pan-Canadian (provincial and territorial) annual data on registered apprentices and trade qualifiers. The ELMLP consists of RAIS data from 2008 onward.
- Income tax - select information from income tax data from 1992 onwards is available for all PSIS and RAIS records that were linked to the T1 Family File.
Supplementary datasets are additional datasets that will be integrated into the platform in order to add new indicators for research purposes. Over time, the number of supplementary datasets that are brought into the ELMLP will grow and could include survey data already collected by Statistics Canada, administrative data already obtained by Statistics Canada, and administrative data not yet available at Statistics Canada.
3. Data sources
3.1 Data sources and record linkages
The Registered Apprenticeship Information System (RAIS) is the foremost source of information on apprentices in Canada. On an annual basis, cross-sectional statistics on registrations in apprenticeship programs and certifications in trades are produced from the RAIS. The cross-sectional annual RAIS files do not support longitudinal studies and do not contain tax information on apprentices.
To study interprovincial and territorialNote mobility among recently certified journeypersons, the annual RAIS files from 2008 onward were linked longitudinally, and subsequently integrated with the T1 Family File (T1FF) and T4 tax slips for corresponding tax years. The integrated files provided the required geographic information to track interprovincial movements. Information on the jurisdiction of certification of journeypersons was obtained from the RAIS; the jurisdiction of residence was identified through the T1FF; and the jurisdiction(s) of employment were derived from the T4 tax slips.
Probabilistic record linkages of the annual RAIS files were conducted in the Social Data Linkage Environment (SDLE). Successful linkages were dependent on the completeness of personal identifiers. Nearly 99% of the records in each of the RAIS files from 2008 to 2017 were successfully linked to Statistics Canada’s Derived Record Depository.
Unique identifiers were used to join the T1FF and T4 tax files to the RAIS files. Approximately 99% of the records in the T1FF and T4 files were successfully linked to the RAIS. Duplicate records were then removed by combinations of three variables: a unique identifier, the province of certification, and the trade program identifier. Therefore, each record represents a journeyperson who certified in a specific trade and province in the given calendar year, while allowing those who certify in multiple apprenticeship programs or provincesNote to be counted accordingly.
For more information on record linkage, visit the Social Data Linkage Environment. For more information on tax data, visit the T1 Family File.
3.2 Concepts of the Registered Apprenticeship Information System, T1 Family File and T4 tax forms
The reference period of the annual RAIS files is the calendar year.
Designated trades are trades for which apprenticeship training is available, and for which certificates are granted. These designations are governed by provincial and territorial jurisdictions in Canada. These jurisdictions determine which training programs are offered, the associated trade qualifications and other criteria, such as which designated trades require certification in order to work unsupervised in the trade.
Red Seal programs have common standards to assess the skills of tradespersons across Canada in specific trades, referred to as the Red Seal trades. Tradespersons who pass examinations to meet these standards receive a Red Seal endorsement on their provincial or territorial trade certificates. The Red Seal endorsement certifies tradespersons to work in their trade in any province or territory, whereas other forms of certification may only be recognized by certain provinces or territories.
New registrations occur when individuals enroll in an apprenticeship training program during the reference period.
Registered apprentices are individuals in a supervised work training program in a designated trade within their provincial or territorial jurisdiction. Apprentices must be registered with the appropriate governing body (usually a ministry of education or labour, or a trade-specific industry governing body) to complete the training.
Certification - To work unsupervised in a number of trades in Canada it is necessary to be a certified journeyperson. Requirements for obtaining such designations vary widely across jurisdictions and trades. In most instances, apprentices become journeypersons after completing such requirements as supervised on-the-job training, technical training as well as passing one or more examinations.
Journeypersons, for the purposes of these indicators, are defined to be apprentices who have successfully completed their entire apprenticeship programs and have received a certificate of qualification.
Province of residence is obtained from Section 1, Personal Identification, of the T1 tax form and is the province or territory of residence on December 31st of the tax year.
Province of employment is obtained from Box 10 of the T4 Statement of Remuneration Paid.
3.3 Confidentiality and rounding
All data are subject to the confidentiality procedures of rounding and suppression. Suppression is primarily a data quality control measure for the mobility indicators, which do not contain confidential information. To this effect, all indicators with rounded cohort sizes less than 15 were suppressedNote .
To support the release of the mobility indicators, counts are subject to controlled random rounding using a base of five and percentages are rounded to the nearest decimal. Rounding may increase, decrease or cause no change to counts. Rounding can affect the results obtained from calculations. For example, when percentages are calculated from rounded data, results may be distorted as both the numerator and denominator have been rounded. These distortions are greatest with small numbers. Similarly, rounding may affect the correspondence in summed versus reported values between geographic levels, selected trades and categories, as well as related indicators.
Rounding and suppression because of small cohort sizes and unavailability for a given reference period are well documented in the resulting statistical tables (37-10-0154-01 and 37-10-0155-01).
4. Methodology of the mobility indicators for newly certified journeypersons
The primary purpose of the mobility tables is to produce indicators on the direction (37-10-0154-01) and prevalence (37-10-0155-01) of interprovincial movements among newly certified journeypersons in Canada. The purpose of this section is to define these indicators and inform data users of their limitations. See Appendix D for more information on how the indicators were derived from the merged RAIS-tax files.
4.1 Indicator definitions
The indicators are established for the selected trades, categories and geographic levels (see Section 5). The formulas for calculating percentages are included in the indicator definitions and also displayed in Table 1. Cohort size through tax filers are available in both mobility tables.
Cohort size is the number of journeypersons who certified in their apprenticeship programs during the given calendar year.
Median age at certification is the median age of journeypersons who became certified in the given calendar year. The median is determined by sorting values and selecting the middle value. When there is an even number of observations, the median is the average of the two middle values.
Year(s) after certification represent the timeframes over which the mobility indicators are reported, specifically one year and three years after certification.
Tax filers are journeypersons who filed taxes, specifically T1 records, one or three years after certification. The percentage of tax filers is calculated using cohort size as the denominator.
The following indicators are only available in Table 37-10-0154-01:
Province or grouped territories, origin is the jurisdiction where journeypersons certified in the given calendar year.
Province or grouped territories, destination: represents the jurisdiction where journeypersons reside, one or three years after certification.
The following indicators are only available in Table 37-10-0155-01:
Please note the use of ‘migrants’ in these indicators is generic and refers to individuals that reside or work in a different province or territory from where they certified. This should not be confused or compared with interprovincial migration tables or indicators of the Canadian population (see section 4.2).
Mobility after certification is measured by comparing the jurisdiction of certification in a trade, obtained from the RAIS, to the province or territory of residence, recorded in the T1FF, one or three years after certification. Based on their correspondence of these jurisdictions, journeypersons are classified as non-migrants or migrants (i.e. in-migrants and out-migrants).
Non-migrants are journeypersons who reside in the same province or territory in which they certified. The percentage of non-migrants is calculated using Tax filers as the denominator.
In-migrants and out-migrants are journeypersons who reside in a different jurisdiction from where they certified. At the provincial-territorial level, these indicators give the magnitude of journeypersons entering or leaving a jurisdiction. Given the focus on the interprovincial mobility of journeypersons within Canada, in-migrants and out-migrants are equivalent at the national level. As percentages, in-migrants are relative to the sum of in-migrants and non-migrants in the jurisdiction of residence, while out-migrants are relative to the number of tax filers in the jurisdiction of certification.
Net-migrants is the difference between in-migrants and out-migrants. At the provincial-territorial level, this measure indicates whether there is a gain (inflow) or loss (outflow) in the number of journeypersons. A positive value indicates more journeypersons are entering a province or territory than those that have left. Given in and out-migrants are equivalent at the national level, net-migrants is correspondingly equal to zero.
Non-migrant journeypersons are further sub-classified as shadow or non-shadow based on the location(s) where they work, as obtained from T4 tax slips, compared to the province or territory where they certified and reside. Therefore, the jurisdiction(s) of employment are considered only when the province or territory of residence and certification match. Based on the correspondence of these jurisdictions, non-migrant journeypersons contribute to the following estimates.
Non-migrants and non-shadow are journeypersons who work exclusively in the same jurisdiction in which they certified and reside, with no reported earnings elsewhere.
Comparatively, the shadow population are journeypersons who have any work in a jurisdiction outside of where they certified and reside. The jurisdiction of employment is assigned based on the T4 slip with the largest income outside of the province or territory of certificationNote .
In and out-migrants (shadow) are journeypersons who work in a jurisdiction outside of where they certified and reside. In-migrant (shadow) counts are assigned to the employment jurisdiction, while out-migrant (shadow) counts are applied to the province or territory of certification. For example, a journeyperson who certified and lives in Nova Scotia, but works in Alberta is counted as an out-migrant (shadow) of Nova Scotia and an in-migrant (shadow) of Alberta. This ensures that in and out-migrants (shadow) match at a national level. At the provincial-territorial level, these measures broadlyindicate the prevalence of work-related mobility, specifically the number of journeypersons entering or leaving a jurisdiction for employment. Percentages of in-migrants (shadow) are calculated relative to the province or territory of employment using the sum of in-migrants (shadow) and non-migrants and non-shadow as the denominator, while out-migrants (shadow) are relative to the jurisdiction of certification using tax filers as the denominator.
Net-migrants (shadow) is the difference between in-migrants (shadow) and out-migrants (shadow). At the provincial-territorial level, this measure indicates the balance in the number of journeypersons enteringa jurisdiction for work versus the number of journeypersons leaving for employment elsewhere. As such, the measure broadly informs whether there is a gain (inflow) or loss (outflow) in employed journeypersons for a given jurisdiction. Given in and out-migrants (shadow) are equivalent at the national level, net-migrants (shadow) is correspondingly equal to zero.
See Appendix B for a workflow chart detailing the process for classifying journeypersons and the corresponding indicator(s) to which they contribute.
| Variable (%) | Denominator | Formula |
|---|---|---|
| Tax filers | COHORT SIZE | (TAX FILERS / COHORT SIZE)*100 |
| Non-migrants | TAX FILERS | (NON / TAX FILERS)*100 |
| In-migrants | (IN + NON) | (IN / (IN + NON))*100 |
| Out-migrants | TAX FILERS | (OUT / TAX FILERS)*100 |
| Net-migrants | N/A | IN (%) – OUT (%) |
|
Note: Similar formulas were used to calculate percentages of the shadow population indicators. Source: Statistics Canada. |
||
4.2 Limitations
4.2.1 Comparability to other measures of movement
There are many ways to measure the interprovincial movements of individuals. Statistics Canada defines interprovincial migration as representing a change in the usual place of residence between provinces or territoriesNote . However, this definition differs from the mobility indicators presented in this document, which defines journeyperson movements using the jurisdiction of certification as the origin and the province or territory of residence, one or three years later, as the destination. Therefore, any movements captured in these indicators, away from the jurisdiction where individuals certified, can be seen as a loss of investment for these provinces or territories. It should be noted that some apprentices may live near provincial borders thereby allowing them to study or work in one jurisdiction while maintaining their residence in another. This also relates to the geography of provinces and grouped territories, which is detailed further in in Section 4.2.3.
4.2.2 Identifying mobility from tax records
Data on the jurisdictions of residence and employment are obtained from the T1FF and T4 tax slips respectively. Journeypersons who do not file taxes (e.g. emigrants, deceased or individuals not in the labour force) one or three years after certification are excluded from these estimates. The number and percentage of tax filers are provided in Tables 37-10-0154-01 and 37-10-0155-01 as important data quality indicatorsNote . For more information on tax data, visit the T1 Family File.
Regarding employment and shadow population estimates, the T4 data may not reflect work in the trade in which a journeyperson certified, full-time or full-year employment, nor does it account for the number of hours worked. Although the method used to determine a journeyperson’s employment jurisdiction may not reflect their primary work (location, occupation or earnings), it was chosen to register any employment outside of where they certified and reside.
4.2.3 Geographic borders and distribution of journeypersons
The mobility measures are sensitive to the geographyNote of the data (provinces and grouped territories) and the distribution of journeypersons within these boundaries. Specifically, these measurements are sensitive to provinces or territories with population centres located near their borders. For example, an individual who certified in Ottawa and moved across Ontario to Thunder Bay is a non-migrant, while a similar individual who certified in Ottawa, but lives in Gatineau, Quebec is considered a migrant (see Appendix A). In this case the distance moved by the ‘migrant’ is substantially smaller than that of the ‘non-migrant’. Variations in jurisdictional size and the proximity of journeypersons to borders also affect the shadow population estimates, influencing the potential for employment outside the province or territory of certification.
5. Geography and trades
The mobility indicators for recently certified journeypersons are produced for the selected trades (37-10-0155-01) and categories (37-10-0154-01 and 37-10-0155-01). The selected trades comprise the 10 Red Seal trades with the largest number of certifications granted in Canada between 2008 and 2017, while the categories correspond to totals of the selected top 10 Red Seal trades, other Red Seal trades, non-Red Seal trades and all trades. Estimates are available for Canada (37-10-0155-01), all provinces and grouped territories (37-10-0154-01 and 37-10-0155-01). The territories were combined to obtain sufficient cohort sizes. See Appendix C for further information on the selected trades and categories.
In Canada, apprenticeship programs and certifications in trades are administered by provincial and territorial jurisdictions. As a result, definitions that govern apprenticeship programs and the way data are reported to Statistics Canada can vary considerably across jurisdictions and across trades themselves. Thus, focusing on the most common Red Seal trades in Canada helps to reduce some of these administrative differences.
Estimates at the Canada and jurisdictional levels are available for the 10 Red Seal trades with the largest number of certifications granted nationally between 2008 and 2017. All jurisdictions where these are designated trades contribute to the Canada level estimates. Some jurisdictional estimates may be unavailable due to small cohort sizes that fall below the predetermined threshold of 15. This threshold was implemented to ensure the indicators are of acceptable quality. For more information, see Appendix E of this document.
6. Appendices
Appendix A

Figure 1 - Illustrates the classification of journeypersons and the mobility indicators to which they contribute, according to the correspondence between the province(s) or grouped territories of certification, residence and employment. The figure also depicts how the distribution of journeypersons within these borders may influence these classifications and estimates.
Appendix B

Figure 2 - Depicts the workflow for classifying newly certified journeypersons in Table 37-10-0155-01 as migrants or non-migrants, and non-migrants as either shadow or non-shadow, based on the jurisdictions of certification, residence and employment. The indicator(s) to which individuals contribute are depicted in the black rectangular boxes. For in and out measures, this is followed by the jurisdiction to which counts are applied, listed in red.
Appendix C

Figure 3 - Lists the selected trades and categories for which the mobility indicators are reported. The correspondence between the sum of the selected trades and the Top 10 Red Seal trades, as well as the relations between other trade categories are also shown. The Top 10 Red Seal, Other Red Seal and Non-Red Seal trades are mutually exclusive. For example, summing the Top 10 Red Seal and Other Red Seal trades provides a total for all Red Seal trades. Similarly, summing these categories with Non-Red Seal trades provides the estimates for All trades. The 2016 National Occupation Classification (NOC) identifiers used in the creation of these indicators are shown in square brackets for the selected trades.
Appendix D
The mobility indicators were derived by aggregating the integrated longitudinal RAIS-tax files. First, the number of journeypersons who certified in the given calendar year and their median age were calculated. Then, the province or territory of certification (origin) was compared to the jurisdiction of residence (destination). Where they matched, this was further compared against the jurisdiction(s) of employment to determine if journeypersons had any work elsewhere (shadow). This established the interprovincial movements of newly certified journeypersons. The formulas depicted below were then applied to the rounded origin-destination counts, which comprise the principal indicators of Table 37-10-0154-01, to calculate the net mobility indicators reported in Table 37-10-0155-01.
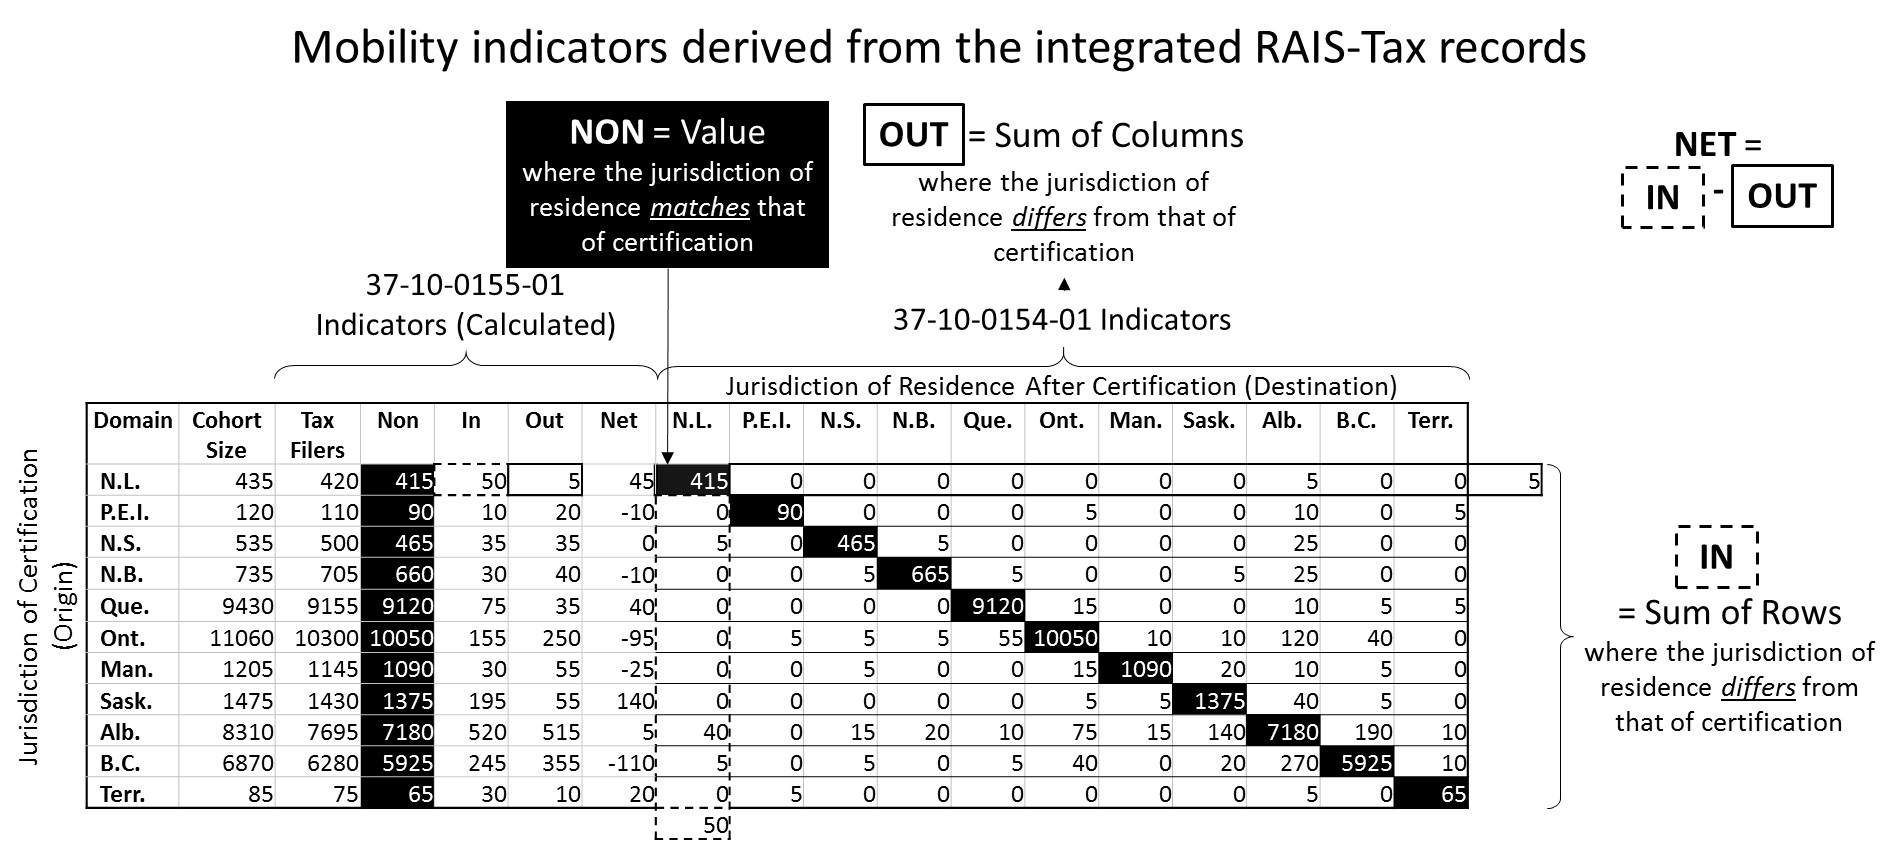
Figure 4 – An example of the output datasets, after controlled random rounding and indicator calculations, containing the mobility indicators reported in Tables 37-10-0154-01 and 37-10-0155-01. These were compiled both for migrant (shown) and shadow populations of interest. The latter was established by comparing the jurisdiction of employment, as detailed in Section 4.1, to the province or territory of certification and residence for non-migrant journeypersons.
Appendix E
| Top 10 Red Seal trades | Number of jurisdictions | Jurisdictions that contribute to the indicators available at the Canada level | ||||||||||
|---|---|---|---|---|---|---|---|---|---|---|---|---|
| N.L. | P.E.I. | N.S. | N.B. | Que. | Ont. | Man. | Sask. | Alta. | B.C. | Territories | ||
| Automotive service technicianTable 2 Note 1 Table 2 Note 2 | 10 | Included | Included | Included | Included | Note .: not available for any reference period | Included | Included | Included | Included | Note E: Use with caution | Included |
| Carpenter | 11 | Included | Included | Included | Included | Included | Included | Included | Included | Included | Included | Included |
| Construction electrician | 11 | Included | Included | Included | Included | Included | Included | Included | Included | Included | Included | Included |
| CookTable 2 Note 2 | 11 | Included | Included | Included | Included | Included | Included | Included | Included | Included | Note E: Use with caution | Included |
| HairstylistTable 2 Note 2 Table 2 Note 3 | 9 | Included | Included | Note .: not available for any reference period | Note .: not available for any reference period | Included | Included | Included | Included | Included | Note E: Use with caution | Included |
| Heavy-duty equipment technicianTable 2 Note 1 | 11 | Included | Included | Included | Included | Note E: Use with caution | Included | Included | Included | Included | Included | Included |
| Industrial mechanic (millwright)Table 2 Note 2 | 11 | Included | Included | Included | Included | Note E: Use with caution | Included | Included | Included | Included | Included | Included |
| PlumberTable 2 Note 1 | 11 | Included | Included | Included | Included | Note E: Use with caution | Included | Included | Included | Included | Included | Included |
| Steamfitter - pipefitterTable 2 Note 1 | 10 | Included | Included | Included | Included | Note .: not available for any reference period | Included | Included | Included | Included | Included | Included |
| WelderTable 2 Note 2 | 11 | Included | Included | Included | Included | Included | Included | Included | Included | Included | Note E: Use with caution | Included |
|
. not available for any reference period E use with caution
|
||||||||||||
Notes
- Date modified: