
Economic and Social Reports
The Provincial Nominee Program: Provincial differences
DOI: https://doi.org/10.25318/36280001202400300003-eng
Text begins
Abstract
In recent years, more economic immigrants entered Canada via the Provincial Nominee Program (PNP) than through any other immigration program. Each province or territory is responsible for the design and management of its PNP. The importance of the PNP as a source of immigrants varied considerably among the provinces: it was almost the sole source of economic immigrants in Manitoba and Saskatchewan, while it was much less significant in Ontario. The other provinces fell in between these provinces. Provincial differences in the sociodemographic characteristics of provincial nominees reflect the differences in eligibility requirements and selection processes. As the PNP evolved, the characteristics of provincial nominees changed substantially. The share of new provincial nominees with pre-landing Canadian work experience increased significantly in most provinces. However, by 2019, there were significant differences between provinces, with most new provincial nominees in Alberta, British Columbia, and Newfoundland and Labrador having previously been temporary foreign workers, compared with relatively few of those in Nova Scotia, New Brunswick or Saskatchewan. There was also a rise in the share of new provincial nominees who were former international students in some provinces, notably Ontario, Alberta and British Columbia. Provincial nominees with pre-landing Canadian work or study experience tend to have better economic outcomes than other immigrants without such a background. Significant provincial variation in the types of intended occupations of new provincial nominees was also evident. In 2019, skilled and technical provincial nominees dominated in Nova Scotia, Saskatchewan and Alberta, while British Columbia, New Brunswick and Prince Edward Island had larger shares of professionals, though less than a majority. In Manitoba, lower-skilled provincial nominees outnumbered either professionals or skilled and technical nominees.
Keywords: Provincial Nominee Program, immigrants, provincial distribution
Authors
Eden Crossman and Garnett Picot are with the Research and Data Branch at Immigration, Refugees and Citizenship Canada. Feng Hou is with the Social Analysis and Modelling Division, Analytical Studies and Modelling Branch, at Statistics Canada.
Acknowledgments
This study was conducted in collaboration with Immigration, Refugees and Citizenship Canada. The authors would like to thank Stephane Arabackyj, Christopher Hamilton and Tim Prendergast for their advice and comments on an earlier version of this paper.
Introduction
In recent years, more economic immigrants entered Canada via the Provincial Nominee Program (PNP) than through any other program. In 2019, 35% of economic immigrants entered via the PNP, although the share fell to 24% in 2021—likely because of changes in selection associated with the COVID-19 pandemicNote —before moving back to 35% in 2022. The program was created with two principal objectives: (1) to distribute more immigrants to regions and provinces outside of the three major Canadian cities and (2) to help meet the workforce needs of employers in those regions and provinces (IRCC, 2017).
From 1996 to 2005, all provinces (excluding Quebec, which had its own economic immigration system) and Yukon signed PNP agreements with the federal government. The Northwest Territories signed an agreement in 2009.Note Initially, the PNP was quite modest, with roughly 500 immigrants entering via various PNPs in 1999. By 2004, this inflow had grown to around 6,000 immigrants and continued from there, reaching 68,000 in 2019 and 88,300 in 2022 (Picot, Hou & Crossman, 2023).
Each province or territory (herein referred to as provinces) is responsible for the design and management of its PNP, including the different entry streams within the program. Each province has several streams that potential economic immigrants can apply to. There are over 60 individual PNP streams across all provinces (see Appendix).
There are both differences and similarities among the provinces in PNP design. All provinces have some form of entrepreneurial stream targeting individuals who are committed to starting or purchasing a company. All provinces also have some form of skilled worker program focusing on higher-skilled economic immigrants (National Occupational Classification [NOC] skill level 0, A or B), and most provinces have a stream that will accept lower-skilled workers (NOC skill level C or D). Some streams choose immigrants in “in-demand” occupations only, while others accept immigrants in a broader range of occupations. Some provincial streams require a job offer at time of entry, or that the applicant have some previous Canadian job experience (i.e., was a temporary foreign worker). Other skilled or lower-skilled worker streams have no such requirement. All provinces have streams oriented toward international students graduating from a university in the province or in other provinces. All provinces also have some streams where the applicant applies directly to the province, and at least one stream where the applicant applies through the federal Express Entry immigration management system and is evaluated based on the requirements of the programs under this system (the Federal Skilled Worker Program [FSWP], Federal Skilled Trades Program and Canadian Experience Class [CEC]). The detailed provincial streams in place in 2022 are described in the appendix.
This article is part of a series examining various aspects of the PNP. The series discusses (1) the expansion of the PNP, (2) differences among provinces (this article), (3) provincial retention rates, (4) trends in earnings and (5) the occupations of provincial nominees, both nationally and provincially.
This article examines differences among provinces in (1) the growth and importance of the PNP and (2) the characteristics of provincial nominees. The analysis is based on data from the Longitudinal Immigration Database (Statistics Canada, 2020).
Provincial Nominee Program policy environment
Immigration is a shared responsibility between the federal and provincial governments. The federal government plays a role in both admissibility screening and the final selection of provincial nominees (IRCC, 2017). Provincial governments determine the specific economic needs of their jurisdictions and the capacity of the applicants to establish themselves economically (IRCC, 2017). The role of the provinces, then, is to assess immigrants’ applications submitted through the PNP and issue a nomination certificate to successful candidates. While a nomination certificate is not permanent residence, it is customary for Immigration, Refugees and Citizenship Canada (IRCC) to accept the recommendation of the nominating province (IRCC, 2017).Note
There are currently 11 PNPs operating across Canada. To establish a PNP, a province signs an agreement with IRCC (Table 1) (CIC, 2011). Manitoba was the first to sign an agreement, in 1996. Manitoba, New Brunswick, and Newfoundland and Labrador were the first provinces to start operating PNPs, in 1999. The Northwest Territories signed an agreement most recently, in 2009.
| Province or territory | Date of first signed PNP agreement | Year PNP started | Year of current PNP agreement |
|---|---|---|---|
| Newfoundland and LabradorTable 1 Note 1 | September 1, 1999 | 1999 | 2016 |
| New BrunswickTable 1 Note 1 | February 22, 1999 | 1999 | 2017 |
| Manitoba | October 22, 1996 | 1999 | 2003 |
| Prince Edward IslandTable 1 Note 1 | March 29, 2001 | 2001 | 2008 |
| Saskatchewan | March 16, 1998 | 2001 | 2005 |
| British Columbia | April 19, 1998 | 2001 | 2015 |
| Alberta | March 2002 | 2002 | 2007 |
| Yukon | April 2001 | 2002 | 2008 |
| Nova ScotiaTable 1 Note 1 | August 27, 2002 | 2003 | 2007 |
| Ontario | November 21, 2005 | 2007 | 2017 |
| Northwest Territories | August 2009 | 2009 | 2013 |
Sources: Immigration, Refugees and Citizenship Canada, Evaluation of the Provincial Nominee Program, 2017; and Organisation for Economic Co-operation and Development, Recruiting Immigrant Workers: Canada 2019, 2019. |
|||
Provinces can design their programs and selection criteria, as long as they are consistent with the Immigration and Refugee Protection Act, the Immigration and Refugee Protection Regulations, and bilateral agreements (OECD, 2019). By consequence, the selection criteria of the PNP streams differ widely across provinces. However, there are minimum language requirements and the need for a labour market focus.Note
In 2009, following years of little federal involvement, the federal government imposed annual limits for PNP principal applicants for each province.Note Since 2015, provinces can recruit PNP candidates from the Express Entry pool (referred to as “enhanced” nominations), as well as through the PNP system (referred to as “base” nominations) (IRCC, 2017). These nominees must fulfil the educational, language and work experience requirements of at least one federal high-skilled selection program. The enhanced nominations receive 600 points, basically ensuring their acceptance via the Express Entry system. The introduction of the Express Entry system resulted in an increase in the total number of permanent residents nominated by provinces,Note faster processing of applications and a stronger calibre of applicants (IRCC, 2017).
Growth in the Provincial Nominee Program at the provincial level
Although the PNP grew continuously from 2000 to 2019 at the national level, this smooth growth masks significant variation in provincial growth patterns (in 2020 and 2021, the PNP was significantly reduced because of the COVID-19 pandemic).
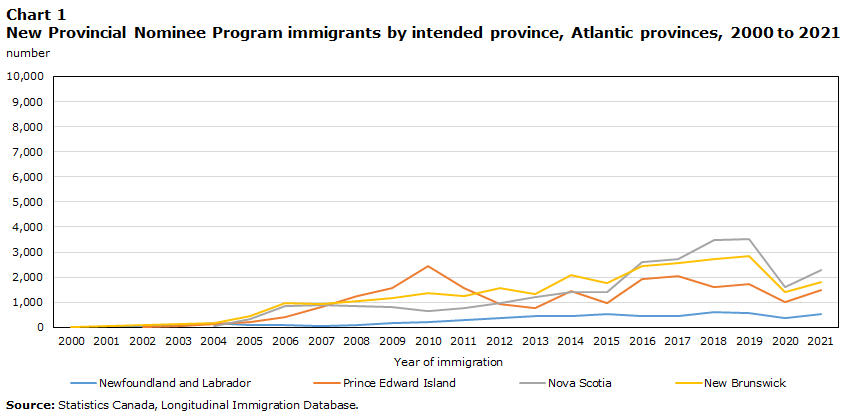
In the Atlantic provinces,Note Newfoundland and Labrador selected very few economic immigrants through its PNP (Chart 1). Prince Edward Island ramped up the program relatively quickly from 2005 to 2010; fewer provincial nominees have intended to settle in the province each year from 2010 to 2019. The program in Nova Scotia grew rapidly from 2013 to 2019 and became the largest PNP in the Atlantic provinces, admitting 3,500 provincial nominees in 2019. In New Brunswick, the program experienced continuous growth from 2005 to 2019. By 2019, the Atlantic provinces received 12.6% of all provincial nominees coming to Canada.
Data table for Chart 1
| Year of immigration | Newfoundland and Labrador | Prince Edward Island | Nova Scotia | New Brunswick |
|---|---|---|---|---|
| number | ||||
| 2000 | Note ..: not available for a specific reference period | Note ..: not available for a specific reference period | Note ..: not available for a specific reference period | 22 |
| 2001 | 35 | Note ..: not available for a specific reference period | 11 | 68 |
| 2002 | 36 | 10 | Note ..: not available for a specific reference period | 104 |
| 2003 | 37 | 44 | Note ..: not available for a specific reference period | 146 |
| 2004 | 170 | 141 | 63 | 161 |
| 2005 | 85 | 203 | 326 | 438 |
| 2006 | 76 | 423 | 858 | 966 |
| 2007 | 67 | 815 | 900 | 918 |
| 2008 | 106 | 1,253 | 865 | 1,038 |
| 2009 | 180 | 1,563 | 795 | 1,163 |
| 2010 | 217 | 2,426 | 629 | 1,349 |
| 2011 | 274 | 1,571 | 775 | 1,232 |
| 2012 | 368 | 913 | 957 | 1,575 |
| 2013 | 440 | 773 | 1,204 | 1,338 |
| 2014 | 456 | 1,436 | 1,395 | 2,100 |
| 2015 | 532 | 948 | 1,394 | 1,760 |
| 2016 | 456 | 1,922 | 2,588 | 2,438 |
| 2017 | 433 | 2,043 | 2,730 | 2,566 |
| 2018 | 606 | 1,617 | 3,462 | 2,737 |
| 2019 | 569 | 1,720 | 3,505 | 2,845 |
| 2020 | 362 | 999 | 1,587 | 1,391 |
| 2021 | 509 | 1,480 | 2,271 | 1,809 |
|
.. not available for a specific reference period Source: Statistics Canada, Longitudinal Immigration Database. |
||||
Data table for Chart 2
| Year of immigration | Ontario | Manitoba | Saskatchewan | Alberta | British Columbia |
|---|---|---|---|---|---|
| number | |||||
| 2000 | 65 | 1,094 | 37 | 19 | 13 |
| 2001 | 96 | 974 | 41 | 19 | 24 |
| 2002 | 140 | 1,526 | 73 | 25 | 209 |
| 2003 | 266 | 3,113 | 173 | 173 | 441 |
| 2004 | 280 | 4,040 | 321 | 423 | 598 |
| 2005 | 483 | 4,617 | 465 | 604 | 789 |
| 2006 | 466 | 6,660 | 960 | 956 | 1,921 |
| 2007 | 675 | 7,685 | 1,833 | 1,645 | 2,525 |
| 2008 | 1,097 | 7,965 | 3,035 | 3,317 | 3,622 |
| 2009 | 1,267 | 10,147 | 5,029 | 5,316 | 4,696 |
| 2010 | 1,528 | 12,171 | 5,355 | 7,487 | 4,901 |
| 2011 | 1,685 | 12,340 | 6,957 | 8,994 | 4,305 |
| 2012 | 1,954 | 9,532 | 9,020 | 10,288 | 5,929 |
| 2013 | 2,504 | 8,858 | 8,203 | 9,156 | 7,153 |
| 2014 | 2,707 | 12,186 | 8,780 | 11,151 | 7,032 |
| 2015 | 3,536 | 10,258 | 8,657 | 10,402 | 6,768 |
| 2016 | 3,899 | 9,944 | 9,895 | 8,057 | 6,741 |
| 2017 | 6,963 | 9,425 | 10,522 | 7,184 | 7,545 |
| 2018 | 11,331 | 9,876 | 11,099 | 10,263 | 10,990 |
| 2019 | 12,282 | 12,532 | 10,952 | 11,204 | 12,532 |
| 2020 | 6,732 | 5,822 | 5,354 | 7,807 | 8,453 |
| 2021 | 10,977 | 10,304 | 6,490 | 8,568 | 10,975 |
| Source: Statistics Canada, Longitudinal Immigration Database. | |||||
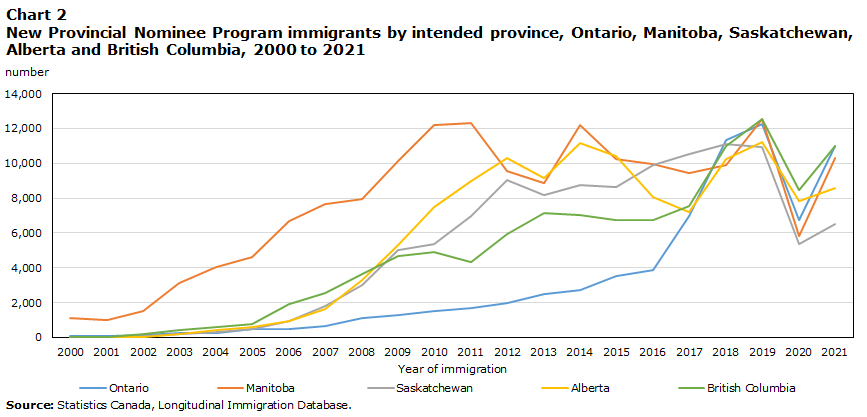
The five larger provinces (Ontario, Manitoba, Saskatchewan, Alberta and British Columbia) each admitted about the same number of provincial nominees in 2019—ranging from 11,000 to 12,500—despite differences in population size. Each province received 16% to 18% of all provincial nominees entering Canada that year. However, the paths to this similar position varied considerably by province.
Manitoba was one of the main promoters of the PNP in the early days: from 2000 to 2011, Manitoba had the largest intake of provincial nominees of any province in every year, rising from around 1,000 to 12,000 (Chart 2). Manitoba received more than half (57%) of all new provincial nominees in 2005. As other provinces ramped up their programs, Manitoba’s share fell to around 18% in 2019. By contrast, Ontario was relatively late to establish a PNP, likely because a large share of economic immigrants chose to settle in Ontario, mostly in Toronto. Hence, the need for a PNP was somewhat lower in this province. Most of the growth in the PNP in Ontario occurred from 2016 to 2019, reaching over 12,000 in 2019. British Columbia, Alberta and Saskatchewan have all had relatively large PNPs since 2005, with program growth in these provinces up to 2019. All provinces experienced a significant decline in the number of new provincial nominees in 2020 and partly recovered in 2021.Note
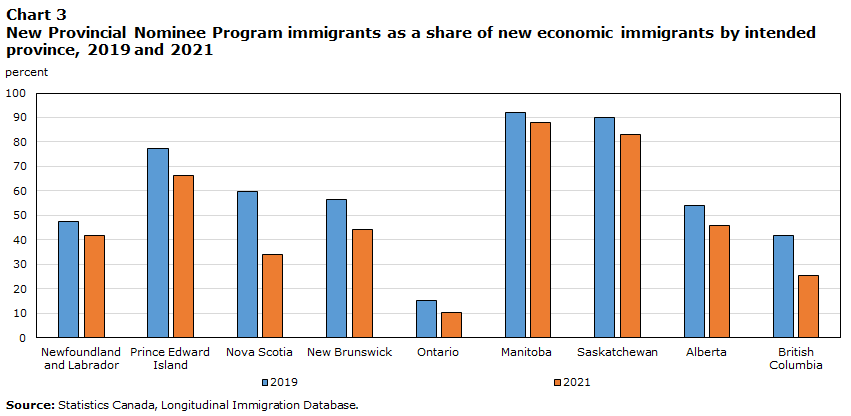
The importance of the PNP as a source of immigrants varied considerably by province. The PNP was almost the sole source of economic immigrants in some provinces, and much less significant in others. Fully 90% of economic immigrants entering Manitoba and Saskatchewan did so via the PNP in 2019. By comparison, Ontario counted on the program for 15% of economic immigrants that year (Chart 3). All other provinces—except British Columbia and Newfoundland and Labrador—received over half of their economic immigrants through the PNP in 2019.
Since the eligibility requirements and selection process vary among economic immigration programs, the provincial program mix (e.g., shares of immigrants landing in a given year via the PNP, FSWP, CEC and “other” economic categoriesNote ) affects the characteristics of the economic immigrants entering the provinces.Note Principal applicant immigrants selected through the PNP tend to have less education, be more likely to intend to work in skilled and technical occupations than in professional occupations, and be more likely to have pre-landing work and study experience than their counterparts in the FSWP (Picot, Hou & Crossman, 2023).
Data table for Chart 3
| Year of immigration | Newfoundland and Labrador | Prince Edward Island | Nova Scotia | New Brunswick | Ontario | Manitoba | Saskatchewan | Alberta | British Columbia |
|---|---|---|---|---|---|---|---|---|---|
| percent | |||||||||
| 2019 | 47.7 | 77.4 | 59.8 | 56.3 | 15.0 | 91.9 | 90.2 | 54.1 | 41.8 |
| 2021 | 41.8 | 66.2 | 34.1 | 44.4 | 10.4 | 87.9 | 83.1 | 46.0 | 25.5 |
| Source: Statistics Canada, Longitudinal Immigration Database. | |||||||||
Provincial differences in pre-landing Canadian work and study experience
Provincial differences in the characteristics of provincial nominees are, in part, a reflection of differences in the eligibility requirements and selection processes associated with respective PNP streams. As the PNP evolved, the characteristics of the provincial nominees changed substantially. Perhaps the most consequential change was the increased tendency to have Canadian work or study experience prior to landing (herein referred to as temporary foreign workersNote and international studentsNote ). Earlier research showed that immigrants who were previously temporary foreign workers had better labour market outcomes than immigrants without pre-landing Canadian work experience (Crossman & Hou, 2022; Hou & Picot, 2016).Note At the national level, the proportion of provincial nominees aged 20 to 54 at landing who were previously temporary foreign workers rose continuously, from 6% in 2000 to 61% in 2019 (67% in 2020 and 72% in 2021). The corresponding share for those who were previously international students also rose, from 4% in 2000 to 38% in 2019 (40% in 2020 and 44% in 2021) (Picot, Hou & Crossman, 2023).
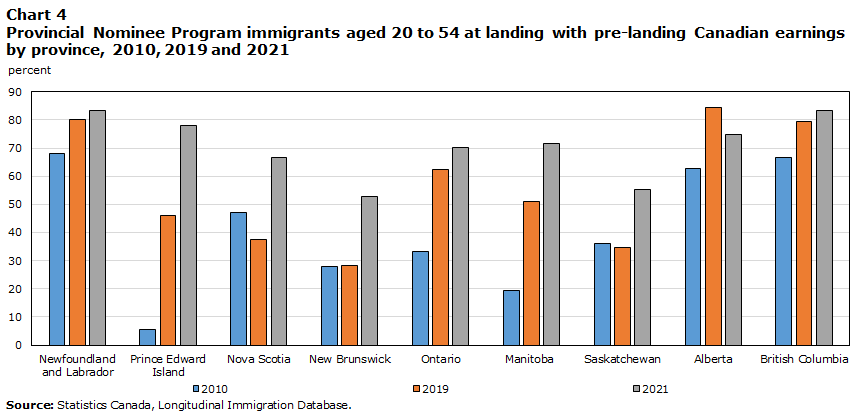
By 2019, there was significant variation among provinces in the share of prime-age (20 to 54 at landing) provincial nominees who had pre-landing Canadian earnings (Chart 4).Note In some provinces, most new provincial nominees were from the pool of previous temporary foreign workers, including Newfoundland and Labrador (80% were previously temporary foreign workers), Alberta (84%), and British Columbia (79%). PNPs in some other provinces had a more balanced mix of former temporary foreign workers and those directly from outside Canada, including Prince Edward Island (46% were temporary foreign workers), Manitoba (51%) and Ontario (62%). Finally, in some provinces, nominees were primarily from the pool of applicants outside Canada, with relatively few temporary foreign workers, including New Brunswick (28% were temporary foreign workers), Saskatchewan (34%) and Nova Scotia (37%).Note Nonetheless, there was an increase from 2010 to 2019 in the share of new provincial nominees with pre-landing Canadian work experience in all provinces, except Saskatchewan, Nova Scotia and New Brunswick (Chart 4).
Data table for Chart 4
| Newfoundland and Labrador | Prince Edward Island | Nova Scotia | New Brunswick | Ontario | Manitoba | Saskatchewan | Alberta | British Columbia | |
|---|---|---|---|---|---|---|---|---|---|
| percent | |||||||||
| 2010 | 68.0 | 5.4 | 47.2 | 27.8 | 33.1 | 19.5 | 36.1 | 62.6 | 66.6 |
| 2019 | 80.0 | 46.2 | 37.4 | 28.2 | 62.5 | 50.9 | 34.7 | 84.5 | 79.5 |
| 2021 | 83.4 | 78.0 | 66.7 | 52.9 | 70.2 | 71.6 | 55.2 | 74.8 | 83.2 |
| Source: Statistics Canada, Longitudinal Immigration Database. | |||||||||
The increase in the selection of new provincial nominees from the pool of former international students was more recent. In 2010, in all but two provinces (Newfoundland and Labrador, and Nova Scotia), no more than 15% of provincial nominees were former international students (Chart 5). Subsequently, this share increased considerably in several provinces, including Ontario (in 2019, 50% were previously international students), Alberta (50%) and British Columbia (43%). In other provinces, notable growth in this share is evident after 2014, including Prince Edward Island and Manitoba (37% in each province in 2019).
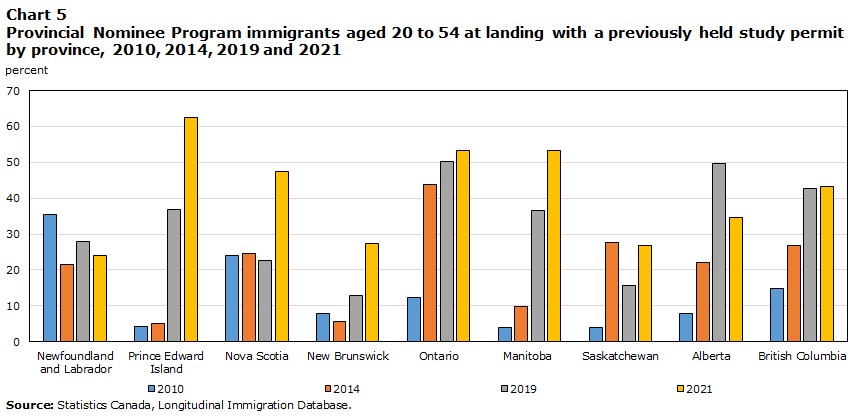
Data table for Chart 5
| Newfoundland and Labrador | Prince Edward Island | Nova Scotia | New Brunswick | Ontario | Manitoba | Saskatchewan | Alberta | British Columbia | |
|---|---|---|---|---|---|---|---|---|---|
| percent | |||||||||
| 2010 | 35.5 | 4.3 | 24.1 | 7.8 | 12.2 | 4.0 | 3.9 | 7.8 | 14.7 |
| 2014 | 21.6 | 5.0 | 24.5 | 5.5 | 43.7 | 9.7 | 27.5 | 22.0 | 26.8 |
| 2019 | 28.0 | 36.7 | 22.6 | 12.9 | 50.3 | 36.5 | 15.6 | 49.6 | 42.6 |
| 2021 | 24.1 | 62.6 | 47.5 | 27.4 | 53.3 | 53.4 | 26.8 | 34.7 | 43.4 |
| Source: Statistics Canada, Longitudinal Immigration Database. | |||||||||
Provincial differences in intended occupation
In 2019, principal applicants in the PNP were more likely than those in the FSWP to intend to work in skilled and technical occupationsNote and less likely to be professionals (Picot, Hou & Crossman, 2023).Note This orientation of provincial nominees toward skilled and technical, or even lower-skilled occupationsNote has existed since the inception of the PNP.Note As a result, the expansion of the PNP and the decline in the FSWP resulted in a significant increase in the share of all economic immigrants intending to work in skilled and technical occupations. The proportion of all economic principal applicants (aged 20 to 54 at landing) with an intended skilled or technical occupation rose from 20% in 2005 to 34% in 2019. The proportion with an intended professional occupation declined from 55% in 2005 to 38% in 2019 (Picot, Hou & Crossman, 2023).
The above observations are for Canada as a whole. These tendencies also held in most provinces. Compared with principal applicants in the FSWP or the CEC, in all provinces, relatively few new principal applicants landing via the PNP in 2019 intended to work in professional or managerial jobs, ranging from a low of 11% in Alberta to a high of 37% in British Columbia. The share of principal applicants who intended to work in managerial or professional jobs was much higher in the CEC and FSWP in all provinces, ranging from 43% to 73%, depending on the province (Table 2).
| Newfoundland and Labrador | Prince Edward Island | Nova Scotia | New Brunswick | Ontario | Manitoba | Saskatchewan | Alberta | British Columbia | ||||||||||
|---|---|---|---|---|---|---|---|---|---|---|---|---|---|---|---|---|---|---|
| Provincial nominees | Other skilled workers | Provincial nominees | Other skilled workers | Provincial nominees | Other skilled workers | Provincial nominees | Other skilled workers | Provincial nominees | Other skilled workers | Provincial nominees | Other skilled workers | Provincial nominees | Other skilled workers | Provincial nominees | Other skilled workers | Provincial nominees | Other skilled workers | |
| percent | ||||||||||||||||||
| 2009 and 2010 | ||||||||||||||||||
| Management | 16.0 | 11.8 | 90.2 | 9.5 | 16.5 | 25.2 | 56.8 | 22.3 | 25.3 | 24.1 | 10.5 | 14.5 | 6.3 | 10.1 | 3.7 | 15.3 | 14.9 | 30.4 |
| Professionals | 40.3 | 72.4 | 3.1 | 71.4 | 26.5 | 56.8 | 9.7 | 54.7 | 24.7 | 55.4 | 12.9 | 66.0 | 20.5 | 75.5 | 23.7 | 54.6 | 26.1 | 48.8 |
| Skilled and technical | 16.0 | 15.8 | 2.3 | 19.1 | 41.5 | 17.4 | 11.3 | 17.6 | 44.4 | 19.4 | 35.3 | 17.7 | 54.1 | 13.4 | 35.1 | 28.0 | 39.1 | 19.9 |
| Intermediate and clerical | 13.5 | 0.0 | 2.9 | 0.0 | 11.5 | 0.6 | 15.9 | 2.0 | 3.2 | 0.7 | 34.5 | 0.9 | 8.5 | 0.7 | 13.6 | 1.1 | 8.9 | 0.6 |
| Elemental and labourers | 13.5 | 0.0 | 0.3 | 0.0 | 1.2 | 0.0 | 4.9 | 0.0 | 1.7 | 0.1 | 3.0 | 0.3 | 8.7 | 0.0 | 22.2 | 0.2 | 10.4 | 0.1 |
| New workers | 0.8 | 0.0 | 0.8 | 0.0 | 1.5 | 0.0 | 1.2 | 3.4 | 0.8 | 0.3 | 3.3 | 0.3 | 1.6 | 0.3 | 1.2 | 0.6 | 0.4 | 0.2 |
| Others | 0.0 | 0.0 | 0.4 | 0.0 | 1.2 | 0.0 | 0.2 | 0.0 | 0.0 | 0.1 | 0.5 | 0.3 | 0.4 | 0.0 | 0.7 | 0.2 | 0.2 | 0.0 |
| Total | 100 | 100 | 100 | 100 | 100 | 100 | 100 | 100 | 100 | 100 | 100 | 100 | 100 | 100 | 100 | 100 | 100 | 100 |
| 2019 | ||||||||||||||||||
| Management | 4.9 | 10.8 | 27.5 | 4.6 | 3.0 | 9.6 | 18.5 | 12.3 | 8.3 | 14.9 | 11.7 | 10.7 | 16.1 | 10.3 | 6.3 | 13.1 | 18.7 | 14.0 |
| Professionals | 14.6 | 61.7 | 6.8 | 38.5 | 34.7 | 58.2 | 31.8 | 51.8 | 24.3 | 57.5 | 13.0 | 61.7 | 19.0 | 47.8 | 5.0 | 57.5 | 17.9 | 50.3 |
| Skilled and technical | 61.2 | 27.5 | 37.0 | 56.9 | 53.5 | 32.2 | 28.2 | 35.9 | 40.6 | 27.6 | 32.9 | 27.6 | 57.1 | 41.6 | 66.9 | 29.4 | 44.4 | 35.6 |
| Intermediate and clerical | 7.8 | 0.0 | 21.6 | 0.0 | 8.2 | 0.0 | 20.0 | 0.0 | 0.3 | 0.0 | 30.0 | 0.0 | 5.0 | 0.2 | 19.7 | 0.0 | 7.5 | 0.0 |
| Elemental and labourers | 11.6 | 0.0 | 7.1 | 0.0 | 0.6 | 0.0 | 1.2 | 0.0 | 0.2 | 0.0 | 11.7 | 0.0 | 1.3 | 0.0 | 1.4 | 0.0 | 5.0 | 0.0 |
| New workers | 0.0 | 0.0 | 0.0 | 0.0 | 0.0 | 0.0 | 0.1 | 0.0 | 25.7 | 0.0 | 0.1 | 0.0 | 0.7 | 0.2 | 0.2 | 0.0 | 6.2 | 0.0 |
| Others | 0.0 | 0.0 | 0.0 | 0.0 | 0.1 | 0.0 | 0.2 | 0.0 | 0.6 | 0.0 | 0.6 | 0.0 | 0.8 | 0.0 | 0.5 | 0.0 | 0.3 | 0.0 |
| Total | 100 | 100 | 100 | 100 | 100 | 100 | 100 | 100 | 100 | 100 | 100 | 100 | 100 | 100 | 100 | 100 | 100 | 100 |
| 2021 | ||||||||||||||||||
| Management | 3.1 | 7.4 | 5.0 | 3.1 | 4.3 | 5.9 | 13.5 | 7.4 | 8.7 | 8.4 | 7.3 | 7.8 | 8.5 | 6.2 | 6.3 | 9.4 | 21.0 | 15.1 |
| Professionals | 12.9 | 43.3 | 3.4 | 8.5 | 19.5 | 28.1 | 18.8 | 26.2 | 24.5 | 30.9 | 8.9 | 32.1 | 13.8 | 30.3 | 10.0 | 28.3 | 25.9 | 21.0 |
| Skilled and technical | 35.7 | 49.3 | 37.9 | 88.2 | 58.8 | 65.5 | 36.6 | 66.4 | 49.9 | 60.5 | 43.8 | 59.8 | 69.3 | 63.1 | 70.0 | 62.0 | 30.9 | 63.7 |
| Intermediate and clerical | 19.2 | 0.0 | 37.8 | 0.2 | 16.2 | 0.1 | 28.5 | 0.0 | 6.1 | 0.1 | 27.4 | 0.1 | 6.6 | 0.0 | 11.1 | 0.1 | 8.3 | 0.0 |
| Elemental and labourers | 25.9 | 0.0 | 15.4 | 0.0 | 0.6 | 0.0 | 0.9 | 0.0 | 0.6 | 0.0 | 11.8 | 0.0 | 0.5 | 0.0 | 1.3 | 0.0 | 2.6 | 0.0 |
| New workers | 2.8 | 0.0 | 0.1 | 0.0 | 0.5 | 0.4 | 1.1 | 0.0 | 9.9 | 0.1 | 0.5 | 0.1 | 0.9 | 0.3 | 0.9 | 0.2 | 10.8 | 0.1 |
| Others | 0.4 | 0.0 | 0.4 | 0.0 | 0.2 | 0.1 | 0.6 | 0.0 | 0.4 | 0.0 | 0.5 | 0.0 | 0.5 | 0.0 | 0.4 | 0.0 | 0.6 | 0.0 |
| Total | 100 | 100 | 100 | 100 | 100 | 100 | 100 | 100 | 100 | 100 | 100 | 100 | 100 | 100 | 100 | 100 | 100 | 100 |
Source: Statistics Canada, Longitudinal Immigration Database. |
||||||||||||||||||
There was also significant variation among provinces in the types of intended occupational groups selected through various PNPs. In 2019, Newfoundland and Labrador, Nova Scotia, Saskatchewan, and Alberta were heavily oriented toward selecting skilled and technical workers; these immigrants accounted for 54% to 67% of new PNP principal applicants aged 20 to 54 at landing in these provinces (Table 2). Although not necessarily the majority group, the selection of those intending to work in professional and managerial occupations was more prevalent in British Columbia (37% in 2019), Saskatchewan (35%), New Brunswick (50%), Nova Scotia (38%) and Prince Edward Island (34%). In Manitoba, selection was more heavily weighted toward lower-skilled workers (NOC skill level C or D) than in other provinces, at 42% in 2019, more than in either professional and managerial (25%) or skilled and technical (33%) occupations.
Provincial differences in age at landing, official language knowledge and source region
New adult provincial nominees have become younger in the recent past. At the national level, the share aged 20 to 29 at immigration increased from 24% in 2005 to 38% in 2019; the share aged 40 to 54 fell from 38% to 21% (Picot, Hou & Crossman, 2023). Generally, younger immigrants tend to have better economic outcomes than their older counterparts, particularly in the long run, all else equal (Bonikowska, Hou & Picot, 2015; Picot et al., 2022). The shift toward younger provincial nominees was observed in six of the nine provinces with PNPs, most notably in Prince Edward Island, Ontario, Manitoba, Alberta and British Columbia (Table 3). The result was these five provinces having 39% to 50% of their provincial nominees aged 20 to 29 at landing in 2019.
| Newfoundland and Labrador | Prince Edward Island | Nova Scotia | New Brunswick | Ontario | Manitoba | Saskatchewan | Alberta | British Columbia | |||||||||||||||||||
|---|---|---|---|---|---|---|---|---|---|---|---|---|---|---|---|---|---|---|---|---|---|---|---|---|---|---|---|
| 2009 and 2010 | 2019 | 2021 | 2009 and 2010 | 2019 | 2021 | 2009 and 2010 | 2019 | 2021 | 2009 and 2010 | 2019 | 2021 | 2009 and 2010 | 2019 | 2021 | 2009 and 2010 | 2019 | 2021 | 2009 and 2010 | 2019 | 2021 | 2009 and 2010 | 2019 | 2021 | 2009 and 2010 | 2019 | 2021 | |
| percent | |||||||||||||||||||||||||||
| Sex | |||||||||||||||||||||||||||
| Men | 53.9 | 53.4 | 48.7 | 49.4 | 56.0 | 60.8 | 54.0 | 50.9 | 56.7 | 51.1 | 52.4 | 54.4 | 53.7 | 55.9 | 58.2 | 50.8 | 53.4 | 54.7 | 50.8 | 52.2 | 54.4 | 51.8 | 55.9 | 53.0 | 51.4 | 53.4 | 54.21 |
| Women | 46.2 | 46.6 | 51.3 | 50.6 | 44.0 | 39.2 | 46.0 | 49.1 | 43.3 | 48.9 | 47.6 | 45.6 | 46.3 | 44.1 | 41.8 | 49.2 | 46.6 | 45.4 | 49.2 | 47.8 | 45.7 | 48.2 | 44.1 | 47.0 | 48.6 | 46.6 | 45.79 |
| Age at landing | |||||||||||||||||||||||||||
| 20 to 29 | 45.0 | 25.9 | 24.3 | 16.0 | 39.6 | 64.8 | 35.4 | 27.7 | 46.0 | 14.8 | 17.7 | 25.6 | 31.9 | 45.1 | 45.5 | 29.1 | 39.0 | 46.6 | 27.0 | 25.3 | 31.2 | 24.0 | 47.3 | 35.6 | 29.4 | 38.9 | 35.01 |
| 30 to 39 | 32.0 | 49.0 | 54.0 | 24.8 | 24.8 | 17.8 | 30.2 | 53.4 | 35.7 | 30.6 | 52.7 | 45.7 | 34.7 | 36.8 | 34.4 | 40.8 | 40.1 | 34.0 | 43.8 | 51.2 | 44.1 | 49.4 | 35.3 | 41.6 | 40.7 | 39.5 | 41.01 |
| 40 to 54 | 23.1 | 25.1 | 21.7 | 59.3 | 35.6 | 17.4 | 34.4 | 18.9 | 18.3 | 54.6 | 29.6 | 28.8 | 33.4 | 18.1 | 20.1 | 30.1 | 20.9 | 19.4 | 29.2 | 23.5 | 24.7 | 26.7 | 17.4 | 22.8 | 30.0 | 21.6 | 23.99 |
| Official languages | |||||||||||||||||||||||||||
| Speak neither English nor French | 2.4 | 1.0 | 1.6 | 74.5 | 5.8 | 1.9 | 5.0 | 0.5 | 1.1 | 31.9 | 1.2 | 1.2 | 25.5 | 2.2 | 2.0 | 16.6 | 1.5 | 1.8 | 16.0 | 3.6 | 2.3 | 4.9 | 1.4 | 1.5 | 13.3 | 2.1 | 1.4 |
| Other mother tongue, speak English or French | 79.3 | 87.1 | 88.5 | 23.2 | 87.5 | 92.6 | 65.8 | 91.1 | 91.0 | 60.2 | 85.8 | 87.1 | 67.6 | 91.7 | 92.8 | 81.0 | 94.0 | 94.3 | 78.8 | 93.4 | 92.8 | 84.4 | 94.3 | 91.1 | 63.2 | 85.1 | 85.5 |
| Mother tongue English or French | 18.3 | 12.0 | 9.9 | 2.3 | 6.7 | 5.5 | 29.3 | 8.5 | 7.9 | 7.9 | 13.0 | 11.8 | 6.9 | 6.1 | 5.2 | 2.5 | 4.5 | 3.9 | 5.2 | 3.0 | 4.9 | 10.7 | 4.3 | 7.4 | 23.5 | 12.9 | 13.1 |
| Source region | |||||||||||||||||||||||||||
| United States | 4.7 | 0.7 | 1.3 | 0.6 | 0.3 | 0.7 | 3.8 | 0.8 | 0.6 | 1.0 | 0.4 | 0.1 | 1.2 | 0.4 | 0.5 | 0.3 | 0.2 | 0.2 | 0.7 | 0.2 | 0.2 | 1.1 | 0.4 | 0.6 | 3.7 | 2.0 | 2.8 |
| Caribbean and Central and South America | 4.1 | 5.1 | 7.5 | 0.3 | 3.7 | 5.6 | 4.2 | 4.8 | 5.8 | 2.0 | 3.5 | 6.0 | 5.8 | 5.5 | 8.5 | 5.7 | 7.1 | 8.6 | 2.5 | 1.8 | 3.4 | 8.3 | 5.1 | 5.7 | 6.2 | 10.4 | 13.0 |
| Western Europe | 3.6 | 0.5 | 0.5 | 0.6 | 0.5 | 0.5 | 8.7 | 1.0 | 1.1 | 10.6 | 4.9 | 3.4 | 2.4 | 0.9 | 0.6 | 5.5 | 1.7 | 1.1 | 4.2 | 0.4 | 0.4 | 5.1 | 0.5 | 1.1 | 5.9 | 2.0 | 2.1 |
| Northern Europe | 11.2 | 4.6 | 1.6 | 1.8 | 1.2 | 0.4 | 20.8 | 2.2 | 2.8 | 4.0 | 0.7 | 0.4 | 2.2 | 1.4 | 1.2 | 1.1 | 0.6 | 0.8 | 3.2 | 1.0 | 1.2 | 7.0 | 1.3 | 2.5 | 14.4 | 6.1 | 6.1 |
| Southern Europe | 0.0 | 4.4 | 1.9 | 0.3 | 1.5 | 1.4 | 1.7 | 2.0 | 2.3 | 0.5 | 1.9 | 2.5 | 18.4 | 3.6 | 3.9 | 0.6 | 1.0 | 0.4 | 0.9 | 2.0 | 2.5 | 0.9 | 2.9 | 1.9 | 1.2 | 3.6 | 2.4 |
| Eastern Europe | 2.4 | 3.9 | 4.3 | 0.3 | 0.6 | 2.0 | 2.1 | 1.9 | 0.9 | 8.9 | 5.0 | 7.9 | 6.3 | 2.5 | 2.4 | 4.6 | 4.0 | 2.3 | 11.9 | 3.0 | 2.0 | 5.0 | 3.4 | 3.4 | 3.2 | 3.7 | 3.2 |
| Africa | 10.7 | 15.6 | 12.8 | 1.2 | 3.0 | 2.1 | 6.1 | 11.7 | 13.5 | 1.7 | 32.1 | 29.3 | 3.3 | 10.8 | 6.2 | 4.3 | 12.4 | 11.7 | 5.2 | 9.6 | 14.0 | 4.5 | 3.6 | 9.7 | 4.5 | 2.9 | 3.3 |
| Southern Asia | 19.5 | 18.3 | 25.1 | 1.6 | 39.0 | 61.0 | 10.4 | 42.1 | 44.4 | 3.8 | 16.7 | 23.3 | 18.0 | 37.9 | 49.3 | 18.5 | 35.6 | 41.9 | 7.8 | 40.9 | 44.7 | 19.0 | 37.7 | 39.5 | 7.3 | 33.7 | 34.5 |
| Southeast Asia | 13.0 | 32.2 | 36.1 | 0.8 | 16.9 | 16.7 | 8.0 | 7.4 | 7.8 | 7.1 | 15.7 | 14.3 | 2.7 | 2.4 | 2.5 | 39.2 | 14.1 | 11.7 | 47.6 | 15.7 | 13.8 | 37.8 | 25.3 | 19.1 | 18.2 | 4.0 | 3.4 |
| Eastern Asia | 23.7 | 12.4 | 4.8 | 84.1 | 30.7 | 6.2 | 17.5 | 21.2 | 16.8 | 55.6 | 12.3 | 6.4 | 23.1 | 29.8 | 20.2 | 15.2 | 19.0 | 18.9 | 10.7 | 21.4 | 10.9 | 8.4 | 17.7 | 14.0 | 29.9 | 25.1 | 22.0 |
| Western Asia | 5.3 | 1.7 | 3.7 | 8.3 | 2.5 | 3.3 | 16.5 | 4.4 | 3.6 | 4.7 | 6.4 | 6.2 | 16.4 | 4.7 | 4.6 | 4.8 | 4.0 | 2.4 | 4.8 | 3.9 | 6.8 | 1.9 | 1.4 | 1.9 | 3.0 | 3.3 | 5.0 |
| Other regions | 1.8 | 0.5 | 0.3 | 0.1 | 0.3 | 0.1 | 0.2 | 0.5 | 0.3 | 0.2 | 0.4 | 0.3 | 0.2 | 0.2 | 0.2 | 0.2 | 0.4 | 0.2 | 0.4 | 0.3 | 0.3 | 1.0 | 0.5 | 0.7 | 2.7 | 3.2 | 2.4 |
|
|||||||||||||||||||||||||||
There has also been a significant shift in the source regions of provincial nominees over the past decade. From 2009 to 2010, the dominant source region—that from which the highest percentage of provincial nominees originated—varied significantly among provinces. At that time, Southeast Asia was the dominant source region in three provinces, Eastern Asia in four and Northern Europe in one (Table 3). In 2019, the largest shares of provincial nominees were from Southern Asia in all but New Brunswick and Newfoundland and Labrador. In 2019, 34% to 42% of new provincial nominees came from Southern Asia, depending on the province. The second most common source region in 2019 varied among provinces and included Eastern Asia (five provinces), Southeast Asia (two provinces) and Southern Asia (one province). Overall, the source regions for provincial nominees were quite concentrated in 2019. Somewhere from one-half to two-thirds of provincial nominees came from just two source regions—typically, Southern Asia and one other Asian region—depending on the province.
The composition of language spoken at landing among provincial nominees changed significantly over the last decade. In 2009 and 2010, 5% to 32% of new provincial nominees spoke neither English nor French at landing.Note By 2019, this share had declined to virtually zero in all provinces (Table 3); almost all new provincial nominees indicated that they could speak English or French at landing. Most provincial nominee streams currently have some form of official language requirements, with professional jobs typically requiring greater ability in an official language than less-skilled jobs. Most new provincial nominees had a mother tongue other than English or French (85% to 94%, depending on the province), but indicated that they could speak some English or French at landing.
Summary and conclusion
The PNP grew continuously from about 500 nominees in 1999 to 88,300 in 2022. In recent years, more economic immigrants entered Canada via the PNP than through any other program; 35% did so in 2019 and 2022. Each province is responsible for the design and management of its PNP. Across all provinces, there are currently over 60 individual PNP streams through which immigrants can enter Canada.
Most trends in the report were examined up to 2019, because the pandemic years of 2020 and 2021 were unique. For example, in 2021, international travel restrictions resulted in a significant rise in the share of new provincial nominees selected from temporary residents already in Canada with pre-landing Canadian earnings or a pre-landing study permit. This occurred in all provinces but Alberta.
The PNP grew at different rates in various provinces. Manitoba had the largest and fastest-growing program during the first decade after the PNP was put in place. Ontario had a small program until around 2016, after which it grew rapidly. By 2019, the five provinces from Ontario westward to British Columbia had roughly an equal number of nominees each (around 12,000 immigrants). Nova Scotia had the largest program in the Atlantic provinces; Newfoundland and Labrador had a very small program over the past two decades.
The importance of the PNP as a source of economic immigrants varied significantly among provinces. In 2019, 90% of new economic immigrants were provincial nominees in Manitoba and Saskatchewan, compared with 15% in Ontario, likely because a high proportion of economic immigrants chose Ontario as their destination.
The share of new provincial nominees with Canadian work experience grew significantly in almost all provinces from 2010 to 2019. This trend tended to improve the economic outcomes of new provincial nominees. However, by 2019, there was large variation among provinces in the tendency to select provincial nominees from the temporary foreign worker pool. This tendency was high in Alberta, British Columbia, and Newfoundland and Labrador, while it was much lower in New Brunswick, Saskatchewan and Nova Scotia. The latter three provinces selected more provincial nominees from the candidate pool outside Canada than from among temporary foreign workers.
There was also a rise in the share of new provincial nominees who were former international students, with considerable variation by province. This share increased considerably in Ontario, Alberta and British Columbia, and much less so in Saskatchewan and New Brunswick. Immigrants with pre-landing Canadian study experience tend to have better economic outcomes than those without such experience, particularly in the longer run (Crossman & Hou, 2020).
In general, the PNP selected more skilled and technical economic immigrants (NOC skill level B) and fewer professionals (NOC skill level 0 or A) than the FSWP. However, there were significant provincial differences in the intended occupations of new nominees in 2019. Skilled and technical provincial nominees dominated in Nova Scotia, Saskatchewan and Alberta, while British Columbia, New Brunswick and Prince Edward Island had higher shares of professional and managerial provincial nominees, though still well below a majority. Manitoba was the one province where lower-skilled provincial nominees (NOC skill level C or D) outnumbered either professionals or skilled and technical nominees.
Provincial nominees were younger at landing in 2019 than in 2009 and 2010 in almost all provinces, and the percentage not speaking English or French declined significantly—to virtually zero—in all provinces over that period. A much higher share of new provincial nominees originated from a single source region in 2019 than a decade earlier. Nominees from Southern Asia were the largest single group (at 34% to 42%) in most provinces.
Over the two decades since the inception of the PNP, all provinces, except Newfoundland and Labrador, increasingly relied on the PNP for economic immigrants. During that time, virtually all provinces adjusted their PNPs to, among other things, improve the economic outcomes of PNP immigrants. An increasing share had pre-landing Canadian work or study experience, they were increasingly younger, and a declining share spoke neither English nor French. In 2019, however, there were also significant differences among provinces, particularly related to the tendency to select provincial nominees from among temporary foreign workers and former international students, as well as in the intended occupations of the nominees. These outcomes reflect differences among provinces’ respective PNP streams (see the appendix), the selection criteria and the choices made to meet the perceived needs of the provincial economies.
Apart from minimum language requirements, the selection criteria of the PNP differ widely across provinces, as do the sociodemographic characteristic profiles of the respective provincial nominees. In some ways, however, provinces are increasingly attracting and selecting candidates with similar profiles, notably with respect to pre-landing Canadian work and, to a lesser extent, study experience, as well as age and source region. As the PNP continues to expand and as other regionally focused programs are established,Note it will be important to continue to monitor the multitude of pathways available, and their respective outcomes, to inform policy.
Appendix: Streams under the Provincial Nominee Program
Introduction
Listed below are the streams of the provincial and territorial Provincial Nominee Program (PNP) that existed as of early 2022, and some of the major eligibility requirements.Note
According to the list below, there are 63 streams (some labelled as sub-streams by the respective province) within the PNP to which potential economic immigrants can apply.
There are several key dimensions of the eligibility rules that distinguish one stream from another, including the following:
- Whether the stream is restricted to particular skill levels: Some streams are unique to higher-skilled levels (typically National Occupational Classification [NOC] skill level 0, A or B), some to lower-skilled levels (NOC skill level C or D) and some allow any skill level. Some streams are specific to unique occupational groups, often those related to technology or health care.
- Whether the stream is restricted to in-demand occupations: Many streams focus on specific occupations seen to have immediate labour shortages. These occupations can be higher skilled, lower skilled or both, in some cases.
- Whether the stream requires a job offer: Many of the streams require the applicant to have a job offer from an employer in the province.
- Whether the stream is restricted to temporary foreign workers, offshore foreign nationals or both: Many of the streams are designed to transition temporary foreign workers to permanent residents.
- Whether the stream is restricted to international students: Some streams are unique to international students studying in the province (often with one year of work experience), and some accept international students who have studied anywhere in Canada.
- Whether the stream accepts entrepreneurs in general, or those in particular industries: Some entrepreneurial streams are restricted to particular industries, such as technology industries or farm entrepreneurs. Some entrepreneurial streams require a minimum net wealth (e.g., $600,000 to $800,000) or a minimum level of investment (e.g., $150,000).
- Selection may be through the federal Express Entry application management system (referred to as “enhanced nominations”), or a provincially developed selection system.
- Language requirements can vary among streams: Those streams focusing on higher-skill occupations typically have a higher level of official language requirements (e.g., level 6 or 7 on the Canadian Language Benchmarks [CLB] test). Those focusing on lower-skilled occupations (NOC skill level C or D) typically require lower official language levels (e.g., CLB level 4).
- Educational requirements can vary among streams: Often there is a need for the applicant to demonstrate that their education is equivalent to that received in Canada.
Given the large number of dimensions across which the eligibility rules can vary, few streams are identical across most provinces. However, there are some generalities. All provinces (and territories) have
- an entrepreneurial immigrant stream or streams
- a stream or streams dedicated to higher-skilled immigrants (NOC skill level 0, A or B)
- streams through which lower-skilled workers (NOC skill level C or D) can immigrate, typically in occupations deemed to have immediate labour shortages
- a stream or streams that allow immigrants to be selected from among temporary foreign workers, applicants outside Canada or both
- streams that select economic immigrants via the federal Express Entry application management system or via the province’s own selection system.
Streams by province
Listed below are the PNP streams currently in existence in each province (2022). Different streams have different eligibility requirements, many of which are not listed here. Depending on the stream, these requirements can include a minimum level of education comparable to that received in Canada, a minimum score on a points grid, minimum official language test requirements, the need to demonstrate that no Canadian is available for the job, a wage rate at the median level or above for the occupation, the ability to support oneself financially, a minimum dollar investment requirement, or a job that will last for a number of years (often two), or more. Different criteria apply to different streams.
British Columbia
The British Columbia Provincial Nominee Program (BC PNP) is described as enabling the province to select and nominate foreign workers, international students and entrepreneurs to help meet British Columbia’s labour market needs, support government priorities and help grow British Columbia’s economy.Note Streams under the BC PNP include the following:
- Skilled workers program—nominates and selects foreign workers, through either the federal Express Entry system or a British Columbia program. Requires a job offer. The following five streams are sub-streams of the skilled workers program:
- Health care professionals stream—includes selected health care occupations and childcare occupations.
- BC PNP Tech program—focuses on selected occupations in the high-tech field.
- International Graduate program.
- International Post-Graduate program.
- Entry Level and Semi-Skilled program for lower-skilled workers, application through British Columbia only (not the federal Express Entry system).
- Entrepreneurial stream—also selected through the federal Express Entry system.
Alberta
The Alberta Advantage Immigration Program (AAIP) is described as requiring nominees to have skills to fill job shortages or be planning to buy or start a business in Alberta.Note Streams under the AAIP include the following:
- Alberta Opportunity Stream—for temporary foreign workers who have a job offer in an occupation with a labour shortage; can be any skill level. There is a short list of ineligible occupations.
- Alberta Express Entry Stream—allows the province to nominate immigrants from the federal Express Entry system; an Accelerated Tech Pathway is part of this stream.
- Rural Renewal Stream—can be a temporary foreign worker working in Alberta or be invited to apply through Express Entry; must have a job offer to work in rural Alberta.
- Rural Entrepreneur Stream—for individuals who start or buy a business in rural Alberta.
- Graduate Entrepreneur Stream—for international students graduating from an Alberta postsecondary institution who start or buy a business.
- Farm Stream—for individuals willing to buy or start a farm.
- Foreign Graduate Entrepreneur Stream—for individuals graduating from a postsecondary institution outside Canada who want to launch start-up enterprises and innovative businesses in Alberta.
Saskatchewan
The Saskatchewan Immigrant Nominee Program (SINP) is described as targeting immigrants with skills and experience in high-demand occupations in Saskatchewan, such as health care, agriculture, trades or business.Note There are four SINP categories:
- International Skilled Worker—for skilled workers who want to work and live in Saskatchewan.
- Worker with Saskatchewan Work Experience—for foreign nationals who already live and work in Saskatchewan.
- Entrepreneur—for those who plan to start a business.
- Farm Owner and Operator—for those who plan to buy and operate a farm in Saskatchewan.
The International Skilled Worker stream has several sub-streams:
- Employment Offer—must have a job offer in an occupation at NOC skill level 0, A or B or in a designated trade; must have one year of work experience in the occupation, can be either in Canada or abroad; and must have an official language at level 4 if in a regulated occupation.
- Tech Talent Pathway—eligibility rules similar to above but must be in a high-skilled technology or innovation sector.
- Occupation In-Demand—for those in a higher-skilled in-demand occupation who do not have a job offer, have a postsecondary education comparable to that in Canada and score at least level 4 in official language tests.
- Saskatchewan Express Entry—for those who do not have a job offer but apply through the federal Express Entry system.
- Hard-to-Fill Skills Pilot—for intermediate and low-skilled occupations where there is a job offer, language at level 4, at least a secondary school education and a temporary foreign worker with at least one year of experience.
The Worker with Saskatchewan Work Experience stream for temporary foreign workers who have a job offer includes the following:
- Skilled worker (NOC skill level 0, A or B) with a permanent full-time job offer.
- Semi-skilled Agricultural Worker.
- Health Professionals.
- Hospitality Sector Project.
- Long-Haul Truck Driver Project.
- International students graduating from a Saskatchewan or Canadian postsecondary institution.
The Entrepreneur and Farm Owner and Operator streams include the following:
- Entrepreneurial programs for those who wish to start or own a business; need to complete a points score application. Those with the highest points are selected first.
- International Graduate Entrepreneur Program for those graduating from a Saskatchewan institution who want to start a business.
- Farm Owner and Operator Entrepreneurial Program for those who will own a farm with substantial assets.
Manitoba
The Manitoba Provincial Nominee Program (MPNP) is described as locally driven and based on the needs of Manitoba employers.Note The MPNP identifies in-demand occupations based on Manitoba labour market information and occupational forecasts, as well as through direct employer consultations. There is a list of in-demand occupations, which appear to be primarily at NOC skill levels 0, A and B. Selection criteria are similar to those of the federal Express Entry system. Candidates are invited to submit an expression of interest. They must have settlement funds (based on a low-income cut-off), be proficient in English and commit to living in Manitoba. The MPNP includes the following streams:
- Skilled Worker in Manitoba (temporary foreign workers)—requires a job offer.
- Skilled Workers Overseas—no job offer required.
- International Education Stream—for international graduates of Manitoba postsecondary institutions; can use the Career Employment Pathway sub-stream (job offer required), Graduate Internship Pathway sub-stream (no job offer) or International Student Entrepreneur Pilot sub-stream.
- Business Investor Stream—can use the Entrepreneur Pathway or the Farm Investor Pathway.
Ontario
The Ontario Immigrant Nominee Program (OINP) is described as recognizing and nominating people for permanent residence who have the skills and experience the Ontario economy needs (e.g., temporary foreign workers, international students and others with the right skills, experience and education).Note Streams under the OINP include the following:
- Foreign Worker stream—requires an employer’s full-time, indeterminate job offer in a skilled occupation (NOC skill level 0, A or B); open to individuals in Ontario (temporary foreign workers) or from outside Canada, the job offer must be at the median wage level or above for the occupation and must be urgently required by the employer. For licensed occupations, the applicant must hold a valid permit for Ontario.
- French-Speaking Skilled Worker stream—for French-speaking foreign workers with strong English language abilities.
- International Student stream—requires an employer’s job offer with similar requirements to those above (but low-wage rather than median wage is acceptable).
- In-Demand Skills stream—for lower-skilled workers at NOC skill levels C and D (selected occupations), requires an employer’s job offer; must have CLB level 4 English or French, and make above the median wage for the occupation. Can be a temporary foreign worker or from outside Canada.
- Masters Graduate stream—for graduates from an Ontario university; requires CLB level 7 or above; must have sufficient funds to support self.
- PhD Graduate stream—requires graduation from an Ontario university; similar requirements to above.
- Human Capital Priorities stream—nominated by the province; works through the federal Express Entry FSWP and Canadian Experience Class with the requirements of those programs.
- Skilled Trades stream—similar to the Federal Skilled Trades Program, for temporary foreign workers (i.e., must have Ontario work experience); works through the federal Express Entry system. If in a regulated occupation, applicant must have a valid licence.
- Entrepreneur stream—must have at least $800,000 net worth, own or start a company in Ontario and generate a minimum of two full-time jobs.
New Brunswick
The New Brunswick Provincial Nominee Program (NBPNP) is described as an immigration program that allows the Government of New Brunswick to nominate individuals with the greatest ability to become economically established in New Brunswick and who intend to reside in New Brunswick.Note The New Brunswick Skilled Worker Stream is intended to help New Brunswick employers recruit foreign nationals and international graduates whose skills are in limited supply in the province. Employers must have been unable to fill job vacancies with a Canadian citizen or permanent resident. Streams under the NBPNP include the following:
- Skilled Worker Stream—must have an offer of employment from a New Brunswick company and commit to living in the province permanently, with standard requirements such as language skills. Employers must demonstrate they cannot find a Canadian to fill the job; includes foreign nationals and international students. Individuals are ranked on a New Brunswick scoring process; can be any skill level.
- New Brunswick Express Entry Stream—for temporary foreign workers currently living in New Brunswick and working in an occupation at the NOC skill level 0, A or B, or foreign students studying in New Brunswick with at least one year of high-skilled job experience.
- New Brunswick Business Immigration Stream—for individuals willing to start or purchase a business in selected industries (not noted) in New Brunswick.
Nova Scotia
The Nova Scotia Nominee Program (NSNP) is aimed at attracting immigrants who have the skills and experience targeted by Nova Scotia.Note Streams under the NSNP include the following:
- Nova Scotia Labour Market Priorities—works through the federal Express Entry system to meet Nova Scotia labour market needs; candidates are nominated by the province; includes special mention of nurses.
- Labour Market Priorities for Physicians—works through the federal Express Entry system; must be approved by health authorities in Nova Scotia; focus on general practitioners and family physicians (NOC 3112) and specialist physicians (NOC 3111).
- Physician—same as above, but does not work through the federal Express Entry system.
- Entrepreneur—must have net worth of at least $600,000, invest at least $150,000 of own money, have significant experience and have level 5 English or French.
- International Graduate Entrepreneur—for international student graduates of a Nova Scotia postsecondary institution; must have owned and operated a business for at least one year in Nova Scotia.
- International Graduates in Demand—currently open only to nurse aides and orderlies, and early childhood educators.
- Skilled Worker—for lower- or higher-skilled foreign workers and international student graduates; must have a job offer from an employer (who was unable to find a permanent resident or Canadian citizen), at least a high school education and CLB level 4 English or French; medium- and low-skilled workers must be temporary foreign workers (e.g., six months’ experience with the employer).
- Occupations in Demand—NOC skill levels C and D specifically, selected occupations, CLB level 4 English or French; have financial resources to successfully settle.
- Nova Scotia Experience: Express Entry—must have one year of work experience in Nova Scotia (e.g., temporary foreign worker) in a higher-skill occupation (NOC skill level 0, A or B), CLB level 7 English or French for NOC level 0 or A and CLB level 5 for NOC level B.
Prince Edward Island
The Prince Edward Island Provincial Nominee Program is described as selecting individuals based on their intention to live and work in Prince Edward Island and their economic ability to establish themselves.Note Priority is given to entrepreneurs and individuals qualified to work in areas with identified skill shortages in the Prince Edward Island labour market.
- Occupations in Demand—allows employers to fill specific in-demand jobs (with job offer); applicant can be from inside or outside Canada. Currently, in-demand occupations include nurse aides and orderlies, construction labourers and trades, truck drivers, and light duty cleaners.
- Skilled Workers in PEI—must be currently employed; allows employers to fill high-skilled positions that they are unable to fill through the local job market.
- Skilled Workers Outside Canada—employer must have permission to make a job offer; applicant must have a job offer in an occupation at NOC skill level 0, A or B and must have a postsecondary certificate or degree.
- PEI Express Entry—for people nominated from one of the federal Express Entry programs; can be from inside or outside Canada; can have a job offer or not; priority given to those who are living and working in Prince Edward Island (e.g., temporary foreign workers).
- Critical Workers—allows employers to offer a job at NOC level C or D to temporary foreign workers working in PEI.
- International Graduates—must have graduated from a publicly funded Prince Edward Island postsecondary institution.
- Intermediate Experience Stream—must have a full‐time, non-seasonal (i.e., permanent or minimum of two years) job offer from a Prince Edward Island employer in an intermediate-skilled position (NOC C).
Newfoundland and Labrador
The Newfoundland and Labrador Provincial Nominee Program (NLPNP) is described as an efficient immigration process for qualified skilled workers, international graduates and their families who wish to settle permanently in Newfoundland and Labrador.Note For skills-related streams, employers must seek a job vacancy assessment with the labour market assessment officer. Streams under the NLPNP include the following:
- Express Entry Skilled Worker—must have a higher-skilled (NOC level 0, A or B) job offer and meet the criteria of the federal Express Entry system; must have a work permit or be eligible to receive one (i.e., be a temporary foreign worker) and demonstrate that one’s education is comparable to Canadian education.
- Skilled Worker—must be a temporary foreign worker, have a job offer that will last at least two years, receive pay that meets provincial wage rates and pass language requirements; can be any skill level, including NOC C and D. Employer must demonstrate that the job is essential.
- International Graduate—must be a recent graduate temporary foreign worker with a work permit and a job offer at NOC skill level 0, A or B, or C (if an in-demand occupation); must demonstrate sufficient funds.
- Priority Skills Newfoundland and Labrador—for higher-skilled workers in in-demand occupations, or master’s or PhD graduates of Memorial University in technology, aquaculture, agriculture or health care.
- International Entrepreneur—must buy or start a business and after one year may be invited to become a permanent resident.
- International Graduate Entrepreneur—for graduates of Memorial University or College of the North Atlantic only.
Yukon
The Yukon Nominee Program (YNP) has two main streams.Note In both cases, the application process is employer driven, and the employer applies through the YNP to obtain workers for a demonstrated labour shortage.
- Skilled Worker Stream—for those applying in occupations at NOC skill level 0, A or B.
- Critical Impact Worker Stream—for those applying in occupations at NOC skill level C or D.
Northwest Territories
The Northwest Territories Nominee Program includes three employer-driven programs to fill labour shortages demonstrated by the employer.Note There is also one business stream.
- Skilled Worker—allows employers to fill labour shortages where formal education or specialized training is required.
- Entry Level/Semi-Skilled Occupations—allows employers to fill demonstrated labour shortages where a Canadian candidate was not available locally or nationally for a position; applicant must have worked for the employer for at least six months (e.g., temporary foreign worker).
- NWT Express Entry—nominated by the Northwest Territories through the federal Express Entry system; must meet the criteria of the Skilled Worker stream.
References
Bonikowska, A., Hou, F., & Picot, G. (2015). Which human capital characteristics best predict the earnings of economic immigrants? Ottawa: Statistics Canada, Analytical Studies Branch Research Paper Series 368.
CIC (Citizenship and Immigration Canada). (2011). Evaluation of the Provincial Nominee Program. Research and Evaluation Branch, Evaluation Division.
Crossman, E., & Hou, F. (2022). International students as a source of labour supply: Pre-immigration study in Canada and post-immigration earnings. Statistics Canada, Economic and Social Reports, 2(2), 1-12.
Hou, F., & Picot, G. (2016). Changing immigrant characteristics and pre-landing Canadian earnings: Their effect on entry earnings over the 1990s and 2000s. Canadian Public Policy 42(3): 308-232.
IRCC (Immigration, Refugees and Citizenship Canada). (2017). Evaluation of the Provincial Nominee Program. Research and Evaluation Branch, Evaluation Division.
IRCC (Immigration, Refugees and Citizenship Canada). (Website accessed May 16, 2022). How the Provincial Nominee Program (PNP) works - Canada.ca
OECD (Organisation for Economic Co-operation and Development). (2019). Recruiting Immigrant Workers: Canada 2019 | Recruiting Immigrant Workers | OECD iLibrary
Picot, G., Hou, F., & Crossman, E. (2023). The Provincial Nominee Program: An analysis of its expansion in Canada. Economic and Social Reports, 3(7), 1-12.
Picot, G., Hou, F., Xu, L., & Bonikowska, A. (2022). Which immigration selection factors best predict the earnings of economic principal applicants? Immigration, Refugees and Citizenship Canada, Policy Research Branch.
Statistics Canada. (2020). Longitudinal Immigration Database (IMDB) Technical Report, 2018 (Diversity and Sociocultural Statistics, No. 24).
- Date modified: