
Economic and Social Reports
Temporary foreign workers in primary agriculture in Canada: Transition from temporary residency to permanent residency and industry retention after transition
DOI: https://doi.org/10.25318/36280001202400300001-eng
Text begins
Abstract
This study examines the transition to permanent residency (PR) of temporary foreign workers (TFWs) in primary agriculture and the retention in the sector among those who obtained PR. The study focuses on TFWs whose first employment was in primary agriculture and who entered the sector between 2005 and 2020. Depending on the entry year, the transition rate is observed up to a maximum of 10 years after entry and the retention rate to a maximum of 5 years after PR transition.
Overall, rates of transition from temporary to permanent residency were low among TFWs who first entered primary agriculture during the study period. Five years after entry, slightly more than 10% had obtained PR. After 10 years since workers were first employed in the sector, the cumulative transition rate reached 16.8%. Transition rates were considerably lower for TFWs with a designated occupation at a lower skill level than for those with one at a higher skill level. Rates were lower for TFWs with permits issued through the Seasonal Agricultural Worker Program than for those with permits issued through other work permit programs, and rates were lower for those entering crop production than for those entering other primary agriculture subsectors.
Most TFWs who entered primary agriculture left the sector after receiving PR. One year after PR admission, half of former TFWs or less stayed in the sector; five years after PR admission, around one-fifth were still employed in the sector and more than 60% moved to another industry. Additionally, a significant portion of former TFWs did not have a T4 Statement of Remuneration Paid after their transition to PR.
Keywords: temporary foreign workers, agriculture, transition to permanent residency, industry retention
Authors
Li Xu and Jianwei Zhong are with the Research and Data Branch, Immigration, Refugees and Citizenship Canada. Yuqian Lu is with the Social Analysis and Modelling Division, Analytical Studies and Modelling Branch, at Statistics Canada.
Acknowledgments
This study was conducted in collaboration with Immigration, Refugees and Citizenship Canada. The authors would like to thank Feng Hou and Stéphane Arabackyj for their review and comments on an earlier version of this paper.
Introduction
The agricultural sector in Canada has relied increasingly on temporary foreign workers (TFWs) to fill the longstanding labour shortage (Meyer-Robinson & Burt, 2016; Zhang, Ostrovsky & Arsenault, 2021). The number of TFWs in crop production, animal production and aquaculture, and support activities for crop and animal production (hereafter primary agriculture) more than tripled, and their share in the total sectorial workforce nearly tripled between 2005 and 2020. In 2019, the year before the onset of the COVID-19 pandemic, around 343,000 people worked in primary agriculture in Canada, and, among them, about 61,000 (18%) were TFWs. Disrupted by the pandemic, the number of TFWs in 2020 was slightly lower but remained around 60,000.Note
The majority of TFWs in agriculture perform low-skill jobs, are recruited through the Seasonal Agricultural Worker Program (SAWP) and other agricultural streams, and have very limited pathways to transition to permanent residency (PR). Specifically, SAWP participants come to Canada during the growing season and leave afterwards. Many of them return for many years through a new SAWP work permit. The COVID-19 pandemic exposed the vulnerability of this “stable” labour supply. There have been renewed calls for more opportunities for foreign agricultural workers to transition to PR to ensure the continuity of the labour supply and to better protect these workers (Alboim & Cohl, 2020; Akbar, 2022; Royal Bank of Canada, 2023).
Few empirical studies have focused on the PR transition of TFWs working in primary agriculture, and even less is known about their retention in the sector after obtaining PR status. This study intends to fill some of these knowledge gaps.
Data and methods
This study is based on three components of Statistics Canada’s 2022 Canadian Employer–Employee Dynamics Database: the Non-permanent Resident File, the Permanent Resident File and the Longitudinal Worker File.
The study examines the transition from temporary residency (TR) to PR and the retention in primary agriculture of TFWs whose first observed employment was in primary agriculture (hereafter new entrants) between 2005 and 2020. Only TFWs with the highest earnings from primary agriculture are included in the analysis.Note In this study, primary agriculture includes three subsectors: crop production, animal production and aquaculture (hereafter animal production) and support activities for crop and animal production (hereafter support activities). If TFWs were employed in multiple agricultural subsectors, they would be counted only in the subsector where they received the highest earnings.
The majority of TFWs who entered primary agriculture received an employer-specific work permit under the Temporary Foreign Worker Program (TFWP), which included a designated occupation. Some work permits issued under the International Mobility Program (IMP) also included occupational information. This study uses this information and categorizes TFWs into two broad skill levels based on the 2016 National Occupational Classification (NOC): lower skill (NOC skill levels C and D) and higher skill (NOC skill levels A, B and 0). Over the study period, around 10% of new entrants in the sector had an open work permit and their occupation skill level was unspecified; therefore, for the analysis, their skill level is classified as unknown.
This study compares the TR-PR transition and retention of TFWs in primary agriculture between the following four main work permit program streams recruiting TFWs: the SAWP, other agricultural TFWPs, other TFWPs,Note and the IMP. The small number of study permit holders who worked in primary agriculture are excluded from the analysis,Note as are TFWs who obtained PR the same year they entered primary agriculture.
Characteristics of new entrants in primary agriculture between 2005 and 2020
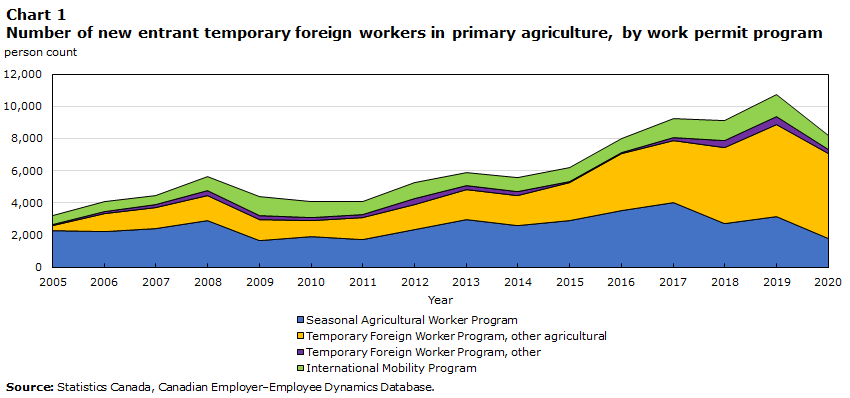
As shown in Chart 1, between 2005 and 2019, the annual number of new entrants in primary agriculture increased considerably, from just over 3,000 in 2005 to over 10,000 in 2019. Much of this increase can be attributed to the increase in the number of new entrants with permits issued under other agricultural TFWPs, which surpassed the number of new SAWP entrants since 2018. The annual number of new entrants with permits issued through the SAWP also increased, but at a lower rate. The total number of new entrants in the sector fell to just over 8,000 in 2020 during the pandemic, largely because of a decrease in SAWP participants.
Data table for Chart 1
| Year | Seasonal Agricultural Worker Program | Temporary Foreign Worker Program, other agricultural | Temporary Foreign Worker Program, other | International Mobility Program |
|---|---|---|---|---|
| person count | ||||
| 2005 | 2,319 | 273 | 75 | 551 |
| 2006 | 2,255 | 1,108 | 98 | 613 |
| 2007 | 2,430 | 1,320 | 142 | 600 |
| 2008 | 2,912 | 1,568 | 291 | 890 |
| 2009 | 1,690 | 1,264 | 261 | 1,185 |
| 2010 | 1,926 | 975 | 192 | 975 |
| 2011 | 1,743 | 1,352 | 162 | 847 |
| 2012 | 2,339 | 1,539 | 404 | 1,019 |
| 2013 | 2,955 | 1,874 | 233 | 833 |
| 2014 | 2,581 | 1,863 | 251 | 882 |
| 2015 | 2,894 | 2,378 | 50 | 868 |
| 2016 | 3,552 | 3,510 | 48 | 918 |
| 2017 | 4,000 | 3,864 | 212 | 1,196 |
| 2018 | 2,703 | 4,767 | 396 | 1,277 |
| 2019 | 3,133 | 5,737 | 468 | 1,411 |
| 2020 | 1,793 | 5,287 | 243 | 888 |
| Source: Statistics Canada, Canadian Employer–Employee Dynamics Database. | ||||
To simplify the presentation, new entrants are grouped into four entry cohorts—2005 to 2009, 2010 to 2014, 2015 to 2019 and 2020—based on their first year of employment in primary agriculture. Among new entrants of all four entry cohorts examined, almost 90% were men and about half were in the 25-to-34 age group. Overall, around 40% of new entrants started their work in Ontario. Quebec and British Columbia also drew a significant number of TFWs and saw their share increase in recent years.
Mexico is the most important source country of TFWs in primary agriculture. For the early cohort of 2005 to 2009, 37.8% of new entrants came from Mexico. Over the study period, the number of TFWs from Mexico increased, but its share decreased by 7 to 8 percentage points. The share from Caribbean countries also decreased from 21.5% for the 2005-to-2009 entry cohort to 12.3% for the 2020 cohort. Conversely, the share of TFWs from other Central American countries increased from 12.6% to 26.6% and their number increased by 3.2 times, from nearly 3,000 for the 2005-to-2009 cohort to around 12,000 for the 2015-to-2019 cohort.
Transition to permanent residency
Transition rates are observed up to 10 years after entry for the TFWs first employed between 2005 and 2009, and up to 1 year for the most recent entry cohort (2020) (Table 1). Overall, the rate of TR-PR transition increased over time after entry. For example, for the 2005-to-2009 entry cohort, the transition rate by TFWs’ first, third and fifth year after entry was at 2.1%, 7.6% and 11.6%, respectively. Ten years after entry, 16.8% of them obtained PR. The transition rate of other entry cohorts follows a similar pattern for observable years since entry.
| Entry cohort | Primary agriculture, total | Lower skill | Higher skill | Skill level unknown | ||||||||||||
|---|---|---|---|---|---|---|---|---|---|---|---|---|---|---|---|---|
| 2005 to 2009 | 2010 to 2014 | 2015 to 2019 | 2020 | 2005 to 2009 | 2010 to 2014 | 2015 to 2019 | 2020 | 2005 to 2009 | 2010 to 2014 | 2015 to 2019 | 2020 | 2005 to 2009 | 2010 to 2014 | 2015 to 2019 | 2020 | |
| percent | ||||||||||||||||
| Year since first entry | ||||||||||||||||
| 1 | 2.1 | 1.5 | 1.3 | 1.8 | 0.4 | 0.2 | 0.2 | 0.2 | 16.4 | 11.3 | 8.3 | 13.9 | 8.3 | 5.4 | 7.6 | 11.7 |
| 2 | 5.1 | 4.5 | 3.5 | Note ...: not applicable | 2.0 | 1.7 | 0.9 | Note ...: not applicable | 29.8 | 27.3 | 25.6 | Note ...: not applicable | 15.7 | 11.6 | 15.3 | Note ...: not applicable |
| 3 | 7.6 | 8.1 | Note ...: not applicable | Note ...: not applicable | 3.5 | 4.1 | Note ...: not applicable | Note ...: not applicable | 42.2 | 45.6 | Note ...: not applicable | Note ...: not applicable | 21.0 | 17.2 | Note ...: not applicable | Note ...: not applicable |
| 4 | 9.8 | 11.0 | Note ...: not applicable | Note ...: not applicable | 5.0 | 6.4 | Note ...: not applicable | Note ...: not applicable | 49.8 | 52.6 | Note ...: not applicable | Note ...: not applicable | 25.5 | 21.5 | Note ...: not applicable | Note ...: not applicable |
| 5 | 11.6 | 13.1 | Note ...: not applicable | Note ...: not applicable | 6.4 | 8.4 | Note ...: not applicable | Note ...: not applicable | 53.9 | 57.0 | Note ...: not applicable | Note ...: not applicable | 28.8 | 24.2 | Note ...: not applicable | Note ...: not applicable |
| 6 | 13.1 | 14.7 | Note ...: not applicable | Note ...: not applicable | 7.8 | 9.9 | Note ...: not applicable | Note ...: not applicable | 56.2 | 59.0 | Note ...: not applicable | Note ...: not applicable | 30.9 | 25.6 | Note ...: not applicable | Note ...: not applicable |
| 7 | 14.3 | 15.7 | Note ...: not applicable | Note ...: not applicable | 8.9 | 11.0 | Note ...: not applicable | Note ...: not applicable | 57.8 | 59.8 | Note ...: not applicable | Note ...: not applicable | 32.3 | 26.4 | Note ...: not applicable | Note ...: not applicable |
| 8 | 15.3 | Note ...: not applicable | Note ...: not applicable | Note ...: not applicable | 9.9 | Note ...: not applicable | Note ...: not applicable | Note ...: not applicable | 59.5 | Note ...: not applicable | Note ...: not applicable | Note ...: not applicable | 33.2 | Note ...: not applicable | Note ...: not applicable | Note ...: not applicable |
| 9 | 16.1 | Note ...: not applicable | Note ...: not applicable | Note ...: not applicable | 10.7 | Note ...: not applicable | Note ...: not applicable | Note ...: not applicable | 60.6 | Note ...: not applicable | Note ...: not applicable | Note ...: not applicable | 33.8 | Note ...: not applicable | Note ...: not applicable | Note ...: not applicable |
| 10 | 16.8 | Note ...: not applicable | Note ...: not applicable | Note ...: not applicable | 11.5 | Note ...: not applicable | Note ...: not applicable | Note ...: not applicable | 60.9 | Note ...: not applicable | Note ...: not applicable | Note ...: not applicable | 34.1 | Note ...: not applicable | Note ...: not applicable | Note ...: not applicable |
| Total count | 21,850 | 24,950 | 43,380 | 8,210 | 18,190 | 20,160 | 37,330 | 7,110 | 1,230 | 1,330 | 2,370 | 380 | 2,430 | 3,460 | 3,680 | 720 |
|
... not applicable Note: Counts are rounded to the nearest 10. Source: Statistics Canada, Canadian Employer–Employee Dynamics Database. |
||||||||||||||||
Transition rates were significantly and consistently higher among those with occupations at higher skill levels. For example, for the 2005-to-2009 entry cohort, the rates for those who worked in higher-skill occupations by the 1st, 3rd, 5th and 10th year after entry were 16.4%, 42.2%, 53.9% and 60.9%, respectively, versus 0.4%, 3.5%, 6.4% and 11.5%, respectively, for those who worked in lower-skill occupations. The differences between TFWs with higher- and lower-skill occupations are comparable for the other entry cohorts during the observable years since entry.
Across TFWP streams, the transition rates were lowest for those who first entered with a permit issued under the SAWP (Table 2). For the 2005-to-2009 entry cohort, less than 1% of SAWP workers received PR by the 3rd year after entry, 2.4% by the 5th year and aggregated to 5.9% after the 10th year. Transition rates were similarly low for the more recent entry cohorts for the years that can be observed. Transition rates were higher for TFWs with a permit issued through other agricultural streams than for those who entered through the SAWP but lower than for those with a permit issued under other TFWPs and the IMP.
| Entry cohort | SAWP | Other agricultural TFWPs | Other TFWPs | IMP | ||||||||||||
|---|---|---|---|---|---|---|---|---|---|---|---|---|---|---|---|---|
| 2005 to 2009 | 2010 to 2014 | 2015 to 2019 | 2020 | 2005 to 2009 | 2010 to 2014 | 2015 to 2019 | 2020 | 2005 to 2009 | 2010 to 2014 | 2015 to 2019 | 2020 | 2005 to 2009 | 2010 to 2014 | 2015 to 2019 | 2020 | |
| percent | ||||||||||||||||
| Year since first entry | ||||||||||||||||
| 1 | Note x: suppressed to meet the confidentiality requirements of the Statistics Act | Note x: suppressed to meet the confidentiality requirements of the Statistics Act | Note x: suppressed to meet the confidentiality requirements of the Statistics Act | Note x: suppressed to meet the confidentiality requirements of the Statistics Act | 1.1 | 0.5 | 0.4 | Note x: suppressed to meet the confidentiality requirements of the Statistics Act | 4.6 | Note x: suppressed to meet the confidentiality requirements of the Statistics Act | 3.3 | 7.4 | 9.4 | 7.2 | 7.8 | 13.4 |
| 2 | 0.4 | 0.2 | 0.3 | Note ...: not applicable | 4.3 | 3.1 | 1.6 | Note ...: not applicable | 28.1 | 22.5 | 24.1 | Note ...: not applicable | 15.1 | 12.7 | 15.1 | Note ...: not applicable |
| 3 | 0.9 | 0.8 | Note ...: not applicable | Note ...: not applicable | 7.7 | 6.9 | Note ...: not applicable | Note ...: not applicable | 46.0 | 48.8 | Note ...: not applicable | Note ...: not applicable | 19.1 | 17.8 | Note ...: not applicable | Note ...: not applicable |
| 4 | 1.6 | 1.6 | Note ...: not applicable | Note ...: not applicable | 10.6 | 10.2 | Note ...: not applicable | Note ...: not applicable | 56.9 | 63.9 | Note ...: not applicable | Note ...: not applicable | 22.6 | 21.6 | Note ...: not applicable | Note ...: not applicable |
| 5 | 2.4 | 2.8 | Note ...: not applicable | Note ...: not applicable | 13.0 | 13.1 | Note ...: not applicable | Note ...: not applicable | 65.5 | 70.2 | Note ...: not applicable | Note ...: not applicable | 25.0 | 23.9 | Note ...: not applicable | Note ...: not applicable |
| 6 | 3.2 | 3.8 | Note ...: not applicable | Note ...: not applicable | 14.9 | 15.2 | Note ...: not applicable | Note ...: not applicable | 72.5 | 72.9 | Note ...: not applicable | Note ...: not applicable | 26.7 | 25.5 | Note ...: not applicable | Note ...: not applicable |
| 7 | 4.0 | 4.7 | Note ...: not applicable | Note ...: not applicable | 16.9 | 16.6 | Note ...: not applicable | Note ...: not applicable | 75.9 | 74.1 | Note ...: not applicable | Note ...: not applicable | 27.8 | 26.3 | Note ...: not applicable | Note ...: not applicable |
| 8 | 4.6 | Note ...: not applicable | Note ...: not applicable | Note ...: not applicable | 18.5 | Note ...: not applicable | Note ...: not applicable | Note ...: not applicable | 79.0 | Note ...: not applicable | Note ...: not applicable | Note ...: not applicable | 28.5 | Note ...: not applicable | Note ...: not applicable | Note ...: not applicable |
| 9 | 5.2 | Note ...: not applicable | Note ...: not applicable | Note ...: not applicable | 19.9 | Note ...: not applicable | Note ...: not applicable | Note ...: not applicable | 80.3 | Note ...: not applicable | Note ...: not applicable | Note ...: not applicable | 29.0 | Note ...: not applicable | Note ...: not applicable | Note ...: not applicable |
| 10 | 5.9 | Note ...: not applicable | Note ...: not applicable | Note ...: not applicable | 20.9 | Note ...: not applicable | Note ...: not applicable | Note ...: not applicable | 81.1 | Note ...: not applicable | Note ...: not applicable | Note ...: not applicable | 29.2 | Note ...: not applicable | Note ...: not applicable | Note ...: not applicable |
| Total count | 11,610 | 11,540 | 16,280 | 1,790 | 5,530 | 7,600 | 20,260 | 5,290 | 870 | 1,240 | 1,170 | 240 | 3,840 | 4,560 | 5,670 | 890 |
|
... not applicable x suppressed to meet the confidentiality requirements of the Statistics Act Notes: Counts are rounded to the nearest 10. SAWP = Seasonal Agricultural Worker Program, TFWP = Temporary Foreign Worker Program, and IMP = International Mobility Program. Source: Statistics Canada, Canadian Employer–Employee Dynamics Database. |
||||||||||||||||
Virtually 100% of the TFWs recruited under the SAWP have a designated occupation at a lower skill level, and the opportunities for them to obtain PR status are limited. Over 90% of TFWs who came to Canada through the SAWP and gained PR status did so through family sponsorship, while the majority of workers from other TFWP streams and the IMP transitioned to PR mainly through immigration programs under the Economic Class.
By subsector, TFWs who first entered crop production had the lowest transition rates (Table 3). For the 2005-to-2009 entry cohort, 6.1% of TFWs first entering crop production obtained PR by the 5th year after entry and 10.6% obtained it after the 10th year. TFWs entering animal production had the highest transition rates: 31.0% obtained PR by the 5th year after entry and 38.2% obtained PR by the 10th year. TFWs entering support activities had transition rates that fell between those of TFWs entering crop production and animal production.
| Entry cohort | Crop production | Animal production and aquaculture | Support activities for crop and animal production | |||||||||
|---|---|---|---|---|---|---|---|---|---|---|---|---|
| 2005 to 2009 | 2010 to 2014 | 2015 to 2019 | 2020 | 2005 to 2009 | 2010 to 2014 | 2015 to 2019 | 2020 | 2005 to 2009 | 2010 to 2014 | 2015 to 2019 | 2020 | |
| percent | ||||||||||||
| Year since first entry | ||||||||||||
| 1 | 0.9 | 0.7 | 0.9 | 1.4 | 6.6 | 4.4 | 3.4 | 3.8 | 3.2 | 2.9 | 1.7 | Note x: suppressed to meet the confidentiality requirements of the Statistics Act |
| 2 | 2.1 | 1.8 | 2.5 | Note ...: not applicable | 16.5 | 14.9 | 9.1 | Note ...: not applicable | 5.7 | 6.7 | 4.7 | Note ...: not applicable |
| 3 | 3.6 | 3.4 | Note ...: not applicable | Note ...: not applicable | 23.1 | 26.9 | Note ...: not applicable | Note ...: not applicable | 8.8 | 10.7 | Note ...: not applicable | Note ...: not applicable |
| 4 | 5.0 | 5.3 | Note ...: not applicable | Note ...: not applicable | 27.8 | 33.5 | Note ...: not applicable | Note ...: not applicable | 11.4 | 14.9 | Note ...: not applicable | Note ...: not applicable |
| 5 | 6.4 | 7.1 | Note ...: not applicable | Note ...: not applicable | 31.0 | 36.9 | Note ...: not applicable | Note ...: not applicable | 14.4 | 17.5 | Note ...: not applicable | Note ...: not applicable |
| 6 | 7.6 | 8.5 | Note ...: not applicable | Note ...: not applicable | 33.3 | 38.9 | Note ...: not applicable | Note ...: not applicable | 16.7 | 20.0 | Note ...: not applicable | Note ...: not applicable |
| 7 | 8.7 | 9.5 | Note ...: not applicable | Note ...: not applicable | 34.8 | 40.1 | Note ...: not applicable | Note ...: not applicable | 18.8 | 21.0 | Note ...: not applicable | Note ...: not applicable |
| 8 | 9.5 | Note ...: not applicable | Note ...: not applicable | Note ...: not applicable | 36.3 | Note ...: not applicable | Note ...: not applicable | Note ...: not applicable | 20.0 | Note ...: not applicable | Note ...: not applicable | Note ...: not applicable |
| 9 | 10.3 | Note ...: not applicable | Note ...: not applicable | Note ...: not applicable | 37.3 | Note ...: not applicable | Note ...: not applicable | Note ...: not applicable | 21.0 | Note ...: not applicable | Note ...: not applicable | Note ...: not applicable |
| 10 | 10.9 | Note ...: not applicable | Note ...: not applicable | Note ...: not applicable | 38.2 | Note ...: not applicable | Note ...: not applicable | Note ...: not applicable | 21.3 | Note ...: not applicable | Note ...: not applicable | Note ...: not applicable |
| Total count | 16,430 | 19,190 | 35,100 | 6,480 | 4,240 | 4,660 | 5,980 | 1,210 | 1,180 | 1,090 | 2,300 | 520 |
|
... not applicable x suppressed to meet the confidentiality requirements of the Statistics Act Note: Counts are rounded to the nearest 10. Source: Statistics Canada, Canadian Employer–Employee Dynamics Database. |
||||||||||||
Retention in primary agriculture after transition to permanent residency
This section examines the retention in primary agriculture of TFWs whose first employment was in primary agriculture between 2005 and 2018 and who obtained PR status between 2006 and 2019. Approximately 9,000 individuals are included in the analysis. These former TFWs are further grouped into three admission cohorts: 2006 to 2010, 2011 to 2015 and 2016 to 2019. The industry retention rates are examined up to five years after obtaining PR for the two earlier cohorts and up to one year for the 2020 cohort (Table 4).Note
| 2006 to 2010 | 2011 to 2015 | 2016 to 2019 | |||||||
|---|---|---|---|---|---|---|---|---|---|
| Stay | Move | No T4 earnings | Stay | Move | No T4 earnings | Stay | Move | No T4 earnings | |
| percent | |||||||||
| Overall | |||||||||
| PR admission year | 68.2 | 23.3 | 8.5 | 52.2 | 38.7 | 9.1 | 44.4 | 44.5 | 11.0 |
| Year 1 | 51.9 | 37.6 | 10.5 | 40.3 | 51.1 | 8.6 | 32.8 | 56.5 | 10.7 |
| Year 2 | 39.5 | 47.8 | 12.7 | 30.8 | 58.8 | 10.4 | Note ...: not applicable | Note ...: not applicable | Note ...: not applicable |
| Year 3 | 31.7 | 52.8 | 15.4 | 24.9 | 63.3 | 11.7 | Note ...: not applicable | Note ...: not applicable | Note ...: not applicable |
| Year 4 | 26.0 | 57.9 | 16.2 | 21.1 | 65.6 | 13.3 | Note ...: not applicable | Note ...: not applicable | Note ...: not applicable |
| Year 5 | 21.1 | 62.1 | 16.8 | 18.8 | 66.2 | 15.0 | Note ...: not applicable | Note ...: not applicable | Note ...: not applicable |
| Lower skill | |||||||||
| PR admission year | 57.1 | 32.8 | 10.0 | 45.8 | 46.0 | 8.2 | 31.4 | 56.1 | 12.5 |
| Year 1 | 42.9 | 47.5 | 9.7 | 33.5 | 59.9 | 6.6 | 24.1 | 66.8 | 9.1 |
| Year 2 | 29.2 | 60.6 | 10.2 | 24.7 | 68.0 | 7.3 | Note ...: not applicable | Note ...: not applicable | Note ...: not applicable |
| Year 3 | 25.3 | 62.4 | 12.4 | 17.7 | 73.6 | 8.7 | Note ...: not applicable | Note ...: not applicable | Note ...: not applicable |
| Year 4 | 18.9 | 67.8 | 13.3 | 14.7 | 76.2 | 9.1 | Note ...: not applicable | Note ...: not applicable | Note ...: not applicable |
| Year 5 | 16.0 | 70.3 | 13.7 | 13.4 | 75.8 | 10.9 | Note ...: not applicable | Note ...: not applicable | Note ...: not applicable |
| Higher skill | |||||||||
| PR admission year | 88.4 | 8.4 | 3.2 | 77.1 | 18.2 | 4.8 | 77.0 | 19.0 | 4.0 |
| Year 1 | 67.1 | 26.2 | 6.7 | 61.5 | 31.7 | 6.8 | 56.3 | 34.9 | 8.9 |
| Year 2 | 52.5 | 38.1 | 9.5 | 49.8 | 41.6 | 8.7 | Note ...: not applicable | Note ...: not applicable | Note ...: not applicable |
| Year 3 | 41.1 | 47.3 | 11.6 | 44.7 | 44.9 | 10.4 | Note ...: not applicable | Note ...: not applicable | Note ...: not applicable |
| Year 4 | 34.0 | 53.1 | 12.9 | 39.1 | 48.5 | 12.4 | Note ...: not applicable | Note ...: not applicable | Note ...: not applicable |
| Year 5 | 26.5 | 60.4 | 13.1 | 35.5 | 50.6 | 13.9 | Note ...: not applicable | Note ...: not applicable | Note ...: not applicable |
| Skill level unknown | |||||||||
| PR admission year | 59.5 | 28.2 | 12.3 | 46.7 | 38.9 | 14.4 | 51.3 | 35.2 | 13.5 |
| Year 1 | 46.2 | 37.9 | 15.9 | 38.5 | 47.2 | 14.3 | 35.7 | 47.2 | 17.1 |
| Year 2 | 37.9 | 42.7 | 19.4 | 29.2 | 52.4 | 18.4 | Note ...: not applicable | Note ...: not applicable | Note ...: not applicable |
| Year 3 | 29.4 | 47.2 | 23.5 | 24.9 | 55.9 | 19.2 | Note ...: not applicable | Note ...: not applicable | Note ...: not applicable |
| Year 4 | 25.8 | 50.9 | 23.2 | 20.9 | 56.4 | 22.7 | Note ...: not applicable | Note ...: not applicable | Note ...: not applicable |
| Year 5 | 21.6 | 53.8 | 24.6 | 17.4 | 58.0 | 24.7 | Note ...: not applicable | Note ...: not applicable | Note ...: not applicable |
|
... not applicable Notes: Counts are rounded to the nearest 10. PR = permanent residency. The "Overall" total count for the years 2006 to 2010 is 1,410; 2011 to 2015 is 3,500; 2016 to 2019 is 4,190. The "Lower skill" total count for the years 2006 to 2010 is 520; 2011 to 2015 is 1,900; 2016 to 2019 is 2,510. The "Higher skill" total count for years 2006 to 2010 is 470; 2011 to 2015 is 690; 2016 to 2019 is 820. The "Skill level unknown" total count for years 2006 to 2010 is 420; 2011 to 2015 is 900; 2016 to 2019 is 850. Source: Statistics Canada, Canadian Employer–Employee Dynamics Database. |
|||||||||
For all three PR admission cohorts, retention rates dropped rapidly with the number of years since the TR-PR transition. For the 2006-to-2010 cohort, 68.2% of those admitted to PR were working in primary agriculture in their PR admission year. The retention rate dropped to 31.7% in the third year after admission and to 21.1% in the fifth year after admission. In comparison, the rate of working in another industry sector increased over time. In the fifth year after PR admission, 62.1% of those admitted to PR had been working in another sector, a significant increase from the 52.8% -in the third year and the 23.3% in the PR admission year. Permanent residents who did not have T4 Statements of Remuneration Paid (slip) could have been self-employed or unemployed, worked while receiving off-the-record payment, or left Canada. Because these situations are indistinguishable in the analysis, they are grouped in the category “no T4 earnings.” In the year of PR admission, 8.5% of former TFWs in primary agriculture did not have positive T4 earnings, and the share increased gradually to 16.8% by the fifth year after admission.
For the 2011-to-2015 PR admission cohort, just over half (52.2%) of former TFWs still worked in the sector and 38.7% moved to another sector in the PR admission year. In the fifth year after PR admission, the percentage of former TFWs still employed in primary agriculture dropped to 18.8%, and 66.2% were employed outside primary agriculture.
The retention rate kept dropping for the 2016-to-2019 PR admission cohort, 44.4% worked in the sector and 44.5% were employed in other sectors in the PR admission year. One year after admission, the retention rate fell to 32.8% and the rate of working in another sector rose to 56.5%.
Retention in primary agriculture was much lower for former TFWs with a designated occupation at a lower skill level compared with those in one requiring a higher skill level. For the 2006-to-2010 PR admission cohort, retention rate of the PR admission year was 57.1% for those with lower-skill occupations and 88.4% for those with higher-skill occupations. In the fifth year after PR admission, the retention rate decreased to 16.0% for those with lower-skill occupations and 26.5% for those with higher-skill occupations. Meanwhile, the percentage of those who moved to another employment sector increased rapidly over time. By the fifth year after transitioning to PR, 73.0% of previous TFWs with lower-skill occupations and over 60% of those with higher-skill occupations had moved to other industries. The retention rate of former open work permit holders fell between these two rates but was closer to the rate of those who previously worked in lower-skill occupations.
In terms of the program, retention rates were lowest for former SAWP permit holders (Table 5). For the 2006-to-2010 cohort, in their PR admission year, 19.3% of former SAWP workers stayed in primary agriculture, while 52.9% worked in other industries. In the fifth year after PR admission, 80.0% shifted their employment to another industry. For the 2011-to-2015 cohort, in the fifth year after admission, 7.8% worked in primary agriculture and 76.1% worked in another industry.
Retention was higher for former TFWs under other agriculture TFWP streams than for former SAWP workers. For the 2006-to-2010 admission cohort, 84.2% of them were working in the sector in the admission year. The retention rate dropped to 66.4% one year after PR admission and to 33.0% in the fifth year after admission. The percentage of those who were working outside the sector was 12.1% in the PR admission year and reached 52.9% in the fifth year after admission.
The sector retention rates for former TFWs who held permits issued under non-agricultural TFWP streams and the IMP were generally lower compared with those of former TFWs with a permit issued under other agricultural TFWPs but much higher than those of former SAWP workers.
| 2006 to 2010 | 2011 to 2015 | 2016 to 2019 | |||||||
|---|---|---|---|---|---|---|---|---|---|
| Stay | Move | No T4 earnings | Stay | Move | No T4 earnings | Stay | Move | No T4 earnings | |
| percent | |||||||||
| By program | |||||||||
| Seasonal Agricultural Worker Program | |||||||||
| PR admission year | 19.3 | 52.9 | 27.9 | 17.2 | 62.1 | 20.8 | 14.4 | 63.8 | 21.8 |
| Year 1 | 17.9 | 67.1 | 15.0 | 14.5 | 73.9 | 11.6 | 12.7 | 74.9 | 12.4 |
| Year 2 | 11.4 | 76.4 | 12.1 | 11.4 | 76.6 | 12.1 | Note ...: not applicable | Note ...: not applicable | Note ...: not applicable |
| Year 3 | 10.7 | 77.1 | 12.1 | 10.0 | 75.4 | 14.5 | Note ...: not applicable | Note ...: not applicable | Note ...: not applicable |
| Year 4 | Note x: suppressed to meet the confidentiality requirements of the Statistics Act | 77.9 | Note x: suppressed to meet the confidentiality requirements of the Statistics Act | 8.5 | 77.9 | 13.6 | Note ...: not applicable | Note ...: not applicable | Note ...: not applicable |
| Year 5 | Note x: suppressed to meet the confidentiality requirements of the Statistics Act | 80.0 | Note x: suppressed to meet the confidentiality requirements of the Statistics Act | 7.8 | 76.1 | 16.1 | Note ...: not applicable | Note ...: not applicable | Note ...: not applicable |
| Temporary Foreign Worker Program, other agricultural | |||||||||
| PR admission year | 84.2 | 12.1 | 3.7 | 62.7 | 31.6 | 5.6 | 55.3 | 36.5 | 8.2 |
| Year 1 | 66.4 | 27.3 | 6.3 | 51.2 | 41.9 | 6.9 | 41.6 | 49.1 | 9.3 |
| Year 2 | 53.2 | 37.4 | 9.5 | 41.0 | 51.3 | 7.7 | Note ...: not applicable | Note ...: not applicable | Note ...: not applicable |
| Year 3 | 44.3 | 44.8 | 10.9 | 35.2 | 55.1 | 9.7 | Note ...: not applicable | Note ...: not applicable | Note ...: not applicable |
| Year 4 | 39.7 | 46.6 | 13.8 | 32.8 | 56.8 | 10.5 | Note ...: not applicable | Note ...: not applicable | Note ...: not applicable |
| Year 5 | 33.0 | 52.9 | 14.1 | 30.4 | 57.7 | 11.9 | Note ...: not applicable | Note ...: not applicable | Note ...: not applicable |
| Temporary Foreign Worker Program, other | |||||||||
| PR admission year | 69.0 | 27.5 | 3.5 | 54.8 | 42.3 | 2.9 | 31.3 | 66.4 | 2.3 |
| Year 1 | 46.8 | 43.3 | 9.9 | 35.3 | 61.5 | 3.2 | 19.8 | 76.2 | 4.0 |
| Year 2 | 31.0 | 56.7 | 12.3 | 24.1 | 71.2 | 4.7 | Note ...: not applicable | Note ...: not applicable | Note ...: not applicable |
| Year 3 | 27.1 | 56.3 | 16.5 | 13.7 | 81.7 | 4.6 | Note ...: not applicable | Note ...: not applicable | Note ...: not applicable |
| Year 4 | 16.2 | 68.7 | 15.1 | 9.2 | 85.0 | 5.8 | Note ...: not applicable | Note ...: not applicable | Note ...: not applicable |
| Year 5 | 12.7 | 72.2 | 15.1 | 7.7 | 84.7 | 7.6 | Note ...: not applicable | Note ...: not applicable | Note ...: not applicable |
| International Mobility Program | |||||||||
| PR admission year | 69.8 | 21.2 | 9.0 | 54.9 | 32.9 | 12.2 | 59.5 | 29.7 | 10.8 |
| Year 1 | 53.7 | 34.1 | 12.2 | 44.9 | 42.1 | 12.9 | 42.9 | 42.6 | 14.5 |
| Year 2 | 42.0 | 43.1 | 14.8 | 35.0 | 48.7 | 16.3 | Note ...: not applicable | Note ...: not applicable | Note ...: not applicable |
| Year 3 | 31.6 | 50.2 | 18.2 | 30.6 | 51.6 | 17.8 | Note ...: not applicable | Note ...: not applicable | Note ...: not applicable |
| Year 4 | 26.5 | 54.8 | 18.6 | 25.3 | 53.5 | 21.1 | Note ...: not applicable | Note ...: not applicable | Note ...: not applicable |
| Year 5 | 21.5 | 58.6 | 19.9 | 21.7 | 55.5 | 22.8 | Note ...: not applicable | Note ...: not applicable | Note ...: not applicable |
| By subsector | |||||||||
| Crop production | |||||||||
| PR admission year | 49.7 | 36.0 | 14.3 | 36.7 | 49.7 | 13.6 | 38.1 | 47.2 | 14.7 |
| Year 1 | 40.9 | 46.2 | 12.8 | 30.0 | 58.5 | 11.4 | 27.9 | 59.8 | 12.3 |
| Year 2 | 33.0 | 51.4 | 15.6 | 22.6 | 63.7 | 13.7 | Note ...: not applicable | Note ...: not applicable | Note ...: not applicable |
| Year 3 | 25.1 | 55.8 | 19.1 | 19.0 | 66.1 | 15.0 | Note ...: not applicable | Note ...: not applicable | Note ...: not applicable |
| Year 4 | 22.9 | 57.2 | 19.8 | 17.2 | 66.4 | 16.4 | Note ...: not applicable | Note ...: not applicable | Note ...: not applicable |
| Year 5 | 19.6 | 60.2 | 20.2 | 15.4 | 66.4 | 18.1 | Note ...: not applicable | Note ...: not applicable | Note ...: not applicable |
| Animal production and aquaculture | |||||||||
| PR admission year | 81.5 | 14.7 | 3.7 | 68.2 | 27.4 | 4.4 | 54.9 | 40.0 | 5.1 |
| Year 1 | 60.8 | 31.4 | 7.8 | 51.5 | 43.6 | 4.9 | 41.2 | 51.2 | 7.7 |
| Year 2 | 44.9 | 45.3 | 9.9 | 39.7 | 53.6 | 6.8 | Note ...: not applicable | Note ...: not applicable | Note ...: not applicable |
| Year 3 | 37.3 | 51.4 | 11.3 | 31.3 | 60.5 | 8.2 | .... | Note ...: not applicable | Note ...: not applicable |
| Year 4 | 28.5 | 59.5 | 12.1 | 25.5 | 64.5 | 10.0 | Note ...: not applicable | Note ...: not applicable | Note ...: not applicable |
| Year 5 | 22.7 | 64.4 | 12.9 | 22.6 | 65.8 | 11.6 | Note ...: not applicable | Note ...: not applicable | Note ...: not applicable |
| Support activities for crop and animal production | |||||||||
| PR admission year | 63.8 | Note x: suppressed to meet the confidentiality requirements of the Statistics Act | Note x: suppressed to meet the confidentiality requirements of the Statistics Act | 37.9 | 48.4 | 13.7 | 42.9 | 46.0 | 11.1 |
| Year 1 | 40.0 | 38.8 | 21.3 | 27.0 | 56.6 | 16.4 | 29.6 | 56.6 | 13.7 |
| Year 2 | 31.3 | 47.5 | 21.3 | 20.7 | 64.1 | 15.2 | Note ...: not applicable | Note ...: not applicable | Note ...: not applicable |
| Year 3 | 22.5 | 46.3 | 31.3 | 18.0 | 66.0 | 16.0 | Note ...: not applicable | Note ...: not applicable | Note ...: not applicable |
| Year 4 | 22.5 | 46.3 | 31.3 | 15.2 | 67.6 | 17.2 | Note ...: not applicable | Note ...: not applicable | Note ...: not applicable |
| Year 5 | Note x: suppressed to meet the confidentiality requirements of the Statistics Act | 52.5 | Note x: suppressed to meet the confidentiality requirements of the Statistics Act | 13.3 | 67.2 | 19.5 | Note ...: not applicable | Note ...: not applicable | Note ...: not applicable |
|
... not applicable x suppressed to meet the confidentiality requirements of the Statistics Act Notes: Counts are rounded to the nearest 10. PR = permanent residency. The "Seasonal Agricultural Worker Program" total count for the years 2006 to 2010 is 140; 2011 to 2015 is 450; 2016 to 2019 is 900. The "Temporary Foreign Worker Program, other agricultural" total count for the years 2006 to 2010 is 350; 2011 to 2015 is 970; 2016 to 2019 is 1,550. The "Temporary Foreign Worker Program, other" total count for years 2006 to 2010 is 280; 2011 to 2015 is 890; 2016 to 2019 is 580. The "International Mobility Program" total count for years 2006 to 2010 is 630; 2011 to 2015 is 1,180; 2016 to 2019 is 1,170. The "Crop production" total count for years 2006 to 2010 is 550; 2011 to 2015 is 1,530; 2016 to 2019 is 2,450. The "Animal production and aquaculture" total count for years 2006 to 2010 is 780; 2011 to 2015 is 1,710; 2016 to 2019 is 1,520. The "Support activities for crop and animal production" total count for years 2006 to 2010 is 80; 2011 to 2015 is 260; 2016 to 2019 is 230. Source: Statistics Canada, Canadian Employer–Employee Dynamics Database. |
|||||||||
By subsector, the retention rates in primary agriculture were much lower for those who first entered crop production, compared with those who first entered animal production. For the 2006-to-2010 admission cohort, retention in the PR admission year was 49.7% for those who first entered crop production, nearly 32 percentage points less than for those who first entered animal production (81.5%). Retention rates for former TFWs who first entered in support activities generally fell between those of former TFWs who first entered crop production and animal production.
Conclusion
This study examined the rate of transition to permanent residency (PR) of temporary foreign workers (TFW ) whose first employment in Canada was in primary agriculture between 2005 and 2020 and the rate of retention in primary agriculture among those who obtained PR status.
The results show that PR transition and sector retention rates after PR transition were low among these TFWs. Five years after entry, slightly more than 10% obtained PR. After 10 years since they were first employed in the sector, the transition rate of the 2005-to-2009 entry cohort reached 16.8%.
The majority of TFWs in primary agriculture had a designated occupation at a lower skill level, and their transition rates were lower compared with those with an occupation at a higher skill level in the sector. Over four-fifths of new entrants in primary agriculture were hired in crop production, and their PR transition rates were lower relative to those in animal production and support activities. The PR transition rates were particularly low for SAWP participants compared with TFWs who held work permits issued under other TFWPs and the IMP. Over 90% of SAWP permit holders who gained PR status did so through family sponsorship, while most of others transitioned to PR mainly through economic immigration programs.
Most former TFWs who entered in primary agriculture and transitioned to PR soon left the sector. In the PR admission year, more than two-fifth of them were employed in the sector. The retention rate fell to around one-fifth five years after PR admission.
TFWs who began employment in a lower-skill occupation were less likely to stay in primary agriculture compared with those who started in one requiring a higher skill level. Former TFWs who first entered crop production were less likely to stay in primary agriculture compared with those who first entered animal production or support activities. TFWs with permits issued through the SAWP had the lowest retention rates across all recruiting streams for foreign agricultural workers.
The considerably low retention rates imply that providing TFWs in primary agriculture the PR status may not solve the problem of labour supply shortage in the sector. However, offering work opportunities and TR-PR transition pathways to foreign workers made great contributions to Canadian agriculture production and have great positive effects to the Canadian economy.
References
Akbar, M. (2022). Who are Canada’s temporary foreign workers? Policy evolution and a pandemic reality, International Migration, Vol (60) 4, pp 48-60.
Alboim, N. & Cohl, K. (2020). More agricultural workers should become permanent residents. Policy Options.
Meyer-Robinson, R., & Burt, M. (2016). Sowing the Seeds of Growth: Temporary Foreign Workers in Agriculture. Ottawa: The Conference Board of Canada.
Royal Bank of Canada. (2023). Farmers Wanted: The labour renewal Canada needs to build the Next Green Revolution. (Accessed on May 9, 2023).
Zhang, Y., Ostrovsky, Y., & Arsenault, A. (2021). Foreign workers in the Canadian agriculture industry. Statistics Canada. Economic and Social Reports. Vol (1) 4. Catalogue no. 36-28-0001, ISSN 2563-8955.
- Date modified: