
Economic and Social Reports
The post-2001 productivity growth divergence between Canada and the United States: The role of the information and cultural services industry
DOI: https://doi.org/10.25318/36280001202301200006-eng
Text begins
Canada and the United States share a deep economic relationship marked by intricate supply chains and infrastructure networks. While the performances of the two economies have diverged for brief periods, indicators, such as real gross domestic product and employment, typically show a tight common trend over the long term. The period from 1961 to 2001 in Chart 1 underscores the interconnectedness of both economies.
During this period, annual labour productivity growth averaged 2.3% for both countries. Stronger growth in Canada relative to the United States in the mid-1970s and early 1980s was balanced by slower growth in the late 1980s. However, the significant and prolonged gap in labour productivity growth between Canada and the United States after 2001 stands as an unprecedented development compared with the previous four decades. From 2001 to 2021, the United States observed a moderate deceleration in labour productivity to 2.0% per year, while Canada’s growth rate fell to 0.9% per year.

Data table for Chart 1
| Canada | United States | |
|---|---|---|
| index 100 = 1961 | ||
| 1961 | 100.00 | 100.00 |
| 1962 | 104.65 | 104.66 |
| 1963 | 109.31 | 108.89 |
| 1964 | 113.82 | 113.89 |
| 1965 | 118.65 | 118.00 |
| 1966 | 121.56 | 122.79 |
| 1967 | 122.72 | 125.58 |
| 1968 | 130.32 | 129.55 |
| 1969 | 134.56 | 130.23 |
| 1970 | 139.29 | 133.07 |
| 1971 | 142.67 | 138.89 |
| 1972 | 148.32 | 143.15 |
| 1973 | 152.00 | 147.78 |
| 1974 | 152.45 | 145.59 |
| 1975 | 155.21 | 150.78 |
| 1976 | 166.22 | 155.91 |
| 1977 | 172.61 | 158.35 |
| 1978 | 173.76 | 160.22 |
| 1979 | 171.82 | 160.21 |
| 1980 | 171.85 | 159.85 |
| 1981 | 175.27 | 163.16 |
| 1982 | 179.68 | 162.16 |
| 1983 | 185.60 | 167.97 |
| 1984 | 191.61 | 172.65 |
| 1985 | 193.91 | 176.67 |
| 1986 | 192.51 | 182.12 |
| 1987 | 194.17 | 183.21 |
| 1988 | 197.26 | 185.99 |
| 1989 | 198.21 | 188.06 |
| 1990 | 198.32 | 191.86 |
| 1991 | 198.05 | 195.17 |
| 1992 | 202.61 | 204.15 |
| 1993 | 205.99 | 204.45 |
| 1994 | 211.04 | 205.71 |
| 1995 | 213.15 | 207.27 |
| 1996 | 212.02 | 212.30 |
| 1997 | 218.66 | 216.74 |
| 1998 | 223.88 | 224.14 |
| 1999 | 232.17 | 233.30 |
| 2000 | 242.37 | 240.52 |
| 2001 | 246.26 | 247.40 |
| 2002 | 249.60 | 258.05 |
| 2003 | 250.25 | 268.06 |
| 2004 | 251.91 | 276.42 |
| 2005 | 257.54 | 282.56 |
| 2006 | 261.39 | 285.61 |
| 2007 | 262.13 | 290.09 |
| 2008 | 259.57 | 294.52 |
| 2009 | 257.23 | 307.21 |
| 2010 | 260.77 | 317.43 |
| 2011 | 266.38 | 316.31 |
| 2012 | 266.10 | 318.23 |
| 2013 | 271.25 | 321.21 |
| 2014 | 281.16 | 322.53 |
| 2015 | 280.26 | 326.25 |
| 2016 | 282.69 | 328.41 |
| 2017 | 287.76 | 332.02 |
| 2018 | 288.82 | 337.20 |
| 2019 | 290.61 | 343.74 |
| 2020 | 315.61 | 359.11 |
| 2021 | 296.99 | 366.84 |
| Sources: Authors’ calculations using Statistics Canada and Bureau of Labor Statistics data. | ||
This article summarizes recent research by Gu and Willox (2023) at Statistics Canada, focusing on the information and cultural services industry’s competitive intensity and its role in the Canada–U.S. labour productivity gap since 2001. The information and cultural services industry stands out because of its significant contribution to the slower labour productivity growth in Canada’s business sector from 2001 to 2019 compared with the United States.Note While labour productivity growth in the information and cultural services industry from 2001 to 2019 was nearly two-thirds higher than it was for the business sector in Canada, the same industry in the United States recorded growth nearly four times higher than the U.S. business sector. The key motivation for the study was to understand how such a large disparity in economic performances can persist between two highly integrated economies. The high degree of integration that promotes sharing of the technologies and innovation that drive labour productivity growth should make the growth in one economy achievable in the other over the long term in the absence of market failures. The study’s main finding is that higher levels of market power in the information and cultural services industry in Canada compared with the United States are an important factor in explaining the two-decade-long divergence.
The significance of the divergence between Canada and the United States in the information and cultural services industry is especially stark when comparing its performance before and after 2001. In Canada, the industry’s average annual labour productivity growth dropped by 0.98 percentage points, from 2.50% (1987 to 2001) to 1.52% (2001 to 2019), while in the United States, it experienced a remarkable gain of 6.37 percentage points, rising from 1.42% (1987 to 2001) to 7.79% (2001 to 2019).
This divergence in labour productivity growth in information and cultural services in the two countries can be traced to three contributing elements: capital intensity (the amount of capital used by workers), labour composition (shifts in the workforce toward higher skills, education and experience) and total factor productivity (TFP) (efficiency in production influenced by technology and innovation). Capital intensity can be further categorized into information and communications technology (ICT) and non-ICT capital intensity.Note In the information and cultural services industry, the contribution to labour productivity growth from ICT capital intensity decreased by 1.68 percentage points in Canada (from 2.15% to 0.48%) but increased by 0.87 percentage points in the United States (from 2.19% to 3.06%). TFP growth in Canada rose from -0.10% to 0.52%, a positive shift of 0.61 percentage points, whereas TFP growth in the United States saw a substantial increase from -0.83% to 2.81%, a shift of 3.64 percentage points. In terms of shifts toward more skilled workers, Canada changed little from 0.15% to 0.16%, whereas the United States saw a substantial increase from 0.17% to 0.49%.
In addition, a lack of competitive intensity in the information and cultural services industry allows dominant firms to gain market power, which enables them to set higher prices without the threat of being undercut by competitors; this leads to higher prices for consumers, including individuals, governments and other businesses (see Chart 2). From 1987 to 2001, the information sector’s output price grew slower in Canada (0.79% annually) than in the United States (1.75%). However, from 2001 to 2019, Canada’s output price accelerated to 1.18% annually, while the U.S. price declined by 0.07% annually, contrasting with trends in the broader business sector.

Data table for Chart 2
| Canada | United States | Difference | |
|---|---|---|---|
| index 100 = 2001 | |||
| 1987 | 89.53 | 78.48 | 114.08 |
| 1988 | 89.34 | 80.41 | 111.11 |
| 1989 | 90.74 | 82.94 | 109.40 |
| 1990 | 92.66 | 85.57 | 108.29 |
| 1991 | 93.81 | 88.61 | 105.88 |
| 1992 | 95.79 | 89.61 | 106.90 |
| 1993 | 96.82 | 91.11 | 106.27 |
| 1994 | 97.34 | 92.61 | 105.11 |
| 1995 | 98.66 | 94.54 | 104.36 |
| 1996 | 99.86 | 96.75 | 103.22 |
| 1997 | 100.22 | 98.49 | 101.76 |
| 1998 | 101.39 | 98.16 | 103.29 |
| 1999 | 99.65 | 98.62 | 101.04 |
| 2000 | 99.39 | 99.34 | 100.05 |
| 2001 | 100.00 | 100.00 | 100.00 |
| 2002 | 100.87 | 100.20 | 100.66 |
| 2003 | 102.81 | 100.70 | 102.10 |
| 2004 | 104.13 | 100.75 | 103.35 |
| 2005 | 105.73 | 99.78 | 105.97 |
| 2006 | 106.89 | 99.78 | 107.13 |
| 2007 | 109.31 | 100.09 | 109.21 |
| 2008 | 111.68 | 100.51 | 111.11 |
| 2009 | 112.40 | 99.49 | 112.98 |
| 2010 | 113.48 | 98.79 | 114.87 |
| 2011 | 116.28 | 98.88 | 117.60 |
| 2012 | 117.69 | 99.55 | 118.22 |
| 2013 | 119.05 | 99.85 | 119.23 |
| 2014 | 120.18 | 99.84 | 120.36 |
| 2015 | 120.46 | 98.58 | 122.19 |
| 2016 | 121.43 | 98.62 | 123.13 |
| 2017 | 122.46 | 98.04 | 124.90 |
| 2018 | 123.24 | 98.26 | 125.42 |
| 2019 | 123.59 | 98.69 | 125.23 |
| Sources: Statistics Canada; Bureau of Economic Analysis; Bureau of Labor Statistics; and authors’ calculations. | |||
These changes in output prices coincided with the nadir of the dot-com recession. In the aftermath of this recession, only the strongest competitors were left to absorb the displaced labour and capital resources of weaker, less competitive firms, according to Kraay and Ventura (2007), leading to gains in capital intensity and TFP growth in the United States. In Canada, TFP growth improved, but by one-sixth the rate of the United States. By contrast to the United States, capital intensity growth fell in the information and cultural services industry in Canada, resulting in a weakening of labour productivity growth.
The shift in competitive intensity in the information and cultural services industry may have started with the dot-com recession, but it may persist partly because of trade restrictions limiting foreign ownership. The Organisation for Economic Co-operation and Development (OECD) Services Trade Restrictiveness Index for global services trade barriers indicates that from 2014 to 2022, Canada had substantially higher barriers to foreign competition in two sub-industries of the information and cultural services industry, motion pictures and broadcasting, compared with its Group of Seven (G7) peers and especially the United States. However, the telecommunications sub-industry stands out as a clear outlier, with trade restrictions over 80% higher than in the United States and roughly 60% higher than the OECD and G7.
To assess the impact of elevated output prices on labour productivity growth in Canada, Gu and Willox (2023) explore how labour productivity growth in Canada would be affected if the output price for the information and cultural services industry in Canada had grown at the pace it did in the United States. To do so, the authors use the difference between the industry’s output prices in each country as a measure of a markup in Canada’s information and cultural services industry.Note Therefore, changes in the industry’s markup are interpreted as changes in the relative market power.
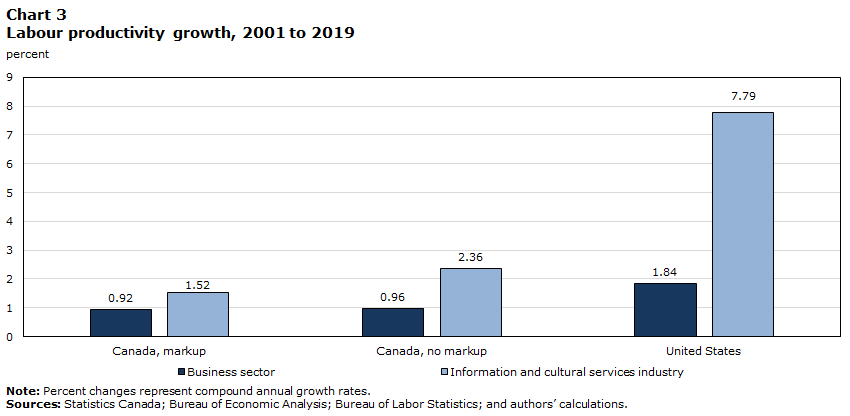
The analysis employs Hall’s (2018) well-recognized framework linking markups and labour productivity growth to examine how the markup in the information and cultural services industry affects its own labour productivity growth and the labour productivity growth of the entire business sector. Key results are presented in Chart 3.
Data table for Chart 3
| Canada, markup | Canada, no markup | United States | |
|---|---|---|---|
| percent | |||
| Business sector | 0.92 | 0.96 | 1.84 |
| Information and cultural services industry | 1.52 | 2.36 | 7.79 |
|
Note: Percent changes represent compound annual growth rates. Sources: Statistics Canada; Bureau of Economic Analysis; Bureau of Labor Statistics; and authors’ calculations. |
|||
The first two bars, labelled “Canada, markup,” display labour productivity growth in Canada, where the markup effect on the information and cultural services industry remains. The second set of bars reflects the impact of aligning the output price of Canada’s information and cultural services industry with the United States from 2001 to 2019, effectively removing the markup and boosting the industry’s annual labour productivity growth by 0.84 percentage points.
Considering this industry’s roughly 4% share in the business sector output, removing its markup had a modest effect on aggregate annual business sector labour productivity growth, lifting it by 0.04 percentage points. This implies that if the information and cultural services industry’s output price matched that of the United States, the 2019 business sector labour productivity gap would be about 4% smaller.
The persistent divergence in labour productivity growth between Canada and the United States after 2001 highlights the industry’s importance since the dot-com recession, potentially leading to different competitive paths in each country. This divergence relates to post-2001 output price growth and trade restrictions.
The results in this paper may be regarded as confirming that market power in the information and cultural services industry has had a negative impact on labour productivity growth and the living standards of Canadians. It represents a minimalist or partial estimate of the potential for eliminating market power to reduce the Canada–U.S. labour productivity growth gap. Since 2001, the information and cultural services industry in Canada has had lower capital intensity contribution, lower TFP growth and slower shifts toward more skilled workers. Eliminating market power associated with limited competitive intensity has the potential to increase investment, technical progress and innovation, and to close the Canada–U.S. labour productivity growth gap in the information and cultural services industry and the aggregate business sector.
The information and cultural services industry was not alone in experiencing weaker labour productivity growth after 2001, suggesting that a general lack of innovation and technical change and weak investment may be a more pervasive issue across the Canadian economy in general that is most serious in the information and cultural services industry. For example, in the computer and electronic product manufacturing industry, professional services, and the oil and gas sector, Canada had much slower labour productivity growth than the United States after 2001.
Authors
Wulong Gu and Michael Willox are with the Economic Analysis Division, Analytical Studies and Modelling Branch, at Statistics Canada.
References
Gu, W., & Willox, M. (Forthcoming, 2023). “The Post-2000 Productivity Growth Divergence between Canada and the United States,” International Productivity Monitor, Fall, No. 45.
Hall, R. E. (2018). New evidence on the markup of prices over marginal costs and the role of mega-firms in the US economy (No. w24574). National Bureau of Economic Research.
Kraay, A., & Ventura, J. (2007). The dot-com bubble, the Bush deficits, and the U.S. current account. In G7 Current Account Imbalances: Sustainability and Adjustment (pp. 457-496). University of Chicago Press.
- Date modified: